. 2025 Feb;242(2):427-447.
doi: 10.1007/s00213-024-06694-7. Epub 2024 Sep 30.

The ultrasonic vocalization (USV) syllable profile during neonatal opioid withdrawal and a kappa opioid receptor component to increased USV emissions in female mice

Affiliations

The ultrasonic vocalization (USV) syllable profile during neonatal opioid withdrawal and a kappa opioid receptor component to increased USV emissions in female mice

Kelly K Wingfield et al. Psychopharmacology (Berl). 2025 Feb.

Abstract

Rationale: Opioid use during pregnancy can lead to negative infant health outcomes, including neonatal opioid withdrawal syndrome (NOWS). NOWS comprises gastrointestinal, autonomic nervous system, and neurological dysfunction that manifest during spontaneous withdrawal. Variability in NOWS severity necessitates a more individualized treatment approach. Ultrasonic vocalizations (USVs) in neonatal mice are emitted in isolation as a stress response and are increased during opioid withdrawal, thus modeling a negative affective state that can be utilized to test new treatments.

Objectives: We sought to identify the behavioral and USV profile, brainstem transcriptomic adaptations, and role of kappa opioid receptors in USVs during neonatal opioid withdrawal.

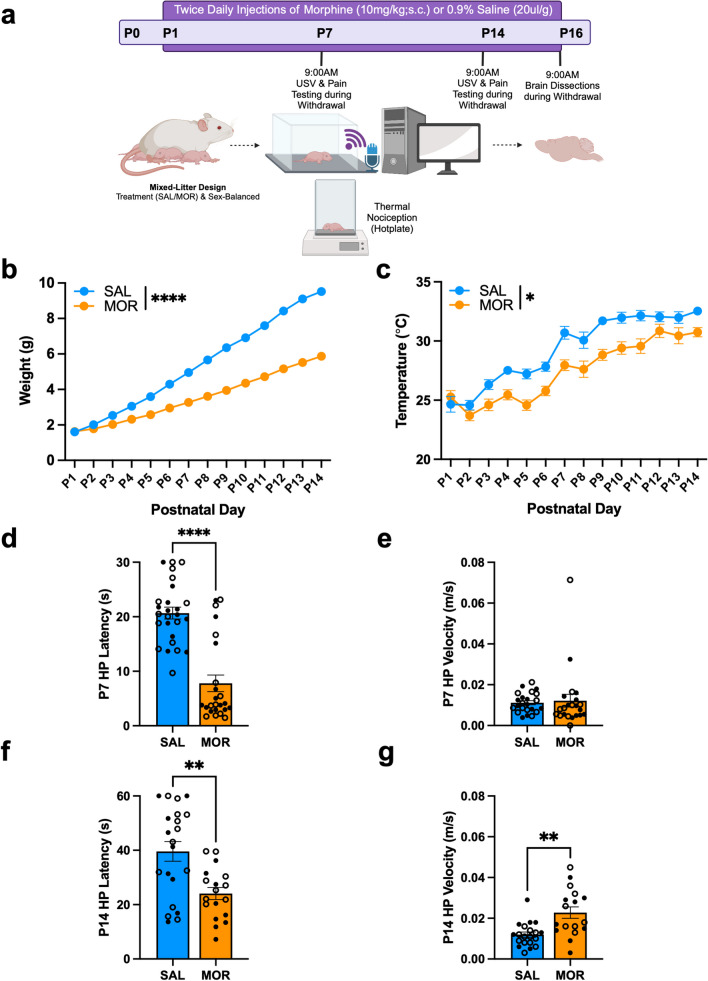
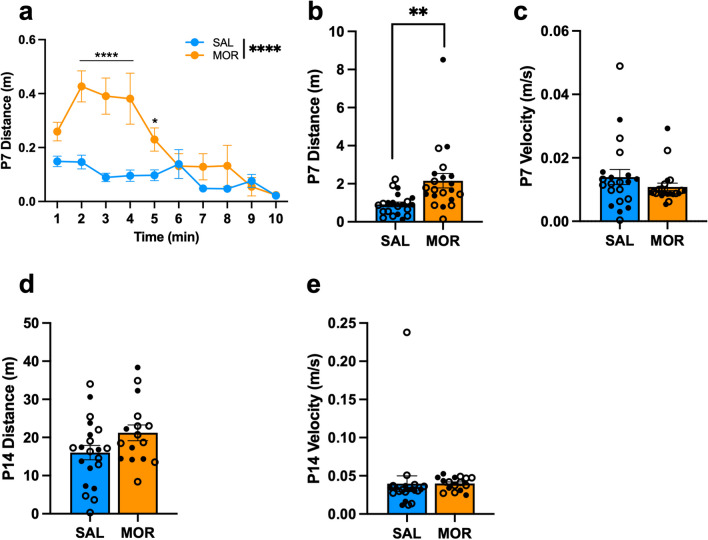
Methods: We employed a third trimester-approximate opioid exposure model, where neonatal inbred FVB/NJ pups were injected twice-daily with morphine (10mg/kg, s.c.) or saline (0.9%, 20 ul/g, s.c.) from postnatal day(P) 1 to P14. This protocol induces reduced weight gain, hypothermia, thermal hyperalgesia, and increased USVs during spontaneous morphine withdrawal.

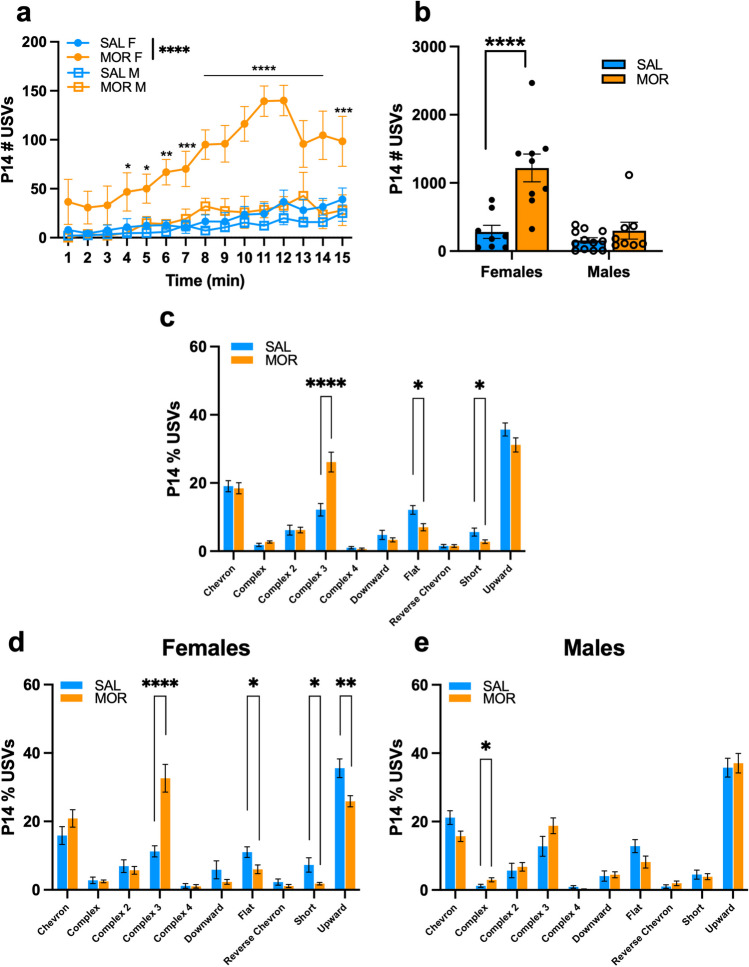
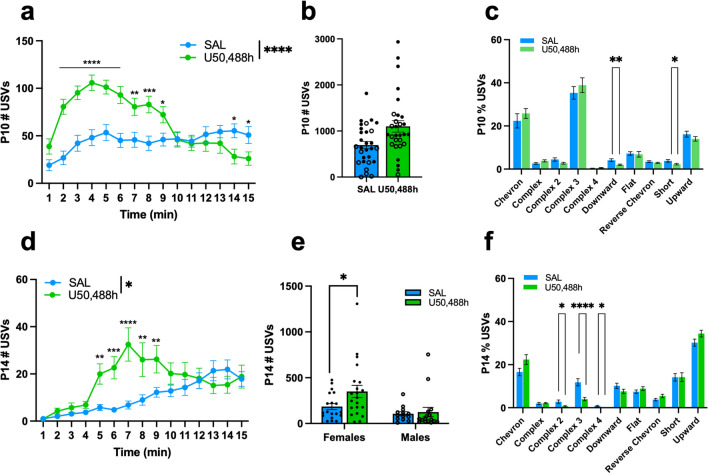
Results: On P14, there were increased USV emissions and altered USV syllables during withdrawal, including an increase in Complex 3 syllables in FVB/NJ females (but not males). Brainstem bulk mRNA sequencing revealed an upregulation of the kappa opioid receptor (Oprk1), which contributes to withdrawal-induced dysphoria. The kappa opioid receptor (KOR) antagonist, nor-BNI (30 mg/kg, s.c.), significantly reduced USVs in FVB/NJ females, but not males during spontaneous morphine withdrawal. Furthermore, the KOR agonist, U50,488h (0.625 mg/kg, s.c.), was sufficient to increase USVs on P10 (both sexes) and P14 (females only) in FVB/NJ mice.

Conclusions: We identified an elevated USV syllable, Complex 3, and a female-specific recruitment of the dynorphin/KOR system in increased USVs associated with neonatal opioid withdrawal severity.

Keywords: Brainstem; Emotional-affective withdrawal; Kappa opioid receptor; Morphine; Neonatal opioid withdrawal syndrome; RNA-seq; Sex differences; Spectrotemporal profile; Transcriptome; Ultrasonic vocalizations.


Conflict of interest statement

Declarations. Conflicts of interest: The authors have nothing to disclose.

Figures

Fig. 1
Fig. 1
Morphine exposure from P1–P14 is sufficient to induce opioid withdrawal traits in neonatal FVB/NJ pups. Data are plotted as the mean ± SEM. Saline = blue lines/bars; Morphine = orange lines/bars. Closed circles = Females; Open circles = males. (a) Experimental Timeline. (b) Body Weight: The effect of Morphine Treatment on body weight was dependent on Postnatal day (β = -0.30, SE = 0.0055, t(611) = -54.38, ****p < 0.0001), where morphine-withdrawn pups weighed significantly less than saline-treated pups from P3 (**p = 0.0013) – P14 (P4 – P14: ****p < 0.0001). (c) Temperature: The effect of Morphine Treatment on body temperature was dependent on Postnatal day (β = -0.087, SE = 0.041, t(611) = -2.12, *p = 0.035), where morphine-withdrawn pups displayed hypothermia compared to saline-treated pups from P3–P11 and P13 – P14 (all *p ≤ 0.026). SAL, n = 25 (11F, 14M); MOR, n = 22 (11F, 11M). (d) P7 Hot Plate Latency: There was no effect of Sex (β = 0.49, SE = 2.64, t(46) = 0.19, p = 0.85) or a Morphine Treatment x Sex interaction (β = 0.26, SE = 3.81, t(46) = 0.068, p = 0.95). The simplified model revealed that Morphine Treatment was associated with a decrease in hot plate latency compared to saline controls (β = -12.88, SE = 1.86, t(48) = -6.91, ****p < 0.0001). (e) P7 Hot Plate Velocity: There was no effect of Sex (β = 0.00037, SE = 0.005, t(39) = 0.076, p = 0.94) or a Morphine Treatment x Sex interaction (β =0.0030, SE = 0.0069, t(39) = 0.43, p = 0.67). The simplified model revealed that Morphine Treatment had no effect on hot plate velocity (β = 0.001, SE = 0.0034, t(41) = 0.27, p = 0.79). SAL, n = 23–26 (11–12F, 12–14M); MOR, n = 22–24 (12–13F, 10–11M). (f) P14 Hot Plate Latency: There was no effect of Sex (β = 1.089, SE = 6.085, t(35) = 0.18, p = 0.86) or a Morphine Treatment x Sex interaction (β = 7.33, SE = 8.91, t(35) = 0.82, p = 0.67). The simplified model revealed that Morphine Treatment was associated with decreased hot plate latency compared to saline controls (β = -15.50, SE = 4.42, t(37) = -3.51, **p = 0.0012). (g) P14 Hot Plate Velocity: There was no effect of Sex (β = -0.0047, SE = 0.0041, t(33) = -1.15, p = 0.23) or a Morphine Treatment x Sex interaction (β = 0.0094, SE = 0.0059, t(33) = 1.58, p = 0.12). The simplified model revealed that Morphine Treatment was associated with increased hot plate velocity compared to saline controls (β = 0.011, SE = 0.0030, t(35) = 3.67, ***p = 0.00081). SAL, n = 20–21 (8–9F, 12M); MOR, n = 17–18 (9F, 8–9M)
Fig. 2
Fig. 2
Locomotor activity during USV assessment of FVB/NJ pups undergoing spontaneous morphine withdrawal on P7 and P14. Data are plotted as the mean ± SEM. Saline = blue lines/bars; Morphine = orange lines/bars. Closed circles = Females; Open circles = males. (a) P7 Distance: The effect of Morphine Treatment on USV distance was dependent on Time (β = -0.030, SE = 0.0056, t(378) = -5.34, ****p < 0.0001), where morphine-withdrawn pups traveled a greater distance than saline controls from 2 – 5 min of the recording session (all *padj ≤ 0.031). (b) P7 Total Distance: There was no effect of Sex (β = -0.11, SE = 0.58, t(38) = -0.20, p = 0.85) or a Morphine Treatment x Sex interaction (β = -0.73, SE = 0.80, t(38) = -0.92, p = 0.36). The simplified model revealed that Morphine-withdrawn pups traveled a greater distance during USV recordings compared to saline-treated pups (β = 1.24, SE = 0.40, t(40) = 3.12, **p = 0.0033). (c) P7 Average Velocity: There was no effect of Sex (β = 0.0022, SE = 0.0040, t(38) = 0.59, p = 0.56) or a Morphine Treatment x Sex interaction (β = -0.0020, SE = 0.0055, t(38) = -0.37, p = 0.72). The simplified model revealed that Morphine Treatment had no effect on USV velocity (β = -0.0031, SE = 0.0027, t(40) = -1.17, p = 0.25). SAL, n = 21 (9F, 12M); MOR, n = 21 (11F, 10M). (d) P14 Distance: There was no Morphine Treatment x Time interaction (β = 0.0029, SE = 0.012, t(518) = 0.24, p = 0.81), so data was collapsed across the 15 min recording session. There was no effect of Sex (β = -0.93, SE = 3.84, t(33) = -2.42, p = 0.81) or a Morphine Treatment x Sex interaction (β = -0.26, SE = 5.83, t(33) = -0.045, p = 0.96). The simplified model revealed that Morphine Treatment had no effect on the total distance traveled (β = 5.20, SE = 2.81, t(35) = 1.85, p = 0.073). (e) P14 Average Velocity: There was no effect of Sex (β = 0.019, SE = 0.016, t(33) = 1.20, p = 0.24) or a Morphine Treatment x Sex interaction (β =-0.020, SE = 0.024, t(33) = -0.82, p = 0.42). The simplified model revealed that Morphine Treatment had no effect on USV velocity (β = 0.00020, SE = 0.012, t(35) = 0.017, p = 0.99). SAL, n = 21 (9F, 12M); MOR, n = 13 (7F, 9M)
Fig. 3
Fig. 3
USV profiles of FVB/NJ pups during spontaneous morphine withdrawal on P14. Data are plotted as the mean ± SEM. Saline = blue lines/bars; Morphine = orange lines/bars. Closed circles = Females; Open circles = males. (a) P14 USV Emissions: There was a Morphine Treatment x Sex x Time interaction (β = -3.60, SE = 1.03, t(518) = -3.49, ***p = 0.0052), where morphine females vocalized more than saline females over time, specifically during the 4 – 15 min intervals (all *padj ≤ 0.035) . (b) P14 Total USV Emissions: The effect of Morphine Treatment on USV emission was dependent on Sex (β = 919.6, SE = 180.7, t(33) = 5.088, ****p < 0.0001). Specifically, morphine-withdrawn females vocalized more than saline females (β = 937.0, SE = 181, t(33) = 5.19, ****p < 0.0001). (c) P14 Syllable Profile: Morphine Treatment was associated with an increase in the percentage of Complex 3 syllables emitted (β = 0.14, SE = 0.033, t(35) = 4.19, ***p = 0.00018), and a decrease in the percentage of Flat (β = -0.051, SE = 0.017, t(35) = -3.0, **p = 0.0051), and Short (β = -0.030, SE = 0.014, t(35) = -2.08, *p = 0.045) syllables emitted compared to saline controls. There were Morphine Treatment x Sex interactions for Complex 3 (β = 0.15, SE = 0.060, t(33) = 2.54, *p = 0.016) and Upward (β = 0.14, SE = 0.044, t(33) = 3.13, **p = 0.0036) syllables, so we investigated the syllable profile for each sex separately. (d) Female P14 Syllable Profile: Morphine Treatment was associated with an increase in the percentage of Complex 3 syllables (β = 0.21, SE = 0.046, t(15) = 4.8, ***p = 0.00030) and a decrease in Flat (β = -0.051, SE = 0.020, t(15) = -2.55, *p = 0.022), Short (β = -0.055, SE = 0.020, t(15) = -2.69, *p = 0.017), and Upward syllables (β = -0.097, SE = 0.031, t(15) = -3.13, **p = 0.0069). (e) Male P14 Syllable Profile: Morphine Treatment was associated with an increase in the percentage of Complex syllables (β = 0.017, SE = 0.0072, t(18) = 2.41, *p = 0.027). SAL, n = 20 (8F, 12M); MOR, n = 17 (9F, 8M)
Fig. 4
Fig. 4
Differentially expressed genes in the brainstem and midbrain during spontaneous morphine withdrawal on P16. (a) Brainstem RNAseq: Data reflects the effect of morphine exposure on gene expression relative to saline pups (sex-collapsed; Saline, n = 4 (2F, 2M); Morphine, n = 4 (2F, 2M). Log2 Fold Change (FC) represents gene expression, and Log10 p values (unadjusted) reflect significance. To avoid crowding, we labeled genes with an absolute (abs) log2FC ≥ 1.5 and/or Log10P ≥ 4.0. Dots are individual genes. Grey = absolute (abs) log2FC ≥ 0.26; non-significant (unadjusted p < 0.05; NS). Green = abslog2FC ≥ 0.26, non-significant; Orange = abslog2FC ≤ 0.26, significant (unadjusted p < 0.05); Pink = abslog2FC ≥ 0.26, significant (unadjusted p < 0.05). RT-qPCR: Data are plotted as the mean ± SEM. Saline = blue bars; Morphine = orange bars. Closed circles = Females (SAL, n = 3–4; MOR, n = 3–4); Open circles = males (SAL, n = 6–8; MOR, n = 5–7). (b) Brainstem Oprk1: Morphine Treatment was associated with upregulation of Oprk1 (t(17) = 2.06, *p = 0.0028). (c) Brainstem Pdyn: There was no effect of Morphine Treatment on Pdyn expression (t(17) = 1.35, p = 0.097). (d) Brainstem Slc6a3: Morphine Treatment was associated with upregulation of Sl6a3 (t(16) = 2.00, *p = 0.031). SAL, n = 10 (3F, 6 – 7M); MOR, n = 9 (4F, 5M). (e) Midbrain Oprk1: Morphine Treatment had no effect on Oprk1 expression (t(20) = 0.066, p = 0.47). (f) Midbrain Pdyn: Morphine Treatment was associated with upregulation of Pdyn (t(20) = 3.47, *p = 0.0012). (g) Midbrain Slc6a3: There was no effect of Morphine Treatment on Slc6a3 expression (t(20) = 0.37, p = 0.64)
Fig. 5
Fig. 5
Pathway enrichment analysis of differentially expressed genes in the brainstem during spontaneous morphine withdrawal on P16. Colors (pink, yellow, teal, green, blue) correspond to pathway names. The size of the circles reflects the number of genes in the pathway (the larger the circle, the more genes are associated with the pathway). The color of the circles reflects the significance (decreasing p value (more significant) from blue to red). (a) Upregulated Pathways: clustering of the top 20 enriched pathways consisting of upregulated genes in FVB/NJ mice. (b) Downregulated Pathways: Clustering of the top 20 enriched pathways consisting of downregulated genes in FVB/NJ mice. Clustering was determined by calculating Jaccard similarity coefficients between pathways, with the number of clusters set to 5
Fig. 6
Fig. 6
The kappa opioid receptor antagonist nor-BNI reduces USV emissions in FVB/NJ female pups during spontaneous withdrawal on P15. Data are plotted as the mean ± SEM. Saline animals pre-treated with saline = blue lines/bars; Saline animals pre-treated with nor-BNI = yellow lines/bars; Morphine animals pre-treated with saline = orange lines/bars; Morphine animals pre-treated with nor-BNI = purple lines/bars. Closed circles = Females; Open circles = males. (a) P15 Total USV Emissions: There was a Morphine Treatment x nor-BNI Treatment x Sex interaction (β = -874.5, SE = 421.2, t(143) = -2.076, *p = 0.040), where Morphine-withdrawn females pre-treated with nor-BNI (MOR/norBNI) emitted fewer USVs compared to morphine-withdrawn females pre-treated with saline (MOR/SAL) (β = -272.35, SE = 127.11, t(143) = -2,143 *p = 0.034). (b) Female P15 USV Emissions: Given the three-way interaction, we analyzed females and males separately across time to simplify the linear mixed model. There was a time-dependent decrease in USVs in morphine-withdrawn females pre-treated with nor-BNI (MOR/norBNI) compared to morphine-withdrawn females pre-treated with saline (MOR/SAL) (β = -1.42, SE = 0.52, t(1148) = -2.72, **p = 0.0068), specifically during the 4–8 and 10 min intervals (all *padj ≤ 0.037). (c) P15 Syllable Profile: There was no effect of Sex on any Syllable emitted (all p ≥ 0.20), so Sex was removed from the models. Morphine pups pre-treated with nor-BNI emitted fewer Chevron syllables compared to morphine-withdrawn pups pre-treated with saline (β = -0.036, SE = 0.017, t(147) = -2.065 *p = 0.041). SAL/SAL, n = 40 (22F, 18M); SAL/norBNI, n = 33 (17F, 16M); MOR/SAL, n = 39 (21F, 18M); MOR/norBNI, n = 39 (22F, 17M)
Fig. 7
Fig. 7
The kappa-opioid receptor agonist U50,488h, increases USV emission in morphine-naïve FVB/NJ pups on P10 and P14. Data are plotted as the mean ± SEM. Saline = blue lines/bars; U50,488h = green lines/bars. Closed circles = Females; Open circles = males. (a)P10 USV Emission: The effect of U50,488h Treatment depended on Time (β = -5.89, SE = 0.52, t(812) = -11.42, ****p < 0.0001). U50,488h-treated pups vocalized more than saline pups during the 2–9min intervals (all *padj ≤ 0.020), and less than saline pups during the 14–15min intervals (both *padj ≤ 0.028). (b) P10 Total USV Emission: There was no effect of Sex (β = -167.71, SE = 205.43, t(54) = -1.34, p = 0.19) or a U50,488h Treatment x Sex interaction (β =-34.18, SE = 288.38, t(54) = -0.12, p = 0.91). The simplified model revealed that U50,488h Treatment was associated with increased USV emission compared to saline controls (β = 406.2, SE= 148.9, t(56) = 2.73, **p = 0.0085). (c) P10 Syllable Profile: There was no effect of Sex on the percentage of syllables emitted (all p ≥ 0.42) or a U50,488h Treatment x Sex interaction (all p ≥ 0.42). The simplified model revealed that U50,488h Treatment was associated with a decrease in the percentage of Downward syllables (β = -0.021, SE = 0.0070, t(56) = -3.04, **p = 0.0036) and Short syllables (β = -0.015, SE = 0.0072, t(56) = -2.11, *p = 0.039) compared to saline controls. (d) P14 USV Emission: The effect of U50,488h on USV emission depended on Time (β = -0.56, SE = 0.025, t(966) = -2.25, *p = 0.025), where U50,488h-treated pups vocalized more than saline pups during the 5–9min intervals (all **padj ≤ 0.0087). (e) P14 Total USV Emission: There was a U50,488h Treatment x Sex interaction (β = 202.10, SE = 97.93, t(65) = 2.06, *p = 0.043), where U50,488h Treatment was associated with increased USV emission in females compared to saline-treated females (β = 164.85, SE = 67.34, t(65) = 2.45, *p = 0.017). (f) P14 Syllable Profile: There was no effect of Sex on the percentage of syllables emitted (all p ≥ 0.12) or a U50,488h Treatment x Sex interaction (all p ≥ 0.15). The simplified model revealed that U50,488h Treatment was associated with a decrease in Complex 2 (β = -0.021, SE = 0.0082, t(67) = -2.57, *p = 0.012), Complex 3 (β = -0.078, SE = 0.018, t(67) = -4.43, ****p < 0.0001), and Complex 4 (β = -0.0080, SE = 0.0028, t(67) = -2.91, **p = 0.0049) syllables. SAL, n = 29–32 (18–19F, 11–13M); U50,488h, n = 31–37 (17–21F, 12–16M)

Update of

Similar articles

References

    1. Abdel-Latif ME, Pinner J, Clews S, Cooke F, Lui K, Oei J (2006) Effects of Breast Milk on the Severity and Outcome of Neonatal Abstinence Syndrome Among Infants of Drug-Dependent Mothers. Pediatrics 117(6):e1163–e1169. 10.1542/peds.2005-1561 - PubMed
    1. Alipio JB, Brockett AT, Fox ME, Tennyson SS, deBettencourt CA, El-Metwally D, Francis NA, Kanold PO, Lobo MK, Roesch MR, Keller A (2021) Enduring consequences of perinatal fentanyl exposure in mice. Addict Biol 26(2):e12895. 10.1111/adb.12895 - PMC - PubMed
    1. Barr GA, Wang S (1992) Tolerance and withdrawal to chronic morphine treatment in the week-old rat pup. Eur J Pharmacol 215(1):35–42. 10.1016/0014-2999(92)90605-4 - PubMed
    1. Barr GA, McPhie-Lalmansingh A, Perez J, Riley M (2011) Changing Mechanisms of Opiate Tolerance and Withdrawal during Early Development: Animal Models of the Human Experience. ILAR J 52(3):329–341. 10.1093/ilar.52.3.329 - PMC - PubMed
    1. Bartok RE, Craft RM (1997) Sex Differences in Opioid Antinociception. J Pharmacol Exp Ther 282(2):769–778 - PubMed

MeSH terms