. 2024 Sep 30;81(11):1199-1209.
doi: 10.1001/jamaneurol.2024.2952. Online ahead of print.

Brain Networks for Cortical Atrophy and Responsive Neurostimulation in Temporal Lobe Epilepsy

Affiliations

Brain Networks for Cortical Atrophy and Responsive Neurostimulation in Temporal Lobe Epilepsy

Sara Larivière et al. JAMA Neurol. .

Abstract

Importance: Drug-resistant temporal lobe epilepsy (TLE) has been associated with hippocampal pathology. Most surgical treatment strategies, including resection and responsive neurostimulation (RNS), focus on this disease epicenter; however, imaging alterations distant from the hippocampus, as well as emerging data from responsive neurostimulation trials, suggest conceptualizing TLE as a network disorder.

Objective: To assess whether brain networks connected to areas of atrophy in the hippocampus align with the topography of distant neuroimaging alterations and RNS response.

Design, setting, and participants: This retrospective case-control study was conducted between July 2009 and June 2022. Data collection for this multicenter, population-based study took place across 4 tertiary referral centers in Montréal, Canada; Querétaro, México; Nanjing, China; and Salt Lake City, Utah. Eligible patients were diagnosed with TLE according to International League Against Epilepsy criteria and received either neuroimaging or neuroimaging and RNS to the hippocampus. Patients with encephalitis, traumatic brain injury, or bilateral TLE were excluded.

Main outcomes and measures: Spatial alignment between brain network topographies.

Results: Of the 110 eligible patients, 94 individuals diagnosed with TLE were analyzed (51 [54%] female; mean [SD] age, 31.3 [10.9] years). Hippocampal thickness maps in TLE were compared to 120 healthy control individuals (66 [55%] female; mean [SD] age, 29.8 [9.5] years), and areas of atrophy were identified. Using an atlas of normative connectivity (n = 1000), 2 brain networks were identified that were functionally connected to areas of hippocampal atrophy. The first network was defined by positive correlations to temporolimbic, medial prefrontal, and parietal regions, whereas the second network by negative correlations to frontoparietal regions. White matter changes colocalized to the positive network (t93 = -3.82; P = 2.44 × 10⁻⁴). In contrast, cortical atrophy localized to the negative network (t93 = 3.54; P = 6.29 × 10⁻³). In an additional 38 patients (20 [53%] female; mean [SD] age, 35.8 [11.3] years) treated with RNS, connectivity between the stimulation site and atrophied regions within the negative network was associated with seizure reduction (t212 = -2.74; P = .007).

Conclusions and relevance: The findings in this study indicate that distributed pathology in TLE may occur in brain networks connected to the hippocampal epicenter. Connectivity to these same networks was associated with improvement following RNS. A network approach to TLE may reveal therapeutic targets outside the traditional target in the hippocampus.


Conflict of interest statement

Conflict of Interest Disclosures: Dr Fox reported intellectual property on the use of brain connectivity imaging to analyze lesions and guide brain stimulation; is a consultant for Magnus Medical, Soterix, Abbott, and Boston Scientific; and has received research funding from Neuronetics. No other disclosures were reported.

Figures

Figure 1.
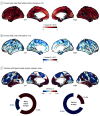
Figure 1.. Individualized Hippocampal Atrophy Network Mapping
A, Hippocampal surfaces were segmented in each participant using HippUnfold. Vertexwise measures of thickness were mapped onto the hippocampal segmentations. Surface-based linear models using hippocampal thickness from control individuals were used to generate a normative model; thickness from each individual patient was then compared against model estimates to generate a vertexwise W map (ie, a Z map controlling for age and sex). The top 15% most atrophied vertices (ie, the lowest w scores) were identified for each participant. B, The top subpanel shows example atrophy maps in 4 individuals with TLE. The bottom subpanel shows overlap with the percentage of patients with atrophy in the same hippocampal vertices. C, The top subpanel shows example atrophy network maps (ie, regions functionally correlated with areas of peak hippocampal atrophy) in the same 4 individuals. The bottom subpanel shows overlap with the percentage of patients with hippocampal atrophy functionally correlated with the same cortical regions. HC indicates healthy control individuals; MRI, magnetic resonance imaging; T1w, T1-weighted; TLE, temporal lobe epilepsy
Figure 2.
Figure 2.. Microstructural and Morphological Dissociation
A, Compared to control individuals, individuals with temporal lobe epilepsy (TLE) showed superficial white matter perturbations (overall multivariate fractional anisotropy and mean diffusivity changes) that followed a specific temporolimbic pattern. To be consistent with the individual-level analyses (Figures 3 and 4), data from the right-sided TLE were not flipped. B, Patterns of cortical atrophy in individuals with TLE, relative to control individuals, affected mainly frontocentral regions. C, Patterns of significant white matter alterations and cortical atrophy are overlaid onto the hippocampal atrophy networks from Figure 1C. White matter alterations colocalized with areas of positive connectivity (overlap with red network = 72.0%; permutation P = .09), whereas cortical atrophy preferentially overlapped with regions that were negatively correlated with areas of hippocampal atrophy (overlap with blue network = 67.9%; permutation P = .02). Significant regions (superficial white matter: random field theory P < .001, atrophy: random field theory P < .001) are highlighted in white.
Figure 3.
Figure 3.. Patient-Tailored Associations
A, The top subpanel shows example superficial white matter alterations (sampled approximately 3 mm beneath the gray/white matter junction) maps in 4 individuals with temporal lobe epilepsy (TLE). The bottom subpanel shows overlap with the percentage of patients with superficial white matter alterations in the same vertices. B, The top subpanel shows example cortical atrophy maps in 4 individuals with TLE. The bottom subpanel shows overlap with the percentage of patients with cortical atrophy in the same vertices. C, Schematic showing overlap of superficial white matter alterations (top) and cortical atrophy (bottom) in 1 individual onto the hippocampal networks. D, Patient-specific percentages of altered white matter vertices (left) and atrophied cortical vertices (right) in each hippocampal network, controlling for network size, showing (left) greater superficial white matter alterations in the positive, relative to negative, network and (right) greater cortical atrophy in the negative, relative to positive, network.
Figure 4.
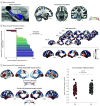
Figure 4.. Responsive Neurostimulation and Its Association With Hippocampal Atrophy Networks
A, Responsive neurostimulation (RNS) is a closed-loop system that provides electrical stimulation to the seizure-onset zone through either 2 intracranial depth or subdural strip leads, activated by the detection of patient-specific epileptiform activity (left subpanel). The right subpanel presents an overlap map showing the centroid locations of the active mesial temporal lobe depth contacts (n = 38 patients, n = 260 contacts or 4 contacts on each of 65 leads). B, The left subpanel shows seizure frequency improvement scores after mesial temporal RNS. The right subpanel shows example RNS connectivity maps (ie, regions functionally correlated with the mesial temporal neurostimulation sites) in 4 individuals. The overlap showing percentage of patients with RNS sites functionally correlated with the same cortical regions. C, The left subpanel presents the RNS response network showing vertexwise correlations between seizure frequency improvement scores and RNS connectivity, with significant regions (permutation P < .05) highlighted in white. These significant regions are overlaid onto the hippocampal atrophy networks from Figure 1C and colocalized with areas of negative connectivity (overlap with blue network = 99.2%; permutation P = .04). Individuals with TLE demonstrated significantly more gray matter atrophy relative to control individuals in the significant RNS response network clusters (right subpanel). HC indicates healthy control individuals; TLE, temporal lobe epilepsy; VTA, volume of tissue activated.

References

    1. Blümcke I, Thom M, Aronica E, et al. International consensus classification of hippocampal sclerosis in temporal lobe epilepsy: a Task Force report from the ILAE Commission on Diagnostic Methods. Epilepsia. 2013;54(7):1315-1329. doi: 10.1111/epi.12220 - DOI - PubMed
    1. Bernhardt BC, Bernasconi A, Liu M, et al. The spectrum of structural and functional imaging abnormalities in temporal lobe epilepsy. Ann Neurol. 2016;80(1):142-153. doi: 10.1002/ana.24691 - DOI - PubMed
    1. Whelan CD, Altmann A, Botía JA, et al. Structural brain abnormalities in the common epilepsies assessed in a worldwide ENIGMA study. Brain. 2018;141(2):391-408. doi: 10.1093/brain/awx341 - DOI - PMC - PubMed
    1. Hatton SN, Huynh KH, Bonilha L, et al. White matter abnormalities across different epilepsy syndromes in adults: an ENIGMA-Epilepsy study. Brain. 2020;143(8):2454-2473. doi: 10.1093/brain/awaa200 - DOI - PMC - PubMed
    1. Bernhardt BC, Bernasconi N, Concha L, Bernasconi A. Cortical thickness analysis in temporal lobe epilepsy: reproducibility and relation to outcome. Neurology. 2010;74(22):1776-1784. doi: 10.1212/WNL.0b013e3181e0f80a - DOI - PubMed