. 2024 Nov;11(44):e2403918.
doi: 10.1002/advs.202403918. Epub 2024 Sep 30.

Selenium Attenuates Radiation Colitis by Regulating cGAS-STING Signaling

Affiliations

Selenium Attenuates Radiation Colitis by Regulating cGAS-STING Signaling

Qian Xue et al. Adv Sci (Weinh). 2024 Nov.

Abstract

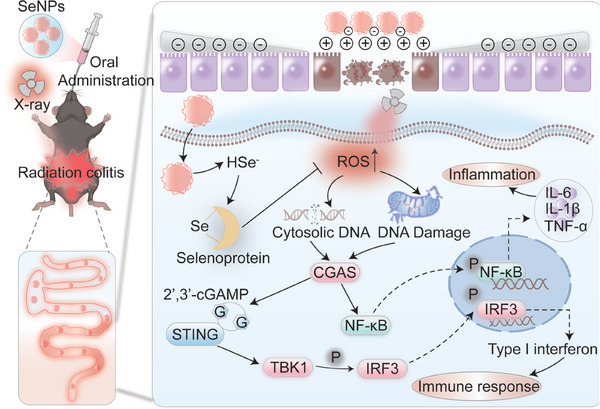
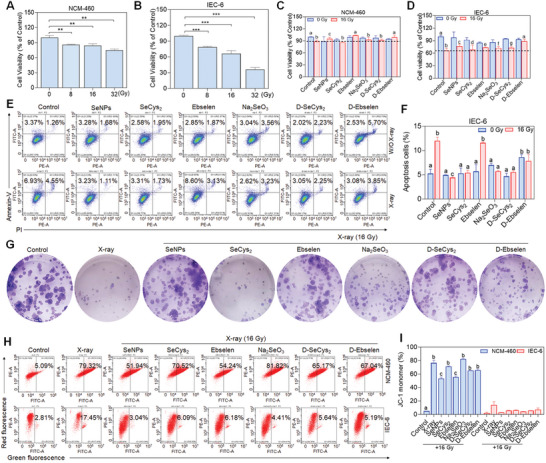
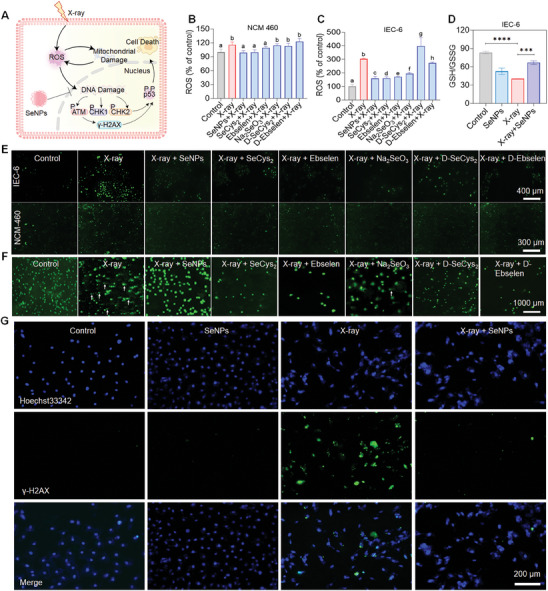
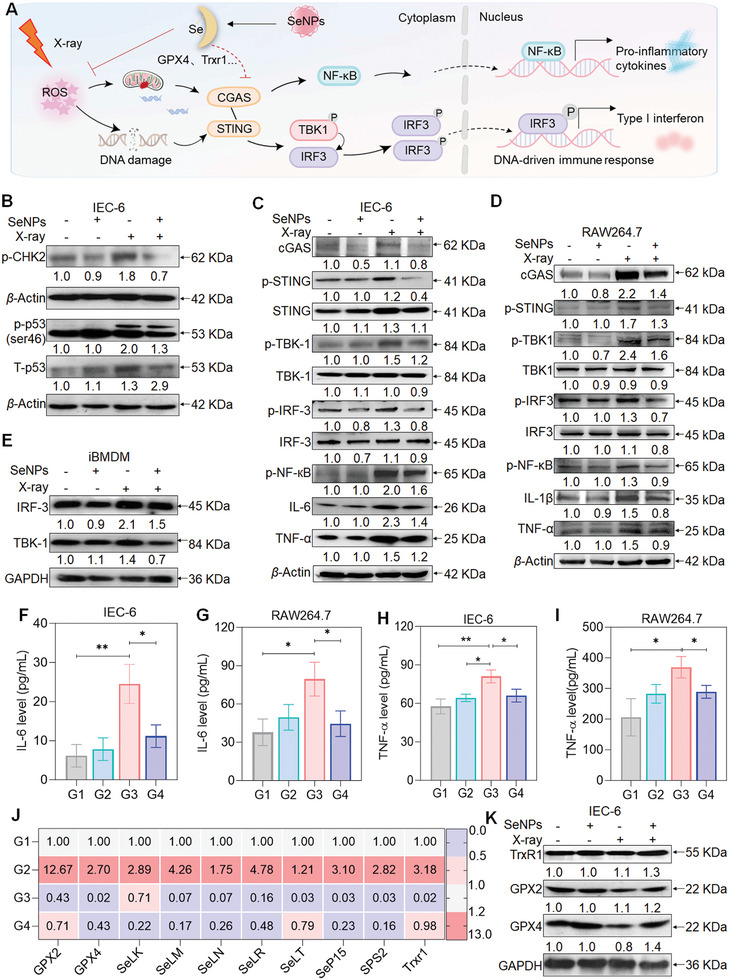
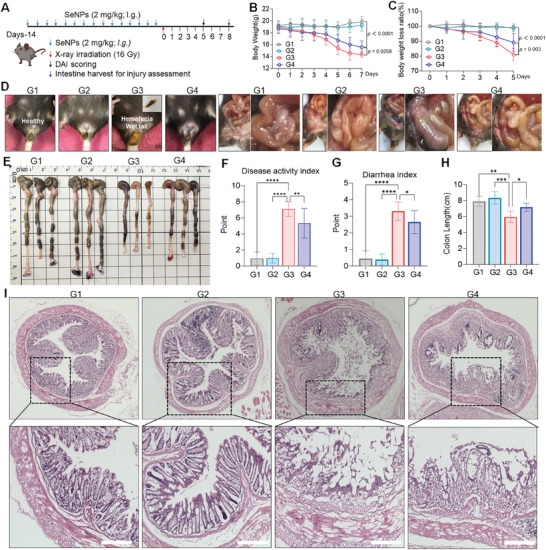
Radiation colitis is one of the most common complications in patients undergoing pelvic radiotherapy and there is no effective treatment in the clinic. Therefore, searching for effective agents for the treatment of radiation colitis is urgently needed. Herein, it is found that the essential element selenium (Se) is protective against radiation colitis through inhibiting X-ray-induced apoptosis, cell cycle arrest, and inflammation with the involvement of balancing the generation of reactive oxygen species after the irradiation. Mechanistically, Se, especially for selenium nanoparticles (SeNPs), induced selenoprotein expression and then functioned to effectively restrain DNA damage response, which reduced X-ray-induced intestinal injury. Additionally, SeNPs treatment also restrained the cyclic GMP-AMP synthas (cGAS)- stimulator of interferon genes (STING)-TBK1-IRF3 signaling pathway cascade, thereby blocking the transcription of inflammatory cytokine gene, IL-6 and TNF-α, and thus alleviating inflammation. Moreover, inducing selenoprotein expression, such as GPX4, with SeNPs in vivo can regulate intestinal microenvironment immunity and gut microbiota to attenuate radiation-induced colitis by inhibiting oxidative stress and maintaining microenvironment immunity homeostasis. Together, these results unravel a previously unidentified modulation role that SeNPs restrained radiation colitis with the involvement of inducing selenoprotein expression but suppressing cGAS-STING-TBK1-IRF3 cascade.

Keywords: DNA damage; ROS; cGAS‐STING; radiation colitis; selenium.


Conflict of interest statement

The authors declare no conflict of interest.

Figures

Scheme 1
Scheme 1
Schematic illustration of Se in antagonizing X‐ray‐induced colitis.
Figure 1
Figure 1
Protective effect of selenium compounds on IEC‐6 cells and NCM‐460 cells against X‐rays. A,B) The survival rate of NCM‐460 and IEC‐6 cells after 48 h of X‐ray irradiation (0, 8, 16 and 32 Gy). Effects of X‐ray (16 Gy) and Se (2 µM) on the cell viability of NCM‐460 cells C) and IEC‐6 cells D). Cells were primed with Se for 6 h followed by X‐ray irradiation. After 48 h, cell viability was scrutinized by MTT assay (Data are represented as mean ± SD, n = 3). E‐F) Effects of Se and X‐ray irradiation on the cell apoptosis on IEC‐6 cells. Data are represented as mean ± SD, n = 2. Bars with characters a, b, and c are denoted as significant differences between the treatment and control groups. G) The colony formation of IEC‐6 cells after the therapy for Se (2 µM) and X‐ray (16 Gy). H‐I) Consequences of Se (2 µM) and X‐ray (16 Gy) on the mitochondria membrane potential of NCM‐460 and IEC‐6 cells. Cells were pre‐exposed to Se for 6 h and then irradiated by X‐ray. After 48 h, cells were assembled and stained with a JC‐1 probe and then analyzed by Flow cytometry assay. Data are represented as mean ± SD, n = 2. **P < 0.01 and **P < 0.001 levels are considered as significant differences in comparison with the untreated control group. Bars with characters a, b and c are denoted as significant differences between the treatment and control groups.
Figure 2
Figure 2
Protective effects of selenium drugs against X‐ray‐induced mitochondrial dysfunction in NCM‐460 and IEC‐6 cells. A) Schematic illustration of SeNPs scavenging ROS in normal small intestinal epithelial cells induced by radiotherapy. Detection of ROS in NCM‐460 B) and IEC‐6 C) cells pretreated for 6 h with different selenium drugs (SeNPs, SeCys2, Ebselen, Na2SeO3, D‐SeCys2, and D‐Ebselen) under X‐ray irradiation (16 Gy). Each value represents the mean ± SD of three replicates. Letters a, b, c, d, e, f, g, and h are considered statistically significant at P < 0.05. ***P < 0.001 is considered as significant difference between the comparing groups. D) Changes in glutathione expression levels in IEC‐6 cells pretreated with SeNPs after irradiation. E) DCF fluorescence images (green) of NCM‐460 and IEC‐6 cells pretreated for 6 h with different selenium drugs under X‐ray irradiation (16 Gy). F) Representative fluorescence images of DNA double‐strand damage repair in IEC‐6 cells pretreated with nano selenium and irradiated (16 Gy). Scale bar = 1000 µm. The arrow indicates the DNA tails in the comet assay. G) Immunofluorescence analysis of phosphorylated γ‐H2AX, with Hoechst 33342 marked as nuclei (blue) and phosphorylated γ‐H2AX marked in green. Scale bar = 200 µm.
Figure 3
Figure 3
SeNPs suppressed cGAS‐STING signaling pathway activation by inducing selenoprotein expression. A) Schematic diagram of the regulatory mechanism of SeNPs inhibited cGAS‐STING signal cascade under DNA damage response. B) SeNPs inhibited X‐ray‐induced DNA damage in IEC‐6 cells. Effects of SeNPs on cGAS‐STING signaling pathway in IEC‐6 cells C), RAW264.7 cells D) and BMDMs E) upon X‐ray irradiation. Cells were pretreated with SeNPs (2 µM) for 6 h followed by X‐ray (16 Gy) irradiation and 48 h later the total protein was collected and subjected for the analysis of protein expression. F‐I) Expression of TNF‐α and IL‐6 in IEC‐6 and RAW264.7 cells was examined by ELISA assay. Data are represented as mean ± SD, n = 3. J) The mRNA level of selenoprotein in IEC‐6 cells after the treatment of SeNPs (2 µM) and X‐ray (16 Gy) (n = 3). K) Expression of GXP2, GPX4, and TrxR1 in IEC‐6 cells. Cells were pretreated with SeNPs (2 µM) for 6 h and then irradiated by X‐ray (16 Gy). After 48 h, the total protein was collected and submitted to a Western blotting assay. G1: Control, G2: SeNPs, G3: X‐ray, G4: X‐ray + SeNPs. *P < 0.05 and **P < 0.01 are considered statistically significant differences.
Figure 4
Figure 4
The protective effects of SeNPs against X‐ray radiation therapy on the intestine in vivo. A) Schematic diagram of in vivo radiation protection assessment. B‐C) Changes and loss in mouse body weight (n = 10). D) Representative images of the wet tail and hematochezia on day 5 and intestinal integrity structure on day 8 for each group. E) Representative images of colon length after the treatments. F) DAI for radiation‐induced colitis in each group. G) Diarrhea index (n = 10). H) Quantification of colon length in different treatment groups (n = 3). I) H&E staining images of colon tissues from different treatment groups (scale bar = 400 µm). G1: Control, G2: SeNPs, G3: X‐ray, G4: X‐ray + SeNPs. Each value is represented as mean ± SD. *P < 0.05, **P < 0.01, ***P < 0.001, and ****P < 0.0001 are denoted as significant differences between the comparing groups.
Figure 5
Figure 5
SeNPs inhibit X‐ray‐induced disruption of the intestinal immune microenvironment. Changes of neutrophils A) and M2 macrophages B) in the spleen, colon, and lymph node after the treatment of SeNPs and X‐ray. Mice were pretreated with 2 mg kg−1 SeNPs for two weeks and then received with or without X‐ray irradiation (16 Gy). After 10 days, mice were euthanized and the spleen, colon, and lymph nodes were assembled for the analysis of neutrophils and M2 macrophages using a flow cytometry assay. Quantitative analysis of neutrophils C‐E) and anti‐inflammatory M2 polarized macrophages F‐H) in the spleen, colon tissues, and lymph nodes of mice from different treatment groups. G1: Control, G2: SeNPs, G3: X‐ray, G4: X‐ray + SeNPs. Each value is represented as mean ± SD (the sample size was 5, 4, and 3 in spleen, colon tissues and lymph nodes, respectively). *P < 0.05 and **P < 0.01 are denoted as significant differences between the comparing groups.
Figure 6
Figure 6
SeNPs inhibited X‐ray‐induced intestine injury and inflammation with the involvement of inactivating cGAS‐STING pathway in vivo. A) Representative images of MPO in different treatment groups (scale bar = 300 µm). B) Semi‐quantitative analysis of MPO in the colon tissues (n = 3). C) Levels of MDA in the colon tissues after different treatments (n = 5). D–G) Levels of IL‐10, TNF‐α, IL‐6, and IFN‐γ in the supernatant of mesenteric lymph node tissues in each group (n = 3). H‐L) Gene manifestation of STING, IL‐6, IL‐1β, and GPX4 in the colon tissues after different treatments (scale bar = 300 µm) (n = 3). M) The mRNA expression of cGAS, STING, TBK1, TNF‐α, IL‐6, and GPX4 in the colon tissues after different treatments (n = 3). G1: Control, G2: SeNPs, G3: X‐ray, G4: X‐ray + SeNPs. Each value represents as mean ± SD of three replicates. *P < 0.05, **P < 0.01, and ***P < 0.001 are denoted as significant differences between the comparing groups.
Figure 7
Figure 7
Effects of SeNPs and X‐ray on the gut microbiota abundances. A) The Bray Curtis PCoA combined with PERMANOVA analysis showed significant differences in the composition of gut bacterial communities between the irradiation group and the control group (n = 3, pseudo‐F: 4.07, PERMANOVAR). B) Significant inter‐group difference analysis of OUT levels in fecal samples from the Control, SeNPs, X‐ray, and SeNPs+X‐ray (one‐way ANOVA). C) Heat map of relative abundance of intestinal flora. D) The distribution of microbial species present in different microbial samples under different treatment groups. E) The Venn diagram illustrating the intestinal microbiota across various groups, wherein the numerical values shared between different circles denote the quantity of identical bacterial species. F) LDA identified a significant abundance of genera in different taxa. Groups that meet the LDA significance threshold of 2. The Venn diagram comparing intestinal flora among distinct groups depicts the quantity of shared bacterial species indicated by the values intersecting different circles. G) Distribution of KO assignments to analyze the individual gene in different samples by PICRUSt2 function. G1: Control, G2: SeNPs, G3: X‐ray, G4: X‐ray + SeNPs.

References

    1. a) Al‐Sarraf M., LeBlanc M., Giri P., Fu K. K., Cooper J., Vuong T., Forastiere A. A., Adams G., Sakr W. A., Schuller D. E., J. Clin. Oncol. 2023, 41, 3965; - PubMed
    2. b) Mariados N. F., Orio P. F., Schiffman Z., Van T. J., Engelman A., Nurani R., Kurtzman S. M., Lopez E., Chao M., Boike T. P., JAMA Oncol. 2023, 9, 511; - PMC - PubMed
    3. c) Zhang H., Zhang Z., Yuan S., Precis. Radiat. Oncol. 2023, 7, 237.
    1. a) Wedlake L. J., Proc. Nutr. Soc. 2018, 77, 357; - PubMed
    2. b) Liu S., Jin J., Precis. Radiat. Oncol. 2022, 6, 4.
    1. a) Wang K., Tepper J. E., CA Cancer J. Clin. 2021, 71, 437; - PubMed
    2. b) Gould Rothberg B. E., Quest T. E., Yeung S. C. J., Pelosof L. C., Gerber D. E., Seltzer J. A., Bischof J. J., Thomas Jr C. R., Akhter N., Mamtani M., CA Cancer J. Clin. 2022, 72, 570. - PubMed
    1. Cleveland N. K., Torres J., Rubin D. T., Gastroenterology 2022, 162, 1396. - PubMed
    1. a) Feng Y., Luo X., Li Z., Fan X., Wang Y., He R.‐R., Liu M., Nat. Commun. 2023, 14, 5083; - PMC - PubMed
    2. b) Shen W., Pei P., Zhang C., Li J., Han X., Liu T., Shi X., Su Z., Han G., Hu L., ACS Nano 2023, 17, 23998. - PubMed

LinkOut - more resources