

Association between triglyceride glucose-body mass index and the staging of non-alcoholic steatohepatitis and fibrosis in patients with non-alcoholic fatty liver disease
- PMID: 39348274
- PMCID: PMC11443541
- DOI: 10.1080/07853890.2024.2409342
Association between triglyceride glucose-body mass index and the staging of non-alcoholic steatohepatitis and fibrosis in patients with non-alcoholic fatty liver disease
Abstract
Objective: The objective of this study was to thoroughly investigate the clinical value of triglyceride glucose-body mass index (TyG-BMI) in patients diagnosed with non-alcoholic fatty liver disease (NAFLD). Specifically, we aimed to determine its association with non-alcoholic steatohepatitis (NASH) and the progression of liver fibrosis.
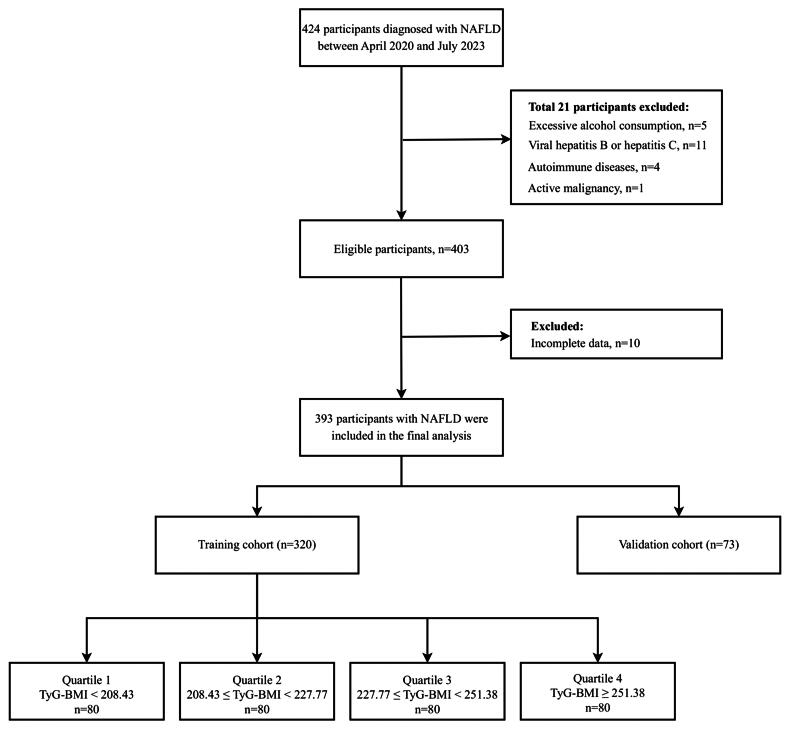
Methods: The study included 393 patients diagnosed with NAFLD after liver biopsy. The patients were divided into two distinct cohorts: a training cohort (N = 320) and a validation cohort (N = 73). The training cohort was further divided into four groups based on TyG-BMI quartiles. The clinical characteristics of the patients in each group were compared in detail, and the association between TyG-BMI and NASH, NAFLD Activity Score (NAS) ≥ 4, at-risk NASH, significant fibrosis, advanced fibrosis, and cirrhosis was analyzed using multiple models. Additionally, we generated receiver operating characteristic (ROC) curves to evaluate the predictive ability of TyG-BMI for NASH and fibrosis staging in patients with NAFLD.
Results: Patients with higher TyG-BMI values had a significantly higher prevalence of NASH, NAS ≥ 4, at-risk NASH, significant fibrosis, advanced fibrosis, and cirrhosis (all p < .05). TyG-BMI was an independent predictor of these diseases in both unadjusted and adjusted models (all p < .05). ROC curve analysis further revealed the excellent performance of TyG-BMI in predicting NASH, NAS ≥ 4, at-risk NASH, significant fibrosis, advanced fibrosis, and cirrhosis. The validation cohort yielded analogous results. Furthermore, we constructed three multivariate models of TyG-BMI in conjunction with elastography metrics, which demonstrated elevated diagnostic AUC values of 0.782, 0.792, 0.794, 0.785, 0.834, and 0.845, respectively.
Conclusion: This study confirms a significant association between insulin resistance and NAFLD, including at-risk NASH and fibrosis staging, as assessed using the TyG-BMI index. TyG-BMI and its associated multivariate models can be valuable noninvasive indicators for NAFLD diagnosis, risk stratification, and disease course monitoring.
Keywords: Triglyceride glucose-body mass index; liver fibrosis; non-alcoholic fatty liver disease; non-alcoholic steatohepatitis; receiver operating characteristic curve.
Conflict of interest statement
No potential conflict of interest was reported by the author(s).
Figures


References
MeSH terms
Substances
LinkOut - more resources
Full Text Sources
Medical