. 2024 Sep 30;20(9):e1012593.
doi: 10.1371/journal.ppat.1012593. eCollection 2024 Sep.

ATM1, an essential conserved transporter in Apicomplexa, bridges mitochondrial and cytosolic [Fe-S] biogenesis

Affiliations

ATM1, an essential conserved transporter in Apicomplexa, bridges mitochondrial and cytosolic [Fe-S] biogenesis

Deepti Shrivastava et al. PLoS Pathog. .

Abstract

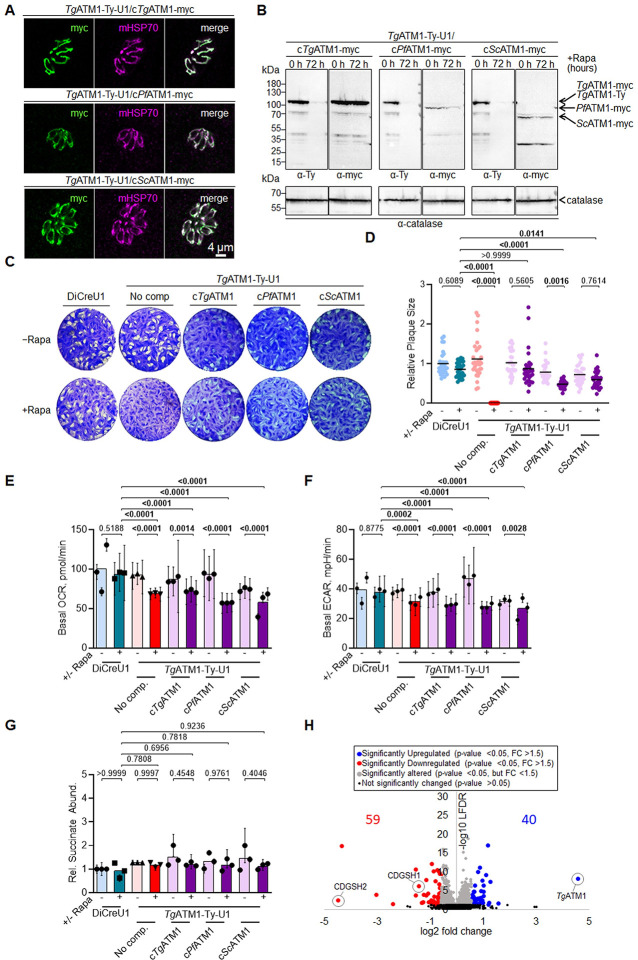
The Apicomplexa phylum encompasses numerous obligate intracellular parasites, some associated with severe implications for human health, including Plasmodium, Cryptosporidium, and Toxoplasma gondii. The iron-sulfur cluster [Fe-S] biogenesis ISC pathway, localized within the mitochondrion or mitosome of these parasites, is vital for parasite survival and development. Previous work on T. gondii and Plasmodium falciparum provided insights into the mechanisms of [Fe-S] biogenesis within this phylum, while the transporter linking mitochondria-generated [Fe-S] with the cytosolic [Fe-S] assembly (CIA) pathway remained elusive. This critical step is catalyzed by a well-conserved ABC transporter, termed ATM1 in yeast, ATM3 in plants and ABCB7 in mammals. Here, we identify and characterize this transporter in two clinically relevant Apicomplexa. We demonstrate that depletion of TgATM1 does not specifically impair mitochondrial metabolism. Instead, proteomic analyses reveal that TgATM1 expression levels inversely correlate with the abundance of proteins that participate in the transfer of [Fe-S] to cytosolic proteins at the outer mitochondrial membrane. Further insights into the role of TgATM1 are gained through functional complementation with the well-characterized yeast homolog. Biochemical characterization of PfATM1 confirms its role as a functional ABC transporter, modulated by oxidized glutathione (GSSG) and [4Fe-4S].


Conflict of interest statement

The authors have declared that no competing interests exist.

Figures

Fig 1
Fig 1. Phylogeny and localization of PfATM1 and TgATM1.
(A) Domain organization and N-terminal extensions (NTE) in ATM1 homologs from apicomplexan parasites (P. falciparum, T. gondii, C. parvum), Saccharomyces cerevisiae, A. thaliana, Homo sapiens and the bacterium N. aromaticivorans. (B) Phylogeny of ATM1 homologs generated by PhyML 3.0. The tree was rooted at the EcHlyB branch. Bootstrap values of 1000 replicates are indicated at each branch. (C) Western blot of a TgATM1-Ty-U1 parasite lysate probed with anti-Ty antibody. (D) Immunofluorescence assay of parental (DiCreU1) and TgATM1-Ty-U1 parasites stained with anti-Ty antibody and a mitochondrial marker (mitochondrial heat shock protein, mHSP70). The degree of colocalization is given. Images shown in C and D are representative of three independent biological replicates. (E) Western blot of P. falciparum lysate probed with anti-PfATM1 serum recognizes a specific band at the expected size of unprocessed PfATM1 (123 kDa) and a closely migrating lower band likely representing processed protein. (F) Immunofluorescence assay for subcellular localization of PfATM1 at different intra-erythrocytic stages. Scale (0–3 μm) is shown in the merged image. DAPI is the nuclear stain, Mitotracker Red is the mitochondrial marker dye, anti-PfATM1 antibodies and anti-PfHU serum detect PfATM1 and the apicoplast marker PfHU, respectively. Colocalization rate is given for overlay of PfATM1 and Mitotracker Red signals.
Fig 2
Fig 2. TgATM1 and PfATM1 are essential for parasite growth.
(A) Immunofluorescence assays of TgATM1-Ty-U1 parasites stained with anti-Ty antibody and a mitochondrial marker (mitochondrial heat shock protein, mHSP70) following 0 or 48 hours of rapamycin (Rapa) treatment. (B) Western blot of parental (DiCreU1) and TgATM1-Ty-U1 parasite lysates following varying durations of Rapa treatment. The membrane was probed with anti-Ty antibody and anti-catalase antibody as loading control. Two major bands were observed for TgATM1-Ty, labelled TgATM1-Ty1 and TgATM1-Ty2. (C) Stained host cell monolayers revealing plaques formed by parental (DiCreU1) or TgATM1-Ty-U1 parasites over seven days in presence or absence of Rapa. A-C: Representative images are shown from one of 3 independent biological replicates. (D) Intracellular growth assay displaying the proportion of vacuoles containing 2, 4, 8, 16 and 32 parasites after 24 hours of intracellular growth and varying durations of Rapa treatment for parental (DiCreU1) and TgATM1-Ty-U1 parasites. The means and standard deviations from three independent biological replicates are shown. A two-sided Student’s t-test was used to compare the average number of parasites between the indicated conditions. Significant differences (p <0.05) are highlighted in bold.
Fig 3
Fig 3. Downregulation of ATM1 affects iron-sulfur cluster proteins in Toxoplasma and iron levels in Plasmodium.
(A) Immunofluorescence assays of DiCreU1 (parental control) and TgATM1-Ty-U1 parasites following 0 and 72 hours of rapamycin (Rapa) treatment. Parasites were visualized using anti-actin (Act) antibodies, while mitochondria were stained using antibodies against the mitochondrial heat shock protein (mHSP70). (B) and (C) Basal oxygen consumption rate (OCR) (B) and extracellular acidification rate (ECAR) (C) following 0 or 72 hours of Rapa treatment in parental (DiCreU1) and TgATM1-Ty-U1 parasites, as determined using an extracellular flux analyser. (D) Relative abundance of the tricarboxylic acid (TCA) cycle intermediate succinate as determined by gas chromatography-mass spectrometry (GC-MS) of parental (DiCreU1) and TgATM1-Ty-U1 parasite extracts following 0 or 72 hours of Rapa treatment. B-D) The means and standard deviation of three independent biological experiments are shown. Bars represent the means of the three experiments. Conditions were compared using a One-way ANOVA followed by Tukey multiple pair wise comparisons. Significant differences (p <0.05) are highlighted in bold. (E)-(F) Volcano plot highlighting changes in protein levels of TgATM1-Ty-U1 parasites after 72 hours of rapamycin treatment compared to parental parasites (DiCreU1) treated equally with Rapa (E) or TgATM1-Ty-U1 parasites not treated with Rapa (F). Unchanged proteins are displayed in black, while significantly altered proteins are displayed in grey (< 1.5-fold change (FC), local false discovery rate, LFDR < 0.05) or in blue (>1.5-fold increased; LFDR < 0.05) or red (> 1.5-fold decreased; LFDR < 0.05). The number of significantly increased and decreased proteins is given and the NEET protein CDGSH1 is indicated. (G) Table listing proteins that are significantly up- or downregulated in both comparisons shown in E and F. [Fe-S] proteins are highlighted in red. Gene accession numbers (identifiers, IDs), the fitness score from a genome-wide CRISPR screen, the putative localization from a spatial proteomics study (localization of organelle proteins by isotope tagging, LOPIT), the number of transmembrane domains (TMDs), as well as the LFDR and FC for both comparisons shown in E and F are given.
Fig 4
Fig 4. TgATM1-depleted Toxoplasma are functionally complemented through expression of the Plasmodium or yeast homolog.
(A) Immunofluorescence assays of TgATM1-Ty-U1 parasites expressing a second copy of myc-tagged Toxoplasma- (TgATM1-Ty-U1/cTgATM1-myc), Plasmodium- (TgATM1-Ty-U1/cPfATM1-myc) or yeast ATM1 (TgATM1-Ty-U1/cScATM1-myc). IFAs were stained with anti-myc antibody, as well as antibodies against a mitochondrial marker, mitochondrial heat shock protein (mHSP70). (B) Western blots of protein lysates from parasites as listed in (A) following 0 or 72 hours of downregulation of endogenous TgATM1 through addition of rapamycin (Rapa). Membranes were probed with anti-Ty and anti-myc antibodies as well as anti-catalase antibodies as loading control. The ATM1 proteins detected at varying molecular weights are indicated. The panel shows blots that were performed on the same membrane and exposed for identical durations. (C) Stained host cell monolayers revealing plaques formed by parental (DiCreU1), uncomplemented TgATM1-Ty-U1 parasites or TgATM1-Ty-U1 parasites expressing a second copy of TgATM1 as listed in (A) over seven days in presence or absence of Rapa. A-C: Representative images are shown from one of three independent biological replicates. (D) Plaque sizes quantified from assays as shown in (C) from three independent experiments. Sizes of individual plaques are shown relative to the mean of the parental line DiCreU1 not treated with Rapa. Means are indicated through horizontal bars. Conditions were compared using a One-way ANOVA followed by Tukey multiple pair wise comparisons. Significant differences (p <0.05) are highlighted in bold. (E and F) Basal oxygen consumption rate (OCR) (E) and basal extracellular acidification rate (ECAR) (F), as determined using an extracellular flux analyser following 0 or 72 hours of Rapa treatment of parasite lines listed in (C). (G) Relative abundance of the TCA cycle intermediate succinate, as determined by gas chromatography-mass spectrometry (GC-MS) of parental (DiCreU1) and TgATM1-Ty-U1 parasite extracts following 0 or 72 hours of Rapa treatment of parasite lines listed in (C). (E-G) The means and standard deviation of three independent biological experiments are shown. Bars represent the means of the three experiments. Conditions were compared using a One-way ANOVA followed by Tukey multiple pair wise comparisons. Significant differences (p <0.05) are highlighted in bold. Note that values for DiCreU1 and TgATM1-Ty-U1 parasites are as in Fig 3 C-H and were re-plotted. (H) Volcano plot highlighting changes in protein levels of TgATM1 overexpressing parasites (TgATM1-Ty-U1/cTgATM1-myc) compared to TgATM1-Ty-U1 parasites, both not treated with Rapa. Unchanged proteins are displayed in black, while significantly altered proteins are displayed in grey (< 1.5-fold change (FC), local false discovery rate, LFDR < 0.05) or in blue (>1.5-fold increased; LFDR < 0.05) or red (> 1.5-fold decreased; LFDR < 0.05). The number of significantly increased and decreased proteins is given and the NEET proteins CDGSH1 and CDGSH2 as well as TgATM1 are indicated.
Fig 5
Fig 5. TgATM1 an PfATM1 form homodimers but no cross-species dimers are observed.
(A-C) Western blots with material from an anti-myc co-immunoprecipitation assay (Co-IP) and the corresponding flow through (FT) from parasite lysates of TgATM1-Ty-U1 parasites expressing a second copy of myc-tagged Toxoplasma- (TgATM1-Ty-U1/cTgATM1-myc), Plasmodium- (TgATM1-Ty-U1/cPfATM1-myc) or yeast ATM1 (TgATM1-Ty-U1/cScATM1-myc). Membranes were probed with anti-Ty antibody. TgATM1-Ty is indicated. Blots shown are representative of three independent experiments. (D) Schematic representation of PfATM1 domains. Full-length PfATM1 was expressed as a fusion protein in β-pET28a(+)-β. (E) Purified PfATM1-CTD (~30 kDa) with a dimeric form (~60 kDa) seen in Coomassie-stained SDS-PAGE, which are also detected in western blot with anti-6XHis Ab. (F) Purified dimeric and monomeric forms of PfATM1 after size exclusion chromatography separated on SDS-PAGE. PfATM1 dimer, of expected size 304 kDa, migrated between 158 and 440 kDa on native PAGE. (G) Negative staining TEM detected PfATM1 dimers. Arrows indicate electron densities revealing two-fold symmetry. (H) UV-VIS spectra of PfATM1, PfATM1-CTD and PfATM1-NTE. PfATM1 purified as a reddish-brown protein (inset). (I) and (J) PfATM1 (I) and TgATM1 (J) modelled on NaATM1 (PDB:4MRS). The 128 aa insertion in between the transmembrane region and CTD of PfATM1 and the insertion between TM1 and TM2 of TgATM1 could not be modelled and are shown in red. A portion (aa 231–305) of the unique PfATM1 N-terminal extension is in green. An ATP molecule is docked in the ATPase domain (CTD) of each chain and two GSSG molecules are docked at the PfATM1 dimer interface in the transmembrane region. (K) 3-D interaction plot of two GSSG molecules positioned between the two PfATM1 chains. Arg534 and Arg647 (circled in red) in each PfATM1 chain have electrostatic interactions with the two GSSG molecules. (L) Change in intrinsic tryptophan fluorescence of PfATM1 in the presence of increasing concentrations of GSSG. a.u., fluorescence intensity in arbitrary units. In the corresponding graph, change in fluorescence intensity (ΔF/F0) at 335 nm is plotted against GSSG concentrations with curve-fitting using GraphPad Prism 5. (M) [4Fe-4S]GS4 manually docked into the central cavity of PfATM1 modelled on CtATM1 (PDB:7PRO).
Fig 6
Fig 6. PfATM1 but not TgATM1 interacts directly with components of the cytosolic CIA pathway.
(A) Immunofluorescence assay of TgATM1-Ty-U1/TgNBP35-HA parasites following 0 and 72 hours of rapamycin (Rapa) treatment. Parasites were stained with anti-Ty and anti-HA antibodies as well the mitochondrial marker mitochondrial heat shock protein (mHSP70). (B) Western blots with material from an anti-HA co-immunoprecipitation assay (Co-IP) and the corresponding supernatant (SN), pellet (P) and flow through (FT) from lysates of TgATM1-Ty-U1/cTgATM1-myc/TgNBP35-HA parasites. Membranes were probed with antibodies against HA and myc. TgATM1-myc and TgNBP35-HA are indicated. Images shown in A and B are representative of three independent biological replicates, (C) Pull-down from P. falciparum lysate using PfATM1-CTD as bait. Anti-6XHis antibodies were used to detect PfATM1-CTD; anti-PfIscA2, anti-PfIscU and anti-PfHU sera detected corresponding proteins in western blots. Eluates from negative control EcEngA-tagged beads and beads alone were also loaded. (D) and (E) In vitro transfer of [4Fe-4S] to recipient apo-PfATM1 from PfIscU (D) and PfIscA2 (E) in the presence or absence of DTT.
Fig 7
Fig 7. ATPase activity of PfATM1 and GSSG transport by PfATM1-proteoliposomes.
(A) ATP hydrolysis by PfATM1 in the presence of GSH or GSSG as measured by Pi release. (B) Kinetics of ATP hydrolysis by PfATM1 in the presence or absence of GSSG. (C) Comparison of basal ATPase activity of the wild-type and PfATM1-E972Q mutant. ATP hydrolysis by PfATM1–R534E mutant was compared with wild-type protein in the presence of GSSG. (D) Comparison of ATPase activity of holo- and apo-PfATM1 (inset) in the presence or absence of GSSG. (E) Negative staining TEM of control liposomes and PfATM1-proteoliposomes. Incorporated protein is indicated by arrows. A section of the proteoliposome with PfATM1 dimer is enlarged. (F) Time-dependent GSSG uptake in the presence or absence of ATP by proteoliposomes carrying PfATM1-wild type or PfATM1-E972Q. LS, control liposome without protein. (G-H) Transport activity (G) and transport rate (H) were calculated. P values (t-test) from two biological replicates are indicated.

Similar articles

Cited by

References

    1. Kiley PJ, Beinert H. The role of Fe–S proteins in sensing and regulation in bacteria. Curr Opin Microbiol. 2003; 6: 181–185. doi: 10.1016/s1369-5274(03)00039-0 - DOI - PubMed
    1. Fontecave M. Iron-sulfur clusters: ever-expanding roles. Nat Chem Biol. 2006; 2: 171–174. doi: 10.1038/nchembio0406-171 - DOI - PubMed
    1. Rensing C, Mitra B, Rosen BP. The zntA gene of Escherichia coli encodes a Zn(II)-translocating P-type ATPase. Proc Natl Acad Sci.1997; 94: 14326–14331. doi: 10.1073/pnas.94.26.14326 - DOI - PMC - PubMed
    1. Braymer JJ, Lill R. Iron–sulfur cluster biogenesis and trafficking in mitochondria. J Biol Chem. 2017; 292: 12754–12763. doi: 10.1074/jbc.R117.787101 - DOI - PMC - PubMed
    1. Maio N, Rouault TA. Outlining the complex pathway of mammalian Fe-S cluster biogenesis. Trends Biochem Sci. 2020; 45: 411–426. doi: 10.1016/j.tibs.2020.02.001 - DOI - PMC - PubMed

MeSH terms

Substances

LinkOut - more resources