. 2024 Sep 30;20(9):e1012462.
doi: 10.1371/journal.pcbi.1012462. eCollection 2024 Sep.

A new approach to Health Benefits Package design: an application of the Thanzi La Onse model in Malawi

Affiliations

A new approach to Health Benefits Package design: an application of the Thanzi La Onse model in Malawi

Margherita Molaro et al. PLoS Comput Biol. .

Abstract

An efficient allocation of limited resources in low-income settings offers the opportunity to improve population-health outcomes given the available health system capacity. Efforts to achieve this are often framed through the lens of "health benefits packages" (HBPs), which seek to establish which services the public healthcare system should include in its provision. Analytic approaches widely used to weigh evidence in support of different interventions and inform the broader HBP deliberative process however have limitations. In this work, we propose the individual-based Thanzi La Onse (TLO) model as a uniquely-tailored tool to assist in the evaluation of Malawi-specific HBPs while addressing these limitations. By mechanistically modelling-and calibrating to extensive, country-specific data-the incidence of disease, health-seeking behaviour, and the capacity of the healthcare system to meet the demand for care under realistic constraints on human resources for health available, we were able to simulate the health gains achievable under a number of plausible HBP strategies for the country. We found that the HBP emerging from a linear constrained optimisation analysis (LCOA) achieved the largest health gain-∼8% reduction in disability adjusted life years (DALYs) between 2023 and 2042 compared to the benchmark scenario-by concentrating resources on high-impact treatments. This HBP however incurred a relative excess in DALYs in the first few years of its implementation. Other feasible approaches to prioritisation were assessed, including service prioritisation based on patient characteristics, rather than service type. Unlike the LCOA-based HBP, this approach achieved consistent health gains relative to the benchmark scenario on a year- to-year basis, and a 5% reduction in DALYs over the whole period, which suggests an approach based upon patient characteristics might prove beneficial in the future.


Conflict of interest statement

The authors have declared that no competing interests exist.

Figures

Fig 1
Fig 1
Left plot (A): Illustration of treatment delivery under a “rigid healthcare system” assumption (see section 2.2) when implementing three different prioritisation policies A, B, C. In this example, the healthcare system can provide four types of treatments (Treatments 1, 2, 3, and 4), which require different amounts of time from a medical officer, as illustrated by the height of each treatment box. On this day, eight treatments are requested in total (three Treatments 1 and 4, and one Treatment 2 and 3). The prioritisation-policy at the top of each column specifies the order in which treatments would be delivered under that policy (where”>” signifies that the treatment on the left is prioritised above the one on the right), while the dashed blue box shows the total daily capability of the required medical officer available. As a result of the resource constraint, only certain treatments can be delivered (shown in green) on that day before capabilities are exhausted (recall that overtime is allowed to complete the last treatment of the day), while all remaining ones (shown in red) will have to be postponed to a later date. Therefore, the diagram illustrates how, as a result of the adoption of different prioritisation policies, different types of treatments are preferentially delivered under a resource-constrained, “rigid” healthcare system. Right plot (B): Diagram illustrating how health-seeking persistence is implemented under a “rigid healthcare system” assumption and constrained daily capabilities. Individuals who do not receive treatment on the first day (highlighted in orange) can seek care again on following days until they have exhausted the assumed maximum number of attempts (three in this example for illustrative purposes, but seven in the simulations). If, after reaching the maximum number of attempts, they still have not succeeded in receiving treatment, they will default from care entirely, and that treatment will never be delivered (as in the case for one of the Treatments 4, highlighted in red). Note that the order in which treatments are organised on subsequent days is determined both by the prioritisation-policy adopted and, for treatments with the same priority, by the date in which care was first sought, as discussed in section 2.3.
Fig 2
Fig 2
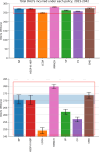
Top plot: Total DALYs incurred overall (between 2023 and 2042 inclusive) under each policy considered. Error bars show the 95% confidence interval (CI), with the shaded blue region extending the NP ones to facilitate comparison. Bottom plot: Zoom-in of the range highlighted in red in the top plot.
Fig 3
Fig 3. Mean DALYs lost overall between 2023 and 2042 (inclusive) under different policies broken down by con- tributing causes, where the causes (excluding “Other” causes, which are added at the end) have been ranked from the highest to the lowest contributing under the NP policy.
Fig 4
Fig 4. Evolution of the ten leading causes of DALYs over the period considered for the benchmark case of the NP policy, ranked by their overall contribution in the 2023–2042 period.
The black line shows the total DALYs incurred from all causes, while the light blue line shows the DALYs contributed by the top ten causes.
Fig 5
Fig 5. Yearly breakdown of DALYs incurred yearly under each policy considered.
Error bars show the 95% confidence interval (CI).
Fig 6
Fig 6
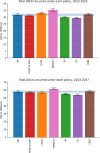
Overall DALYs incurred under different policies during the initial three years (top figure) and five years (bottom figure) after the adoption of the policies. This illustrates that an implementation period of five years or longer is necessary for the LCOA to provide a significant benefit over no prioritisation strategy at all.

References

    1. Ochalek J, Revill P, Manthalu G, McGuire F, Nkhoma D, Rollinger A, et al.. Supporting the development of a health benefits package in Malawi. BMJ Glob Health. 2018;3(2):e000607. doi: 10.1136/bmjgh-2017-000607 - DOI - PMC - PubMed
    1. The World Bank. World Development Report 1993: Investing in Health; 1993. Available from:https://openknowledge.worldbank.org/entities/publication/cfc6265c-8fc7-5....
    1. Glassman A, Giedion U, Sakuma Y, Smith PC. Defining a Health Benefits Package: What Are the Necessary Processes? Health Syst Reform. 2016. Jan;2(1):39–50. doi: 10.1080/23288604.2016.1124171 - DOI - PubMed
    1. Ochalek J, Lomas J, Claxton K. Estimating health opportunity costs in low-income and middle-income countries: a novel approach and evidence from cross-country data. BMJ Glob Health. 2018;3(6):e000964. doi: 10.1136/bmjgh-2018-000964 - DOI - PMC - PubMed
    1. Ministry of Health of Ethiopia. Essential Health Services Package of Ethiopia. Addis Ababa, Ethiopia; 2019. Accessed on 22/04/24. Available online athttps://www.uib.no/sites/w3.uib.no/files/attachments/essential_health_se....