. 2024 Sep 30;20(9):e1012489.
doi: 10.1371/journal.pcbi.1012489. eCollection 2024 Sep.

Exploring the potential of structure-based deep learning approaches for T cell receptor design

Affiliations

Exploring the potential of structure-based deep learning approaches for T cell receptor design

Helder V Ribeiro-Filho et al. PLoS Comput Biol. .

Abstract

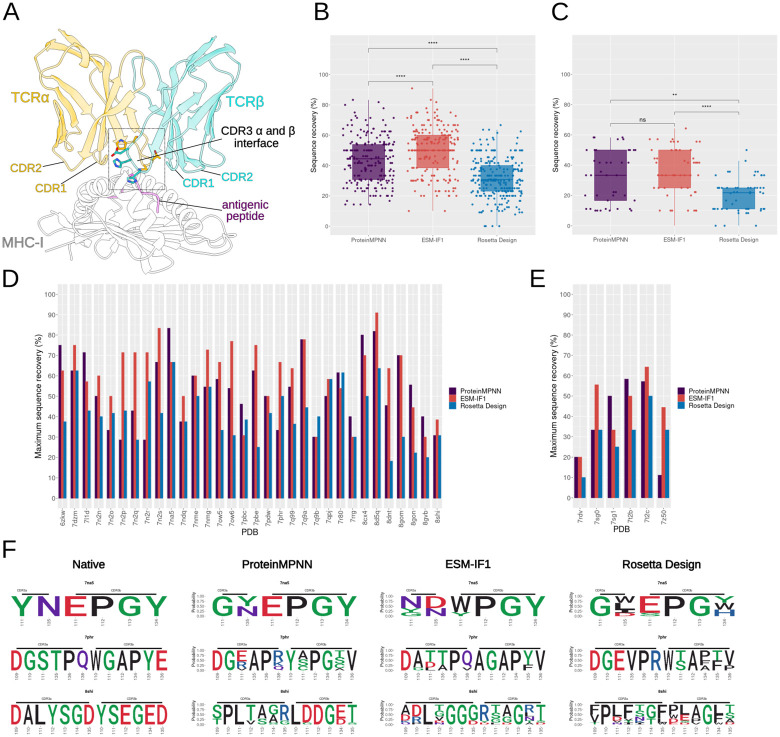
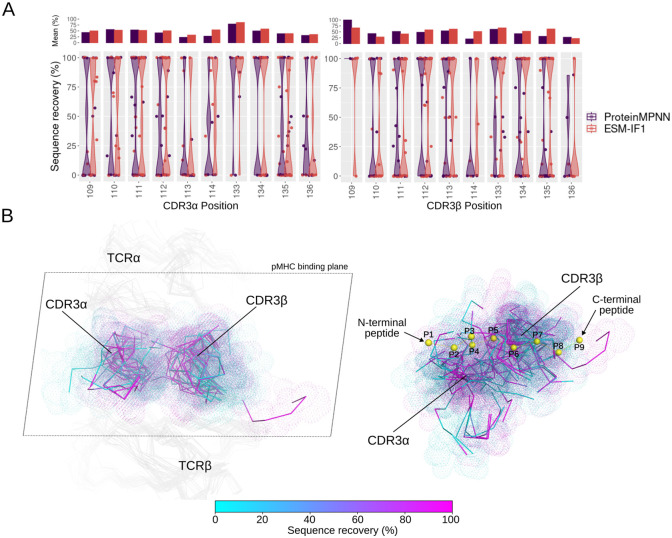
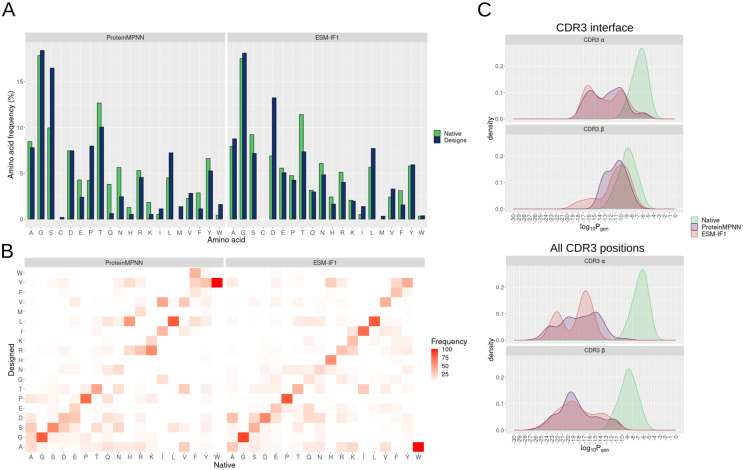
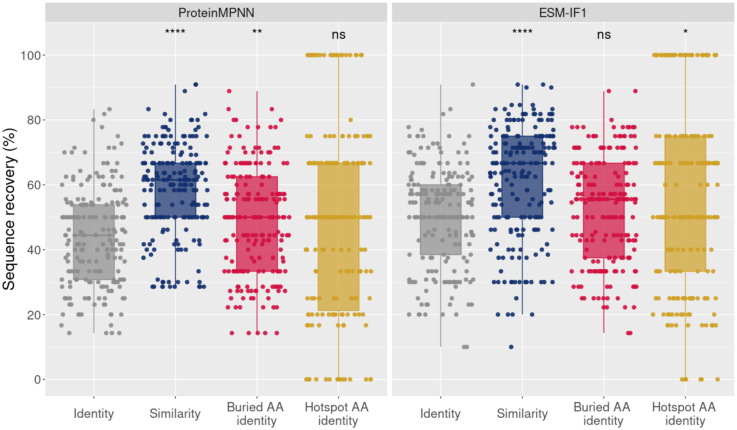
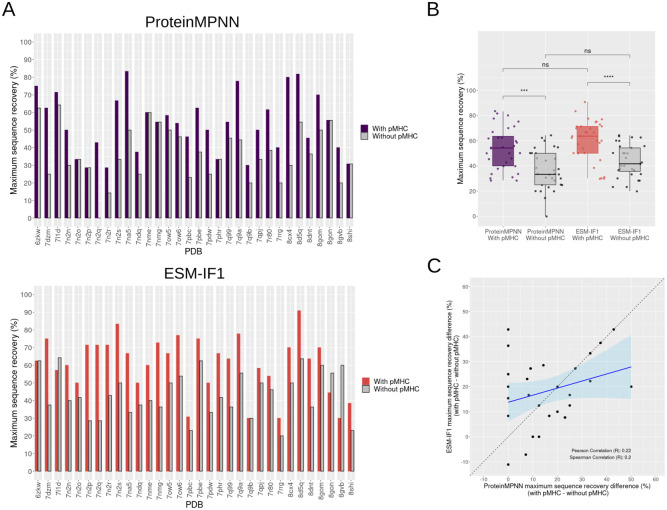
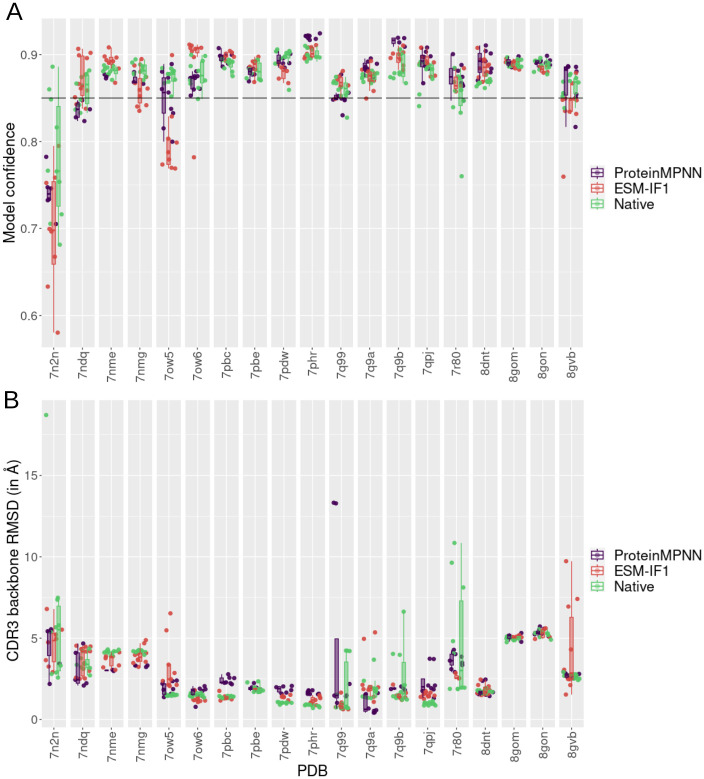
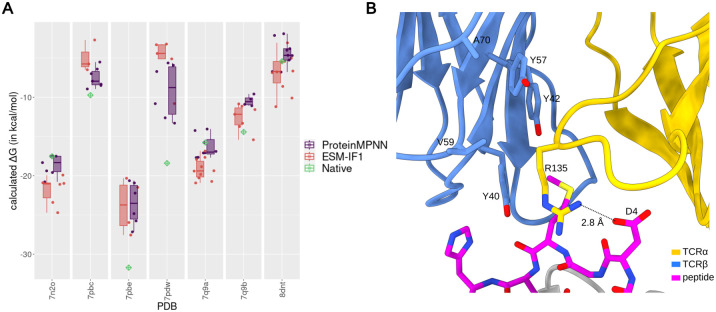
Deep learning methods, trained on the increasing set of available protein 3D structures and sequences, have substantially impacted the protein modeling and design field. These advancements have facilitated the creation of novel proteins, or the optimization of existing ones designed for specific functions, such as binding a target protein. Despite the demonstrated potential of such approaches in designing general protein binders, their application in designing immunotherapeutics remains relatively underexplored. A relevant application is the design of T cell receptors (TCRs). Given the crucial role of T cells in mediating immune responses, redirecting these cells to tumor or infected target cells through the engineering of TCRs has shown promising results in treating diseases, especially cancer. However, the computational design of TCR interactions presents challenges for current physics-based methods, particularly due to the unique natural characteristics of these interfaces, such as low affinity and cross-reactivity. For this reason, in this study, we explored the potential of two structure-based deep learning protein design methods, ProteinMPNN and ESM-IF1, in designing fixed-backbone TCRs for binding target antigenic peptides presented by the MHC through different design scenarios. To evaluate TCR designs, we employed a comprehensive set of sequence- and structure-based metrics, highlighting the benefits of these methods in comparison to classical physics-based design methods and identifying deficiencies for improvement.


Conflict of interest statement

The authors have declared that no competing interests exist.

Figures

Fig 1
Fig 1. Sequence recovery analysis of interface CDR3s amino acids in designs with ProteinMPNN, ESM-IF1 or Rosetta Design (InterfaceDesign2019 protocol).
(A) Representative structure of a TCR:pMHC complex (PDB ID: 7nme). The TCR variable and MHC chains were trimmed to just include components spatially related to the interface. The interface is indicated and the CDR3s amino acids composing the interface are shown as sticks. (B) Percentage of sequence recovery per method considering all MHC-I test cases. Each point represents a unique design sequence from a test case. For each test case, a total of 10 designs were generated by each method, but redundant designs were removed from the plot. For ProteinMPNN we employed a temperature sampling of 0.1, whereas for ESM-IF1 a temperature sampling of 0.2 was used (see Methods). Statistical two-sample pairwise comparison between methods were performed using Mann-Whitney test with the R ggpubr package. Significance is indicated above each box plot (**** and ** correspond to a p-value below 0.0001 and 0.01, respectively, while ‘ns’ means no significance). (C) same as (B), but for MHC-II. (D) Maximum sequence recovery obtained for each MHC-I test case and (E) for MHC-II test cases. (F) Sequence logo of three MHC-I test cases: 7na5, 7qhr, and 8shi. Each row of the panel corresponds to a specific test case and each column corresponds to the design method applied. The first column presents the native amino acids.
Fig 2
Fig 2. ProteinMPNN and ESM-IF1 sequence recovery per CDR3 designed positions.
(A) The distribution of the percentage of sequence recovery per designed CDRα (on the left) and CDR3β (on the right) position is depicted as violin plots. Each point represents the average sequence recovery over non-redundant designed amino acids for a given test case at a given position. The position numbering follows the AHO numbering scheme. The upper bar plot shows the average over each sequence recovery distribution. Positions with fewer than three designed cases were removed for clarity. (B) ESM-IF1 sequence recovery is mapped onto the TCR structures. On the left, structures of test cases are superposed by the TCR, and only the TCR α and β chains are presented. The structures are oriented towards the pMHC plane. The CDR3β that stands out among the others is the long CDR3β from the test case 7l1d. On the right, the structures are superposed by the MHC, and only the CDR3s are shown. A representative peptide is presented as yellow spheres to highlight the orientation of the CDR3 segments in relation to the pMHC interface.
Fig 3
Fig 3. Occurrence of amino acids at CDR3 interface positions in native and designed sequences.
(A) Frequency of each amino acid at the CDR3 designed positions in native and ProteinMPNN (left panel) or ESM-IF1 (right panel). Higher frequency indicates that the amino acid was more frequently observed at the CDR3 interface in the analyzed test cases. Only non-redundant generated sequences are considered in the analysis. The x axis is ordered by the BLOSUM62 amino acid grouping: [A, G, S], [C], [D, E, P, T], [Q, N, H, R, K], [I, L, M, V], [F, Y, W]. (B) Heat map of the frequency of substitutions of the amino acid substitutions in the designed sequences. The x axis represents the amino acids at the native sequences and the y axis represents the corresponding substitution in the designed sequences. A hypothetical frequency of 100% alanine in native sequences and leucine in designed sequence, for instance, indicates that we observed a change from alanine to leucine in all design cases. (C) Distribution of the Estimation of Generation Probabilities (Pgen) of CDR3 Sequences Using OLGA [28]. Pgen was estimated for each CDR3 (α or β) generated by ProteinMPNN (in purple) or ESM-IF1 (in red) from different design scenarios (design of only CDR3 interface positions—upper panel—or design of all CDR3 positions—bottom panel). For comparison, Pgen was also estimated for CDR3 sequences from the test case native structures (in green). This analysis considered only designs from human TCR test cases bound to MHC-1, and only Pgen values greater than 0 were presented in the density plot.
Fig 4
Fig 4. Sequence recovery analysis of interface CDR3s amino acids in terms of identity, similarity, identity at buried positions and identity at hotspot positions for ProteinMPNN (left panel) and ESM-IF1 (right panel).
For both panels, each point of the box plot represents the percentage of sequence recovery of a unique design sequence from the MHC-I test cases, without redundancy. While identity considers only substitutions to the same native amino acid as recovered, the similarity considers as recovered substitutions to the same amino acid (AA) physicochemical class (see Methods). The buried AA identity corresponds to the identity only computed over buried positions (estimated by relative solvent accessibility, see Methods), whereas the hotspot AA identity corresponds to the identity only computed over interface CDR3s hotspot positions, predicted by computational alanine scanning experiments with Rosetta (see Methods). Statistical pairwise comparison assessed the significance between the identity (reference) and the other metrics. It was performed using the Mann-Whitney test with the R ggpubr package. Significance is indicated above each box plot (****, ** and * correspond to a p-value below 0.0001, 0.01 and 0.05, respectively, while ‘ns’ means no significance (p- value ≥ 0.05)). A detailed view of the same evaluated metrics per PDB test case is presented in S13 Fig.
Fig 5
Fig 5. Maximum sequence recovery of interface CDR3s amino acids in the presence or absence of pMHC structures.
(A) Bar plot displaying the maximum sequence recovery for each test case, with designs generated by ProteinMPNN shown on the top and those by ESM-IF1 on the bottom. Colored bars (purple or red) represent the CDR3 interface designs considering the corresponding pMHC complex, while grey bars represent the interface design of unbound TCRs without the pMHC. (B) Same as (A), but grouping together the maximum sequence recovery values for ProteinMPNN with pMHC, ProteinMPNN without pMHC, ESM-IF1 with pMHC, and ESM-IF1 without pMHC. Statistical comparison between groups were performed using Mann-Whitney test with the R ggpubr package. Significance is indicated above each box plot (**** and *** correspond to a p-value below 0.0001 and 0.001, respectively, while ‘ns’ means no significance (p- value ≥ 0.05)). (C) Scatter plot with a linear trend line and a 95% confidence interval (light blue region) illustrating the correlation between the difference in maximum sequence recovery upon pMHC removal (maximum sequence recovery with pMHC minus sequence recovery without pMHC) for ProteinMPNN and ESM-IF1. A dashed diagonal line is included to aid in visual comparison. The correlation coefficients are indicated in the plot.
Fig 6
Fig 6. Modeling of TCR CDR3 interface designs with TCRmodel2.
(A) Box plot of model confidence of ProteinMPNN (in purple) and ESM-IF1 (in red) TCR designs for each test case. Each point represents a different design. The model confidence of remodeled native sequences is colored in green. In this case we remodeled the native sequences 10 times to obtain a distribution of modeling scores that represent the native structure. (B) Root-mean-square deviation (RMSD) of CDR3 backbone atoms (both alpha and beta TCR chains) of designs in comparison to the corresponding native crystal structure that originated the designs. RMSDs were determined after structure superposition by the MHC.
Fig 7
Fig 7. Molecular dynamics simulation analysis and binding affinity estimation with MM/PBSA of Native and ProteinMPNN and ESM-IF1 TCR designs.
(A) Box plot of calculated ΔG (in kcal/mol) of ProteinMPNN (in purple) and ESM-IF1 (in red) designs in comparison to the calculated ΔG of the native complex (green diamond) for each evaluated MHC-I test case. Each point corresponds to the median of calculated ΔG from 15 replicas. The detailed distribution of ΔG across replicas and statistical tests are presented in S25 Fig. (B) Visualization of the TCR and peptide interface from the PDB 7pdw, highlighting the interaction between R135 from the TCRα and the D4 residue of the peptide.

Update of

Similar articles

Cited by

References

    1. Bassing CH, Swat W, Alt FW. The Mechanism and Regulation of Chromosomal V(D)J Recombination. Cell. 2002;109:S45–S55. doi: 10.1016/S0092-8674(02)00675-X - DOI - PubMed
    1. Zhao L, Cao YJ. Engineered T Cell Therapy for Cancer in the Clinic. Frontiers in Immunology. 2019;10. doi: 10.3389/fimmu.2019.02250 - DOI - PMC - PubMed
    1. Shafer P, Kelly LM, Hoyos V. Cancer Therapy With TCR-Engineered T Cells: Current Strategies, Challenges, and Prospects. Frontiers in Immunology. 2022;13. doi: 10.3389/fimmu.2022.835762 - DOI - PMC - PubMed
    1. Baulu E, Gardet C, Chuvin N, Depil S. TCR-engineered T cell therapy in solid tumors: State of the art and perspectives. Science Advances. 2023;9. doi: 10.1126/sciadv.adf3700 - DOI - PMC - PubMed
    1. Chandran SS, Klebanoff CA. T cell receptor-based cancer immunotherapy: Emerging efficacy and pathways of resistance. Immunological Reviews. 2019;290:127–147. doi: 10.1111/imr.12772 - DOI - PMC - PubMed

Substances

LinkOut - more resources