. 2024 Oct 8;121(41):e2320034121.
doi: 10.1073/pnas.2320034121. Epub 2024 Sep 30.

Modulation of diabetes-related retinal pathophysiology by PTX3

Affiliations

Modulation of diabetes-related retinal pathophysiology by PTX3

Varun Pathak et al. Proc Natl Acad Sci U S A. .

Abstract

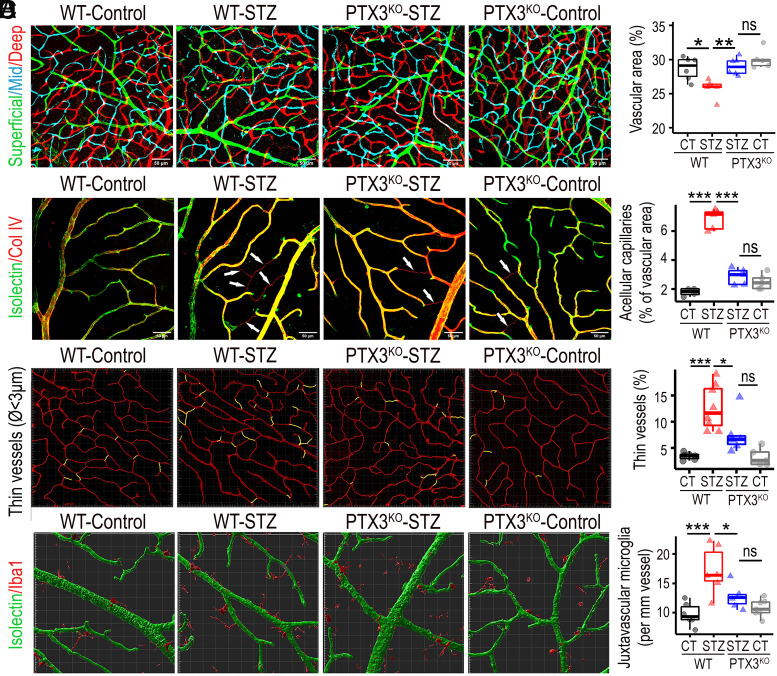
Diabetic retinopathy (DR) is a common complication of diabetes characterized by vascular pathology and neuroinflammation. Pentraxin 3 (PTX3) is a soluble pattern recognition molecule that functions at the crossroads between innate immunity, inflammation, and tissue remodeling. DR is known to involve inflammatory pathways, although the potential relevance of PTX3 has not been explored. We found that PTX3 protein levels increased in the retina of diabetic mice. Similarly, evaluation of a publicly available transcriptomic human dataset revealed increased PTX3 expression in DR with diabetic macular edema and proliferative retinopathy, when compared to nondiabetic retinas or diabetic retinas without complications. To further understand the role of PTX3 within DR, we employed the streptozotocin-induced diabetes model in PTX3 knockout mice (PTX3KO), which were followed up for 9 mo to evaluate hallmarks of disease progression. In diabetic PTX3KO mice, we observed decreased reactive gliosis, diminished microglia activation, and reduced vasodegeneration, when compared to diabetic PTX3 wild-type littermates. The decrease in DR-associated pathological features in PTX3KO retinas translated into preserved visual function, as evidenced by improved optokinetic response, restored b-wave amplitude in electroretinograms, and attenuated neurodegeneration. We showed that PTX3 induced an inflammatory phenotype in human retinal macroglia, characterized by GFAP upregulation and increased secretion of IL6 and PAI-1. We confirmed that PTX3 was required for TNF-α-induced reactive gliosis, as PTX3KO retinal explants did not up-regulate GFAP in response to TNF-α. This study reveals a unique role for PTX3 as an enhancer of sterile inflammation in DR, which drives pathogenesis and ultimately visual impairment.

Keywords: PTX3; diabetic retinopathy; gliosis; microglia; retinopathy.


Conflict of interest statement

Competing interests statement:The authors declare no competing interest.

Figures

Fig. 1.
Fig. 1.
PTX3 is increased in diabetic retinas. (A) Experimental design, methods, and reference diagram for retinal cross-section identifying distinct cell types. Created with BioRender.com. (B) Immunohistochemistry for PTX3 (red) in cross-sections of peripheral retina in 9-mo diabetic mice (STZ) and age-matched controls. Nuclei counterstained with DAPI (blue). (Scale bar, 50 μm.) (C) Quantification of PTX3 staining area as integrated density, *P < 0.05, n = 5. (D) Immunostaining of mouse diabetic retinas with antibodies against PTX3 (green) and GS (red). (Scale bar, 50 μm.) (E) Fluorescent microscopy image of the nerve fiber and ganglion cell layers stained for PTX3 (green), GFAP (red), and DAPI (blue). (Scale bar, 25 μm.) (F) Representative image of the outer plexiform layer stained for PTX3 (green), GS (red), and DAPI (blue). (Scale bar, 20 μm.) (G) PTX3 gene expression evaluated by RT-qPCR in mouse whole retinal tissue at 3, 6, and 9 mo after STZ injection alongside controls. *P < 0.05. (H) PTX3 gene expression levels in human retinas across the natural history of diabetic retinopathy (DR) from GSE160306, **P < 0.01. NPDR: nonproliferative DR, PDR: proliferative DR, DME: diabetic macular edema.
Fig. 2.
Fig. 2.
PTX3-deficient mice showed reduced reactive gliosis in diabetic retinas. (A) Immunofluorescence for GFAP (red) in retinal cross-sections from diabetic and nondiabetic mice, wild type, and PTX3KO. (Scale bar, 50 μm.) (B) Quantification of GFAP staining as number of fibers per 100 μm, **P < 0.01, n ≥ 6. (C) Immunostaining of mouse retinas with antibodies against IL1β (red). (Scale bar, 50 μm.) (D) Quantification of IL1β staining as integrated density, **P < 0.01, n ≥ 4.
Fig. 3.
Fig. 3.
PTX3 induces activation of retinal macroglia. (A) Mouse retinal explants from WT or PTX3KO mice were treated ex vivo with 5 ng/ml TNF-α for four hours and then stained for GFAP (red). (Scale bar, 50 μm.) (B) Quantification of GFAP signal in retinal explants using the raw integrated density per μm2 of retinal tissue. **P < 0.01; ns: nonsignificant, n ≥ 5. (C) Human retinal astrocytes were treated with vehicle, 5 ng/ml PTX3, or 5 ng/ml TNF-α, and the release of proteins PAI-1, IL6, and IL8 was quantified by ELISAs in culture supernatants collected after 72 h. *P < 0.05; **P < 0.01; ns: nonsignificant, n = 5. (D) Staining of retinal astrocyte cultures after treatments for GFAP (red). Quantification of GFAP staining was performed using the raw integrated density. *P < 0.05; ***P < 0.001; ns: nonsignificant, n ≥ 6. (Scale bar, 50 μm.) (E) Protein lysates from astrocyte cultures were assessed by western blotting, and ODs were used for relative quantification in relation to β-actin. *P < 0.05, n = 3.
Fig. 4.
Fig. 4.
Retinal microglia activation is reduced in diabetic retinas lacking PTX3. (A) Microscopy image of retinal tissue stained for Iba1 and pseudocolored based on retinal depth obtained from z-scanned confocal microscopy to depict retinal layers as deep (red), intermediate (cyan), and superficial (green). (Scale bar, 50 μm.) (B) Representative images of microglia profiles as shown by Iba1 staining across the four experimental groups in the deep retinal layer. Concentric circles used in the Sholl morphometric analysis are shown in white. (C) Quantification of Sholl analysis metrics sum of intersections, maximal intersection radius, and ramification index in the deep retinal layer. *P < 0.05; **P < 0.01; ***P < 0.001; ns: not significant, n = 6.
Fig. 5.
Fig. 5.
Diabetic mice lacking PTX3 were protected from retinal vasodegeneration. (A) Fluorescent confocal scanning microscopy image of retinal blood vessels stained with isolectin and pseudocolored based on retinal depth as deep (red), intermediate (cyan), and superficial (green). *P < 0.05; **P < 0.01; ns: not significant, n ≥ 5. (Scale bar, 50 μm.) (B) Immunostaining for Collagen IV (red) and isolectin (green) to identify and quantify acellular capillaries. Collagen IV–positive and isolectin-negative structures are indicated by white arrows. ***P < 0.001; ns: nonsignificant, n ≥ 4. (Scale bar, 50 μm.) (C) Imaris software-based analysis to select and quantify vasculature with a diameter smaller than 3 μm, defined as thin vessels. *P < 0.05; ***P < 0.001; ns: nonsignificant, n ≥ 5. (D) Costaining of retinas for Iba1 (red) and isolectin (green) in the superficial layer to identify and quantify juxtavascular Iba1+ cells. Each square block is 20 × 20 μm. *P < 0.05; ***P < 0.001; ns: nonsignificant, n ≥ 6.
Fig. 6.
Fig. 6.
Retinal function is protected in diabetic retinas lacking PTX3. (A) Optokinetic responses measured at 3 and 9 mo since diabetes induction in WT and PTX3KO mice. Age-matched nondiabetic animals were used as controls. *P < 0.05; ns: not significant, n ≥ 5. (B) Electroretinograms performed at 9-mo diabetes. Trace shows the mean for the experimental group with CI in gray. (C) Quantification and statistical analysis of a wave from electroretinograms. ***P < 0.001; ns: not significant, n ≥ 4. (D) Statistical comparison of the b wave from electroretinograms. *P < 0.05; **P < 0.01; ns: not significant, n ≥ 4. (E) Imaging and evaluation of the outer nuclear layer in retinas stained with DAPI for nuclear identification. *P < 0.05; **P < 0.01; ns: not significant, n ≥ 6. (Scale bar, 20 μm.) (F) Immunostaining for Cone arrestin (red) with quantification of the number of cells per 100 μm. *P < 0.05, ns: not significant, n ≥ 2. (Scale bar, 50 μm.) (G) Staining of retinas for Brn3a (red) and quantification as a percentage of Brn3a-positive cells in total cells identified by DAPI nuclear staining. **P < 0.01; ns: not significant, n ≥ 4. (Scale bar, 50 μm.)

References

    1. Guariguata L., et al. , Global estimates of diabetes prevalence for 2013 and projections for 2035. Diabetes Res. Clin. Pract. 103, 137–149 (2014). - PubMed
    1. Leasher J. L., et al. , Global estimates on the number of people blind or visually impaired by diabetic retinopathy: A meta-analysis from 1990 to 2010. Diabetes Care 39, 1643–1649 (2016). - PubMed
    1. Duh E. J., Sun J. K., Stitt A. W., Diabetic retinopathy: Current understanding, mechanisms, and treatment strategies. JCI Insight. 2, e93751 (2017). - PMC - PubMed
    1. Forrester J. V., Kuffova L., Delibegovic M., The role of inflammation in diabetic retinopathy. Front. Immunol. 11, 583687 (2020). - PMC - PubMed
    1. Noma H., Mimura T., Yasuda K., Shimura M., Role of inflammation in diabetic macular edema. Ophthalmologica 232, 127–135 (2014). - PubMed

MeSH terms

LinkOut - more resources