. 2024 Oct 8;121(41):e2407936121.
doi: 10.1073/pnas.2407936121. Epub 2024 Sep 30.

Insulin-inspired hippocampal neuron-targeting technology for protein drug delivery

Affiliations

Insulin-inspired hippocampal neuron-targeting technology for protein drug delivery

Noriyasu Kamei et al. Proc Natl Acad Sci U S A. .

Abstract

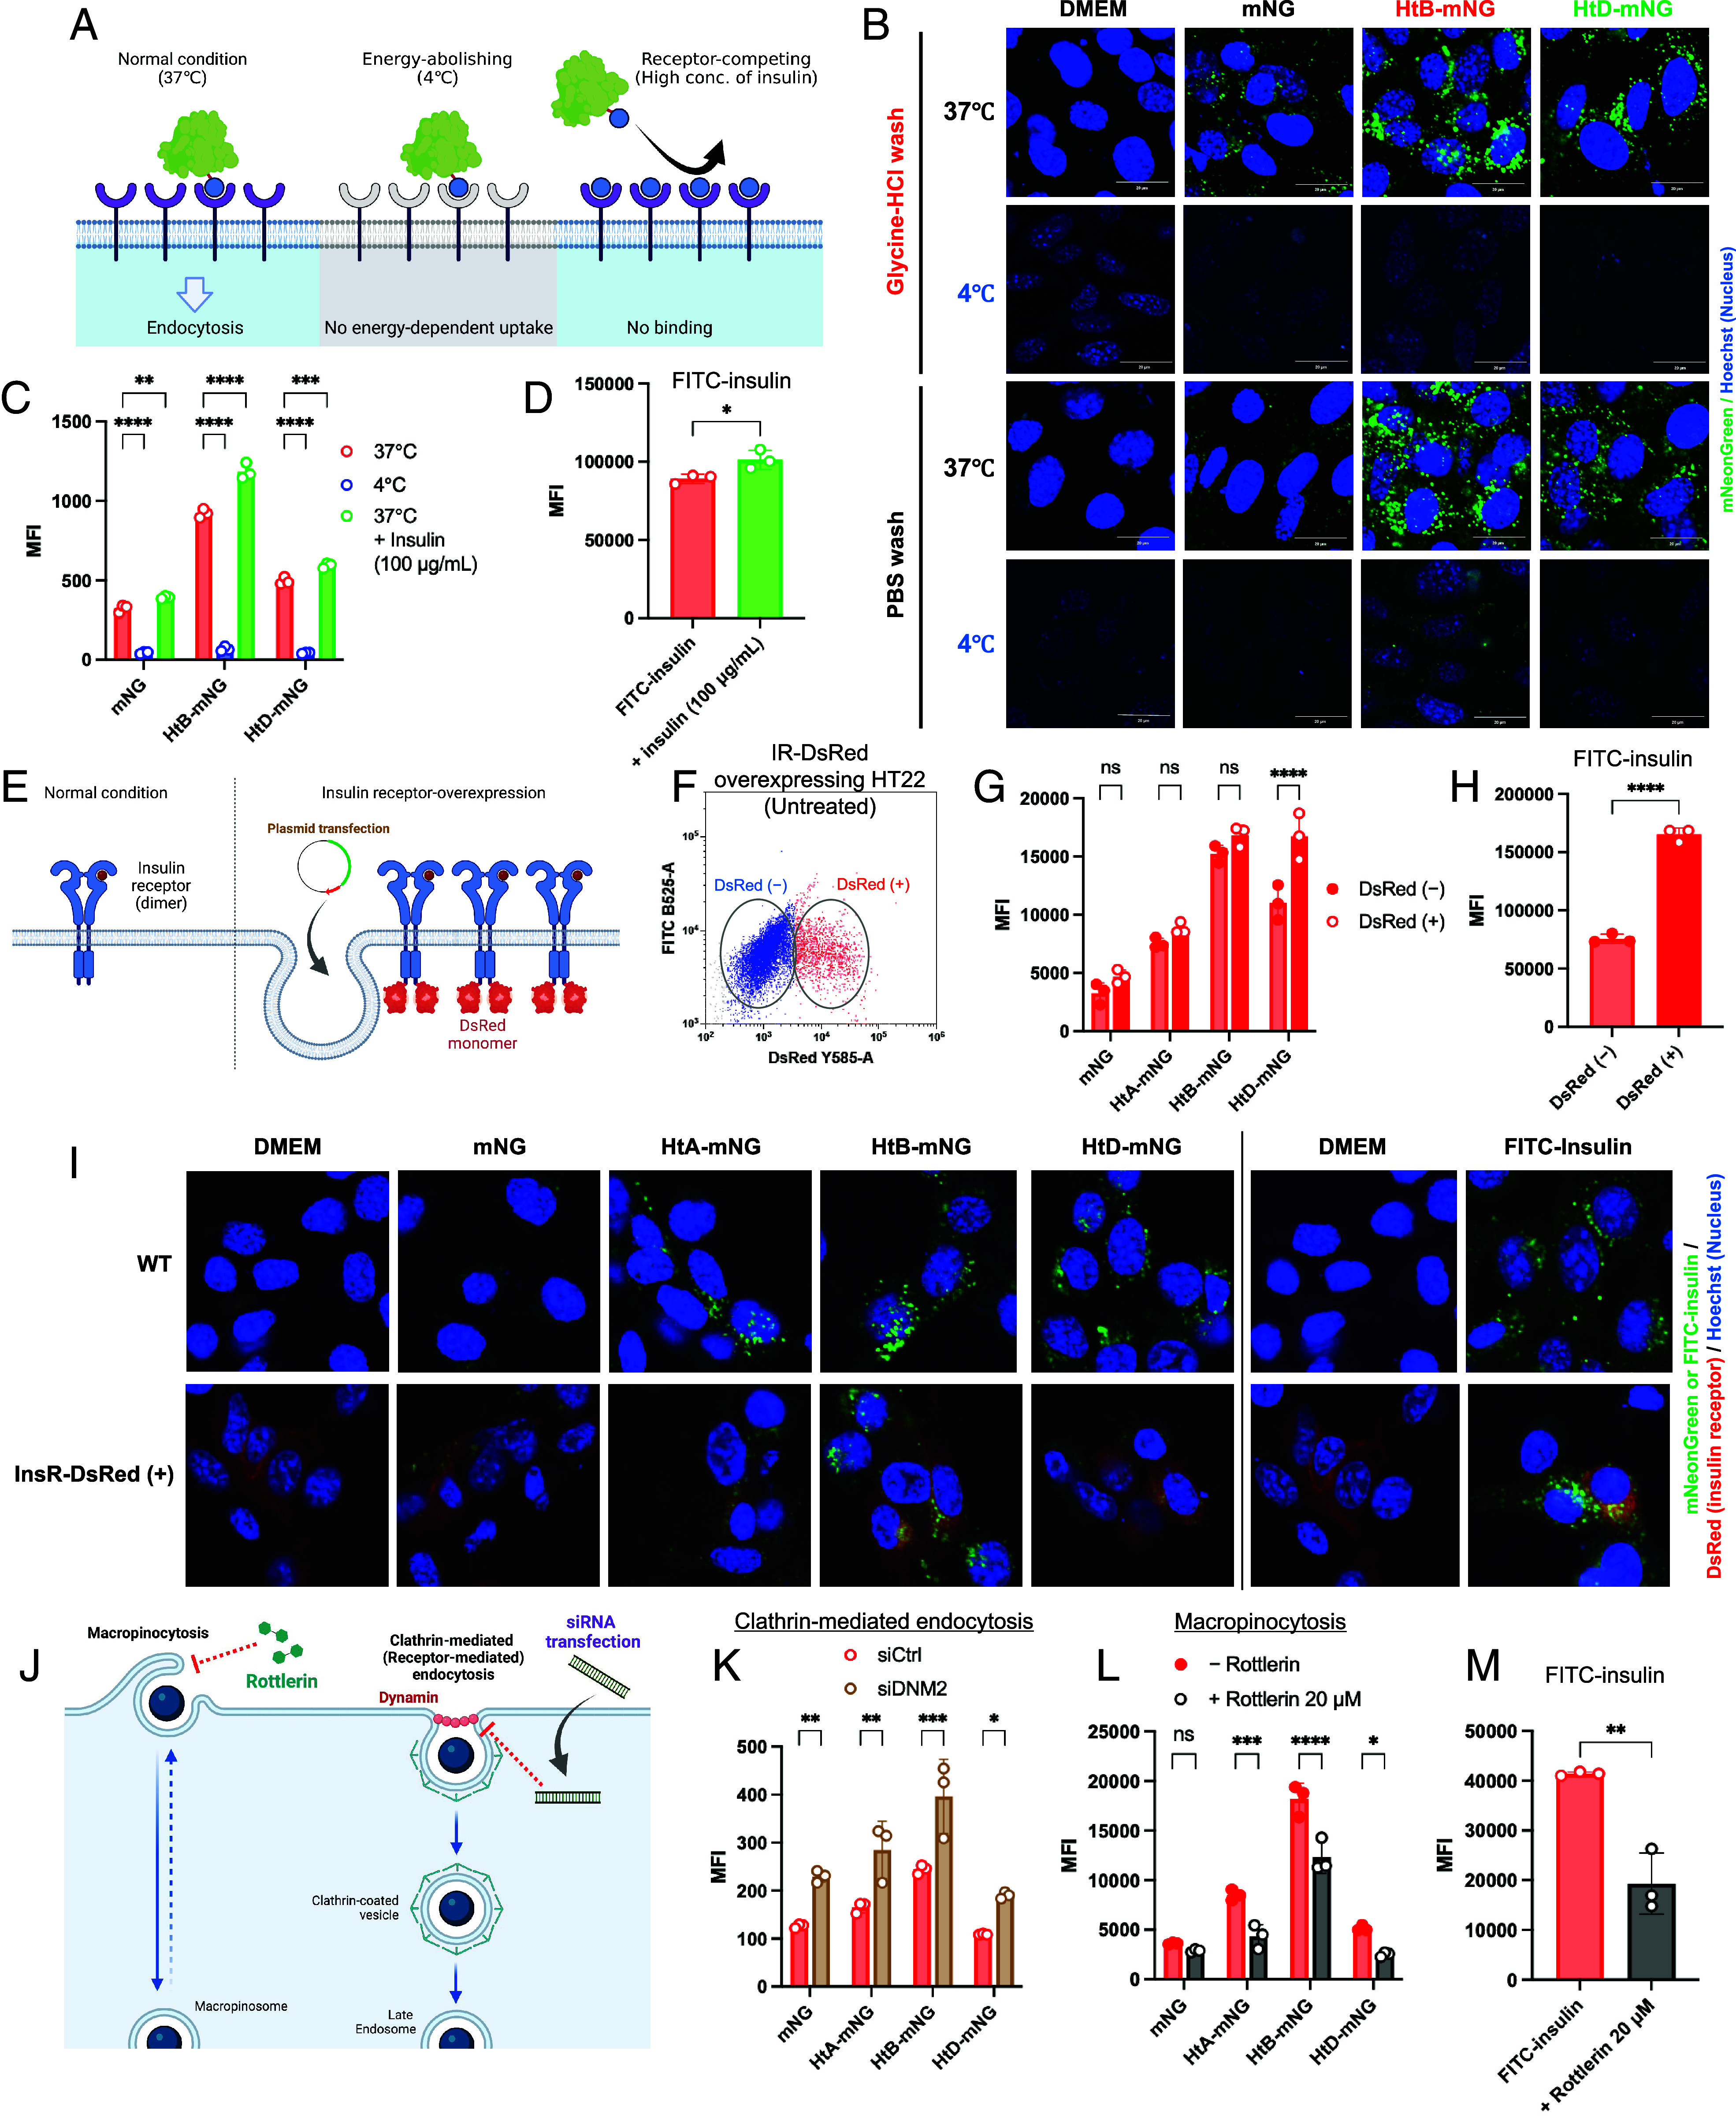
Hippocampal neurons can be the first to be impaired with neurodegenerative disorders, including Alzheimer's disease (AD). Most drug candidates for causal therapy of AD cannot either enter the brain or accumulate around hippocampal neurons. Here, we genetically engineered insulin-fusion proteins, called hippocampal neuron-targeting (Ht) proteins, for targeting protein drugs to hippocampal neurons because insulin tends to accumulate in the neuronal cell layers of the hippocampus. In vitro examinations clarified that insulin and Ht proteins were internalized into the cultured hippocampal neurons through insulin receptor-mediated macropinocytosis. Cysteines were key determinants of the delivery of Ht proteins to hippocampal neurons, and insulin B chain mutant was most potent in delivering cargo proteins. In vivo accumulation of Ht proteins to hippocampal neuronal layers occurred after intracerebroventricular administration. Thus, hippocampal neuron-targeting technology can provide great help for developing protein drugs against neurodegenerative disorders.

Keywords: Alzheimer’s disease; drug delivery; fusion protein; hippocampal neuron; insulin.


Conflict of interest statement

Competing interests statement:The authors declare no competing interest.

Figures

Fig. 1.
Fig. 1.
Schematic conceptual illustration of the study. (A) Need for targeted delivery of drugs, including antibodies, neurotrophic factors, and nucleic acids, to hippocampal neurons for protection and repair in neurodegenerative disorders, such as dementia (AD). (B) Obstacles for transport of drugs to the brain. The BBB prevents entry of exogenous molecules, even therapeutic drugs. Drugs are required to reach deep target regions of the brain, such as the hippocampus, through the brain parenchyma. (C) Unique strategy to deliver protein-based drugs to the hippocampus via fusion with insulin, which potentially accumulates on hippocampal neurons. Our goal is to effectively deliver insulin-fusion protein therapeutics from administration sites (nose or systemic circulation) to hippocampal neurons. Illustrations were created with BioRender.com.
Fig. 2.
Fig. 2.
In vitro and in vivo characterization of insulin as a carrier to hippocampal neurons. (A) Brief illustration of the in vivo study for evaluating the specificity of insulin accumulation in the brain. For microscopic observation, brain specimens were isolated from mice receiving intranasal insulin (10 IU/kg) with mucosal permeation enhancer (L-penetratin, 2 mM). Frozen brain sections were treated with primary antibodies to insulin and various cell markers (MAP2, neuronal cell body; GFAP, astrocytes; nestin, neuronal stem cells) and stained with secondary antibodies conjugated with fluorescent dyes. (B) Representative images (from three mice) of the hippocampus after intranasal delivery of insulin. (C) Four types of cells were used for the in vitro study (NIH3T3 cells as unrelated control, bEnd.3 cells as BBB model, C6 cells as glial model, and HT22 cells as hippocampal neuron model). (D) Confocal micrographs of cells incubated with FITC-insulin (10 μg/mL) for 120 min at 37 °C. Prior to observation, the cells were washed thrice with glycine–HCl buffer and once with phosphate-buffered saline (PBS) for optimal detection of intracellular fluorescence. The bars indicate 20 μm. (E) Histograms generated from flow cytometry after incubation with FITC-insulin (10 μg/mL) for 120 min at 37 °C. (F) Geometric mean fluorescence intensity (MFI) calculated from the results of flow cytometry as the quantitative parameter. (G) Comparison of cellular uptake of FITC-insulin by HT22 and N2a cells. (H and I) Flow cytometry for examining energy dependence of cellular uptake of FITC-insulin by comparing them at biological (37 °C) and energy-abolishing (4 °C) conditions. (J) Western blot analysis to compare the expression of IR between cells. Samples were loaded at 6 μg of total protein. β-Actin was used as housekeeping control. (K) Relative expression levels of IR to β-actin between cells based on western blotting.
Fig. 3.
Fig. 3.
Production and characterization of Ht proteins. (A) Design of plasmid vectors for generating fusion proteins with insulin. The constructs were designed for fusing target proteins with A chain (21 amino acids), B chain (30 amino acids), or full-length insulin (B chain/c-peptide/A chain, proinsulin form). Nluc luciferase and mNG were chosen as experimental model proteins for detection in several assays. (B and C) The Ht proteins expressed in bacteria [BL21(DE3) or SHuffle T7 E. coli] were purified with nickel affinity columns through the HN-repeat tag at the C terminus of fusion proteins. Ht proteins were mostly eluted in fraction #2. (D and E) Luminescence or fluorescence intensity of Ht proteins (Nluc/mNG) was measured with a microplate reader at 100 pg/mL or 20 μg/mL, respectively. (F and G) Western blotting of Ht-Nluc and mNG, respectively. Samples were loaded at 75 ng/mL of purified protein. Poly vinylidene difluoride (PVDF) membranes were treated with antibodies for Nluc, mNG, insulin A chain, and B chain. Arrows indicate the molecular weight of original Nluc or mNG.
Fig. 4.
Fig. 4.
In vitro cellular uptake and in vivo brain distribution of Ht-mNG. (A) Brief illustration of in vitro evaluation with confocal scanning microscopy and flow cytometry. NIH3T3 cells (unrelated control), bEnd.3 cells (BBB model), C6 cells (glial model), and HT22 cells (hippocampal neuron model) were used in this study. (B and C) Confocal micrographs of cells treated with Ht-mNG (25 μg/mL) for 120 min at 37 °C. Prior to observation, the cells were washed thrice with glycine–HCl buffer and once with PBS for optimal fluorescence investigation. Panel (B) compares cellular uptake of all Ht-mNG by bEnd.3 and HT22 cells. Panel (C) compares uptake of HtB- and HtD-mNG between all four cell types. (D and E) Histograms and geometric MFI, respectively, generated from flow cytometry after treatment with Ht-mNG at 25 μg/mL at 37 °C. (F) Brief illustration of the SPR assay. Purified IR with α and β chains was immobilized on the CM5 sensorchip, and various concentrations of Ht-mNG were injected into the flow as analytes. Intermolecular binding was detected as mass change on the sensorchip. (G) Binding sensorgrams after Ht-mNG was injected to the IR –immobilized flow cell, where specific binding was expressed by subtracting nonspecific binding to blank flow cell from the total binding. (H) Comparison of cellular uptake of Ht-mNG by HT22 and N2a cells. (I) Brief illustration of ICV administration to mice. Mice brains were isolated 30 min after ICV administration of Ht-mNG (250 μg/mL, 10 μL/30 g mouse). Frozen tissue slices were treated with primary antibodies to neuronal nucleic marker (NeuN) and stained with secondary antibodies conjugated to fluorescent dyes. (J) Representative images (from three mice for each group) of hippocampal regions after ICV administration of Ht-mNG. The bars indicate 500 μm.
Fig. 5.
Fig. 5.
Mechanistic evaluation of the cellular accumulation and uptake of Ht-mNG and FITC-insulin. (A) Schematic illustration of the experimental conditions for examining involvement of energy-dependent endocytosis and specific cell surface receptor. (B) Confocal micrographs of HT22 cells after incubation with Ht-mNG (25 μg/mL) at 37 °C or 4 °C followed by washing with glycine–HCl buffer or PBS. (C) MFI of HT22 cells calculated from flow cytometry after incubation with Ht-mNG at 37 °C or 4 °C or in the presence of excessive concentration of unlabeled insulin (100 μg/mL). (D) MFI of HT22 cells after incubation with FITC-insulin at 37 °C in the presence or absence of unlabeled insulin. (E) Illustration of IR-overexpressing cells for determining the contribution of IR to Ht-fusion proteins. IR was transiently expressed in HT22 cells transfected with the IR-encoding plasmid. In this plasmid, DsRed is tagged at the 3′ end (C terminus) of the IR for detecting IR-overexpressing cells. (F) Dot plot from flow cytometry for gating IR-DsRed-positive and -negative cells. (G and H) MFI from flow cytometry after incubation with Ht-mNG and FITC-insulin, respectively. Fluorescence intensity was compared between DsRed-positive and -negative cells. (I) Confocal micrographs of IR-DsRed-transfected HT22 cells and wild-type (WT) HT22 cells after incubation with Ht-mNG or FITC-insulin. Two micrographs shown for untreated control cells Dulbecco’s modified Eagle medium (DMEM) were taken from the same samples, but detection settings were differently optimized for comparison with mNG and FITC-insulin samples. (J) Schematic illustration of the experiment for evaluating involvement of endocytosis pathways. siRNA was used for knocking down the major protein (dynamin) associated with clathrin-mediated endocytosis, and rottlerin (20 μM) was used for reducing macropinocytosis. (K) Flow cytometric analysis of dynamin-deleted HT22 cells after incubation with Ht-mNG. (L and M) Flow cytometric analysis of rottlerin-treated HT22 cells after incubation with Ht-mNG or FITC-insulin, respectively.
Fig. 6.
Fig. 6.
Determination of important amino acid sequences in insulin and identifying more powerful mutants for delivering protein drugs to hippocampal neurons. (A) List of insulin mutants and their amino acid sequences. M1 and M2 are insulin A mutants, and M3 to M6 are insulin B mutants. M7 and M8 are typical strong CPP (penetratin) and random peptides with 30 amino acids, respectively. M9, M3v2, and M8v2 are additional mutants from original insulin B, M3, and M8, respectively. (B) MFI from flow cytometry of HT22 cells incubated with insulin mutant-mNG for 2 h at 37 °C. (C) Variation in fluorescence intensity of insulin mutant-mNG at the same concentration (10 μg/mL). (D) Comparison of insulin mutant-mNG uptake by NIH3T3, bEnd.3, C6, and HT22 cells with flow cytometry. (E) Comparison of cellular uptake of M3-mNG by HT22 and N2a cells. (F) Western blotting of insulin mutant-mNG. Samples were loaded at 75 ng/mL of purified protein. PVDF membranes were treated with antibodies for mNG. Arrows indicate the molecular weights of original mNG. (G) Binding sensorgrams after insulin mutant-mNG was injected to IR –immobilized flow cell, where specific binding was expressed by subtracting nonspecific binding to blank flow cell from total binding. (H) Uptake by HT22 cells overexpressing IR-DsRed. (I) Concentration dependence of HtB- and M3-mNG on HT22 cell uptake. (J) Uptake of insulin mutant-mNG by HT22 cells at 37 °C and 4 °C. (K) Uptake by HT22 cells treated with rottlerin (20 μM) or unlabeled insulin (100 μg/mL). (L) Representative images (from three mice for each time point) around hippocampal regions at 30 and 60 min after ICV administration of the insulin mutant (M3)-mNG in mice. The slices prepared from frozen brain specimens were stained with primary antibodies against NeuN and secondary antibodies with fluorescent dye (AF647). The bars indicate 500 μm.

Comment in

Similar articles

Cited by

References

    1. Boxer A. L., Sperling R., Accelerating Alzheimer’s therapeutic development: The past and future of clinical trials. Cell 186, 4757–4772 (2023). - PMC - PubMed
    1. van Dyck C. H., et al. , Lecanemab in early Alzheimer’s disease. N. Engl. J. Med. 388, 9–21 (2023). - PubMed
    1. Honig L. S., et al. , ARIA in patients treated with lecanemab (BAN2401) in a phase 2 study in early Alzheimer’s disease. Alzheimers Dement. N9, e12377 (2023). - PMC - PubMed
    1. Mummery C. J., et al. , Tau-targeting antisense oligonucleotide MAPT(Rx) in mild Alzheimer’s disease: A phase 1b, randomized, placebo-controlled trial. Nat. Med. 29, 1437–1447 (2023). - PMC - PubMed
    1. Vogel J. W., et al. , Spread of pathological tau proteins through communicating neurons in human Alzheimer’s disease. Nat. Commun. 11, 2612 (2020). - PMC - PubMed

LinkOut - more resources