. 2024 Oct 8;121(41):e2404841121.
doi: 10.1073/pnas.2404841121. Epub 2024 Sep 30.

TCA metabolism regulates DNA hypermethylation in LPS and Mycobacterium tuberculosis-induced immune tolerance

Affiliations

TCA metabolism regulates DNA hypermethylation in LPS and Mycobacterium tuberculosis-induced immune tolerance

Abhimanyu et al. Proc Natl Acad Sci U S A. .

Abstract

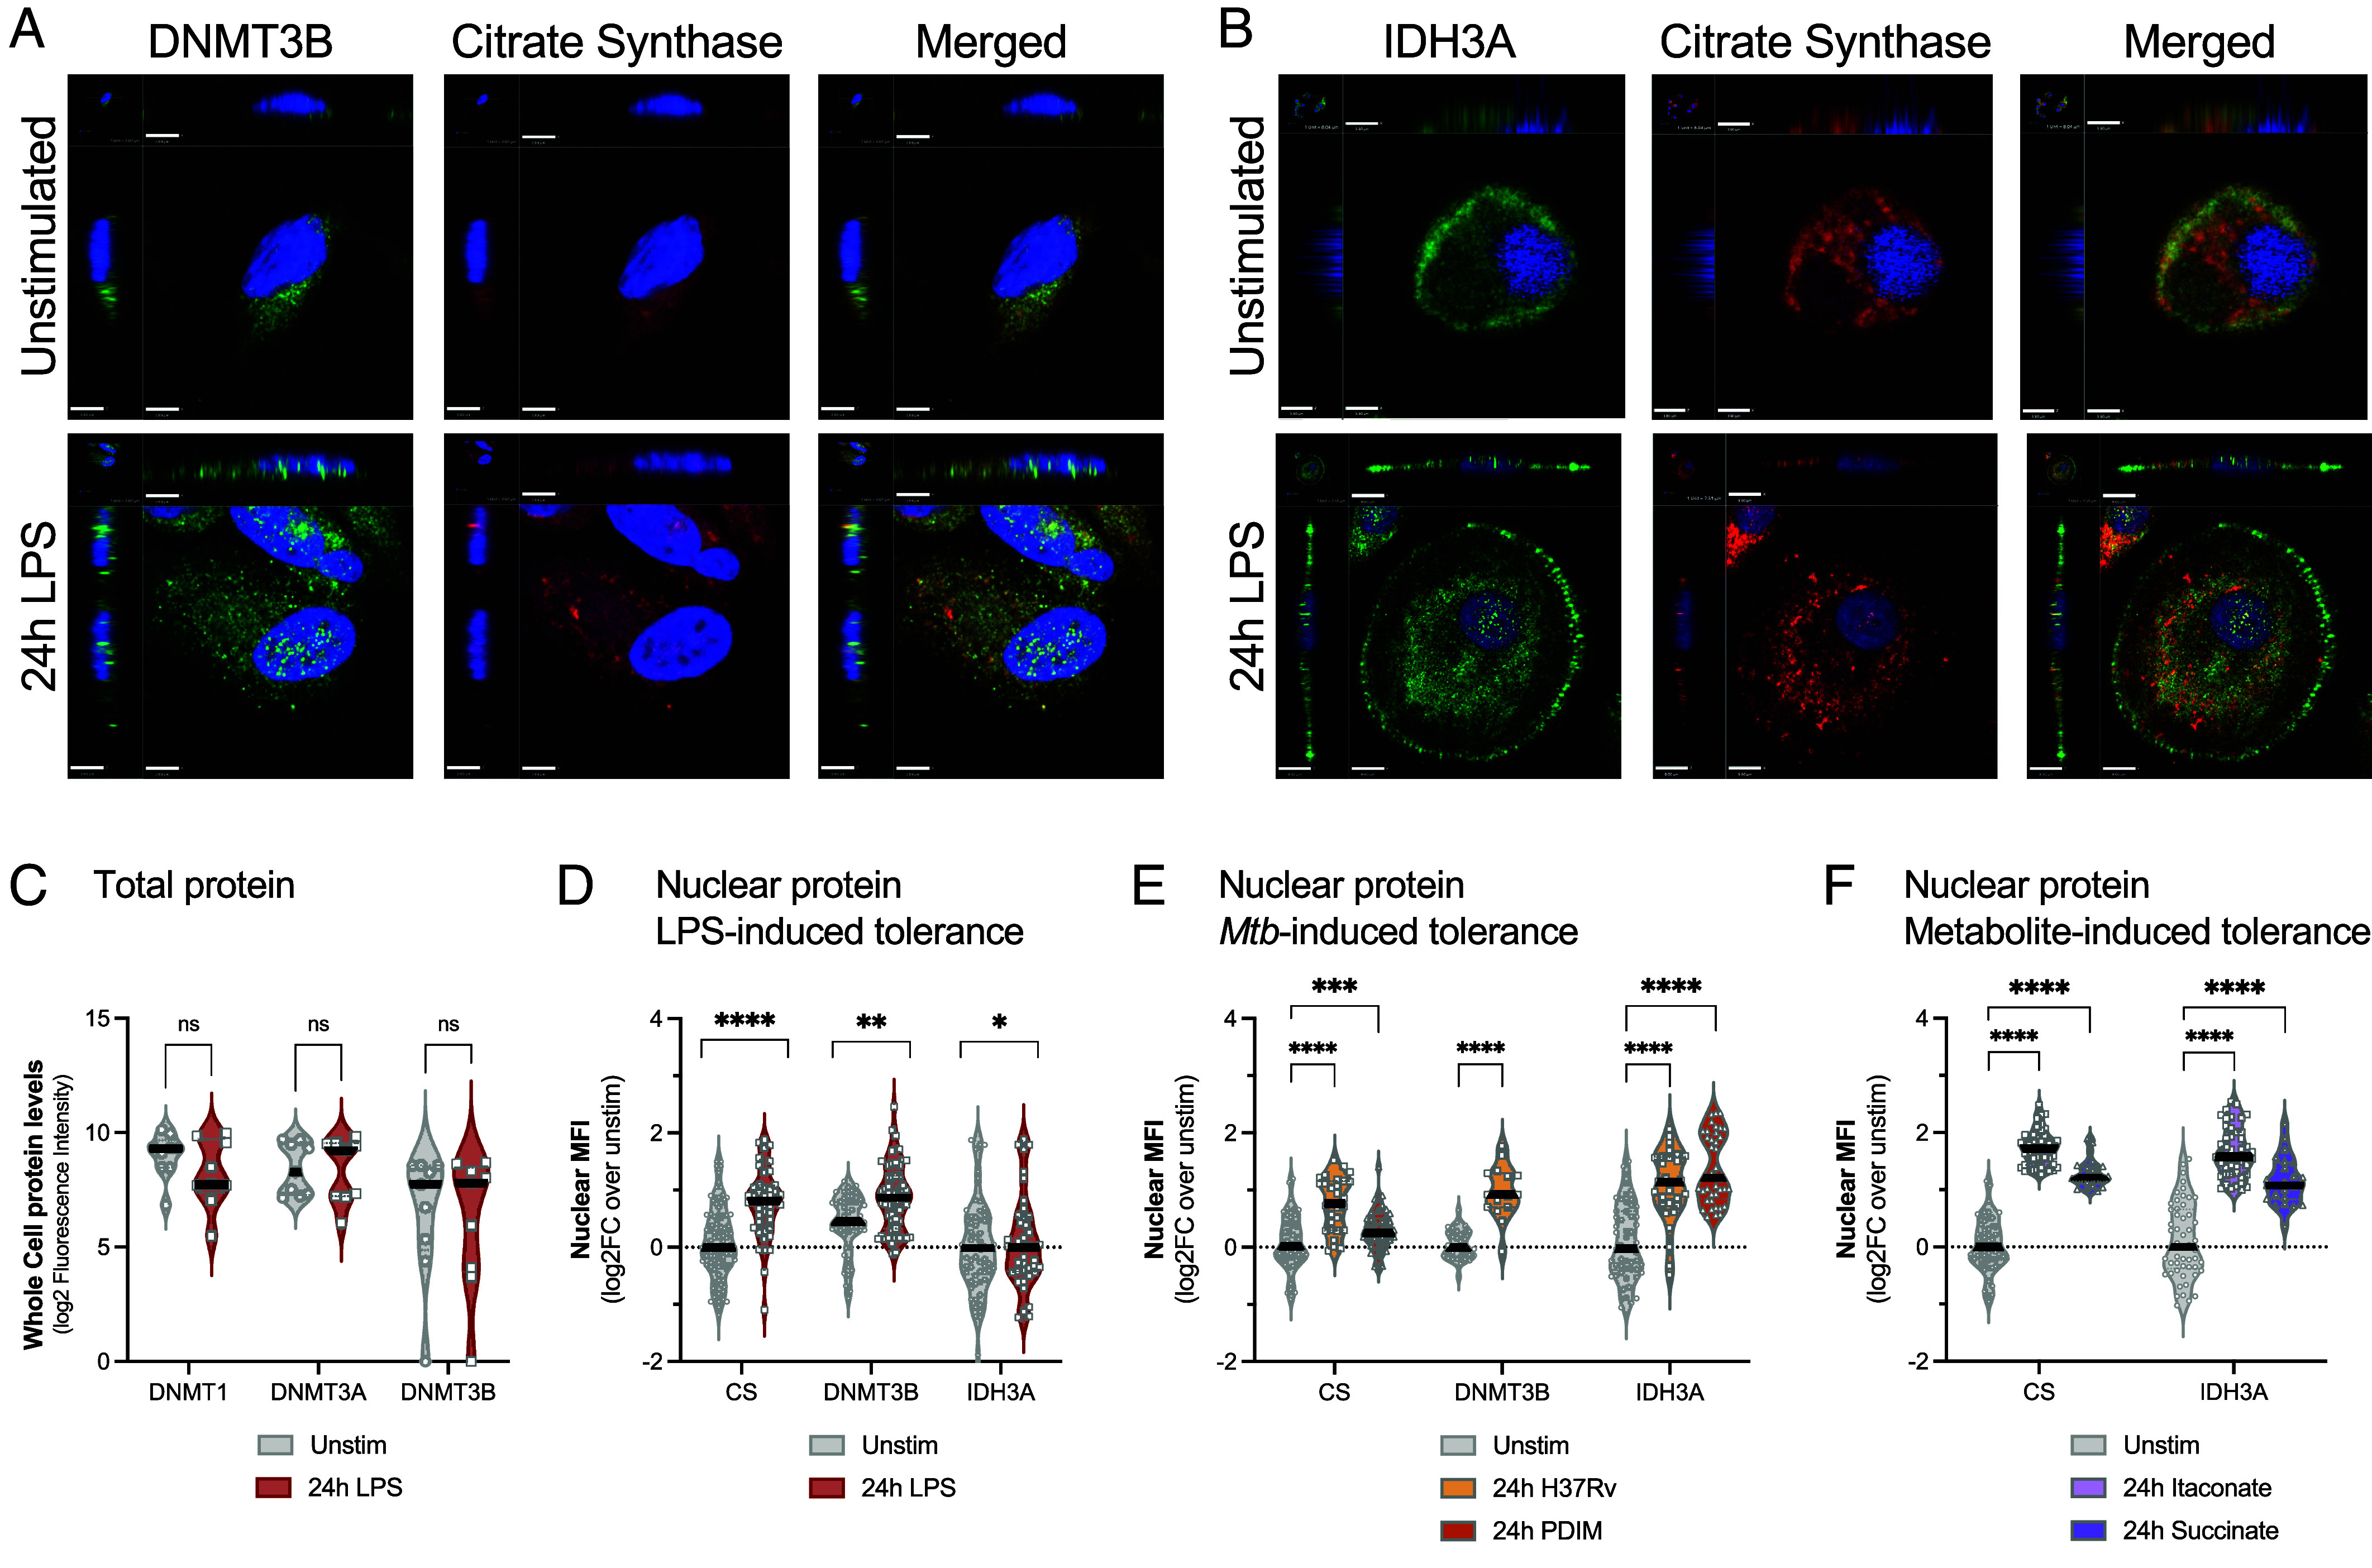
Severe and chronic infections, including pneumonia, sepsis, and tuberculosis (TB), induce long-lasting epigenetic changes that are associated with an increase in all-cause postinfectious morbidity and mortality. Oncology studies identified metabolic drivers of the epigenetic landscape, with the tricarboxylic acid (TCA) cycle acting as a central hub. It is unknown if the TCA cycle also regulates epigenetics, specifically DNA methylation, after infection-induced immune tolerance. The following studies demonstrate that lipopolysaccharide and Mycobacterium tuberculosis induce changes in DNA methylation that are mediated by the TCA cycle. Infection-induced DNA hypermethylation is mitigated by inhibitors of cellular metabolism (rapamycin, everolimus, metformin) and the TCA cycle (isocitrate dehydrogenase inhibitors). Conversely, exogenous supplementation with TCA metabolites (succinate and itaconate) induces DNA hypermethylation and immune tolerance. Finally, TB patients who received everolimus have less DNA hypermethylation demonstrating proof of concept that metabolic manipulation can mitigate epigenetic scars.

Keywords: DNA methylation; Rheostat; immune tolerance; sepsis; tuberculosis.


Conflict of interest statement

Competing interests statement:The authors declare no competing interest.

Figures

Fig. 1.
Fig. 1.
LPS-induced DNA hypermethylation is rescued by TCA inhibitors and recapitulates DNA methylation changes in TB and Sepsis. (A) Schematic of the Tolerance model for assessment of DNA methylation. (B) Heatmap of DNA methylation probes (P < 0.05) induced by LPS at 24 h (first column), LPS at d8 (Second column), itaconate and succinate (third and fourth columns, respectively), or LPS with metformin, everolimus, or GlyNAC (fifth, sixth, and seventh column, respectively). (C) Overrepresentation pathway analysis (ORA) of relevant pathways using GO: BP, Hallmark, Reactome, and KEGG for early (d2) late (d8) and persistent (d2 and d8) hyper- and hypomethylated genes. (D) ORA using Hallmark gene sets with shades of red representing the -log10 P-values from hypermethylated genes and shades of blue representing hypomethylated genes. (E and F) DNA hypermethylation overlap at the gene-level (E) and pathways (F) between LPS, Sepsis, and TB. (G and H) Gene expression overlap at the gene-level (G) and pathways (H) between LPS, Sepsis, and TB. Only relevant and significant P-values, P < 0.05 are reported.
Fig. 2.
Fig. 2.
TCA cycle and DNA methylating enzymes translocate to the nucleus after LPS and Mtb stimulation. (A) Representative confocal images of macrophages stimulated with or without LPS for 24 h. Antibody staining for DNMT3B (green) or citrate synthase (red). Nuclei counterstained with DAPI (blue). The Upper Right quadrant demonstrates the x-axis cross-section of the cell, and the Lower Left quadrant shows the z-axis cross-section of cell, to better visualize nuclear staining. Scale bars equal 3.80 µm for the x-axis and 1 unit = 3.07 µm for z-stacks. (B) Representative confocal images for IDH3A (green) or citrate synthase (red) and with nuclei counterstained with DAPI (blue). Scale bars equal 9 µm for the x-axis and 1 unit = 7.51 µm for z-stacks. (C) Quantitation of total protein levels of DNMT1, DNMT3A, or DNMT3B as measured by total cellular fluorescent intensity, n = 9 per group. (D) Quantitation of nuclear median fluorescent intensity (MFI) for DNMT3B, IDH3A, and citrate synthase with and without LPS stimulation, n = 19 to 32 cells per group including 3 to 6 biologic replicates per experiment. Median values with the quartiles are plotted as log2FC over unstimulated. (E) Quantitation of nuclear MFI for citrate synthase, DNMT3B, and IDH3A for Mtb stimulations (H37Rv total lipids and PDIM), n = 48 to 80 cells per group was quantified from three biologic replicates. Median values with the quartiles are plotted as log2FC over unstimulated. (F) Nuclear MFI after treatment with itaconate or succinate; n = 48 to 80 cells was quantified from three biologic replicates. Median values with the quartiles are plotted as log2FC over unstimulated. The treatments were compared to unstimulated using a Mann–Whitney test, with significant P values shown (*P < 0.05, **P < 0.01, ****P < 0.0001, ns; not significant).
Fig. 3.
Fig. 3.
Immune tolerance can be induced by LPS, Mtb, or TCA cycle metabolites and rescued by TCA inhibitors. (A) Overview of the TCA (dotted line box). The drug targets are highlighted with enclosed blue shapes. (B) Schematic of the experimental design, conditions, and definitions used. LPS, Mtb, and metabolite treatment of MDMΦ was carried out with and without pretreatment with the inhibitors; d0: day 0. Functional (gray), LPS-induced tolerant (Tol) (red), Mtb-tolerant (orange), metabolite-tolerant (purple), and with drugs (blue) state of the MDMΦ are indicated. (C) Violin plots demonstrating IL-6 levels under LPS-tolerant (Tol) conditions with or without rapamycin (Rapa) and everolimus (Evero) (Left), metformin (Met) and BAY1436032 (BAY) (Central) and equimolar glycine-N-acetyl cysteine (GlyNAC; GNAC) and lycopene (Lyco) (Right). Median and quartiles are plotted for each graph. (D) Violin plots demonstrating Mtb-induced tolerance using both PDIM and H37Rv total lipids with and without metformin. For Mtb rescue both PDIM- and H37Rv-induced tolerance are plotted together. The groups were compared using Two-way ANOVA with Dunnett’s correction for multiple testing (E), and with Fisher’s LSD. The compared groups are indicated with the overhead bars and were computed using a two-tailed Mann–Whitney test. (E and F) Bar graphs demonstrating IL-6 quantification under different concentrations of itaconic acid and dimethyl succinate. All data are plotted as log2-fold change in the stimulation over the unstimulated. Each dot represents a different biologic replicate. The groups were compared using Two-way ANOVA with Dunnett’s correction for multiple testing (E), and with Fisher’s LSD (F). Significant p-values are reported. *P < 0.05, **P < 0.01, ***P < 0.001, ****P < 0.0001. Abbreviations: Func: Functional; Tol: tolerant; TCA; Tricarboxylic acid cycle, Stim: Stimulation, SDH; Succinate dehydrogenase, FH; Fumarate hydratase, CS: Citrate synthase, ACO2: Aconitase, PDHA: Pyruvate Dehydrogenase, AMPK: AMP-activated protein kinase, mTOR: Mammalian target of Rapamycin, MDH2: Malate dehydrogenase, GLS: Glutaminase, IDH3A/B; Isocitrate Dehydrogenase, a-KG: Alpha keto glutarate, OGDH: Oxo-glutarate dehydrogenase; ROS: Reactive oxygen species, LSD: Least significant difference, mM: Micromolar, mM: Millimolar.
Fig. 4.
Fig. 4.
DNA hypermethylation induced by TB disease is rescued by adjunctive Everolimus treatment with anti-TB therapy. (A) Study design and the time-point for DNA methylation analysis in the TB cohort from South Africa. TB patients were treated with SOC anti-TB Therapy with or without Everolimus (Evero). DNA methylation was evaluated from cryopreserved PBMCs at the end of TB treatment (day 180). (B) Comparison of everolimus-induced DNA hypomethylation between TB patients and the everolimus rescued DNA hypomethylation in the LPS-induced MDMΦ model. Comparison was made between both PBMCs and EDEC CD14+ monocytes. (C) Common 881 hypomethylated genes and their log2FC plotted as compared to everolimus nontreated TB patient participants demonstrating everolimus-induced DNA hypomethylation. The colors blue (Hypo, reduced) and Red (hyper, increased) represent relative log2fold methylation changes. MDMΦ (for consistency, it needs correction in the figure also): Monocyte-macrophages (D) Overrepresentation pathway analysis of Hallmark genes, with the P-value demonstrating the direction with red (hyper) or blue (Hypo) significantly enriched pathways.

Comment in

References

    1. Dinardo A., et al. , DNA hyper-methylation during Tuberculosis dampens host immune responsiveness. J. Clin. Invest. 130, 3113–3123 (2020). - PMC - PubMed
    1. Waitt C. J., et al. , Monocyte unresponsiveness and impaired IL1beta, TNFalpha and IL7 production are associated with a poor outcome in Malawian adults with pulmonary tuberculosis. BMC Infect. Dis. 15, 513 (2015). - PMC - PubMed
    1. Divangahi M., Khan N., Kaufmann E., Beyond killing Mycobacterium tuberculosis: Disease tolerance. Front. Immunol. 9, 2976 (2018). - PMC - PubMed
    1. Hmama Z., Pena-Diaz S., Joseph S., Av-Gay Y., Immunoevasion and immunosuppression of the macrophage by Mycobacterium tuberculosis. Immunol. Rev. 264, 220–232 (2015). - PubMed
    1. Sahiratmadja E., et al. , Dynamic changes in pro- and anti-inflammatory cytokine profiles and gamma interferon receptor signaling integrity correlate with tuberculosis disease activity and response to curative treatment. Infect. Immunity 75, 820–829 (2007). - PMC - PubMed

Grants and funding