

Assessing the built environment through photographs and its association with obesity in 21 countries: the PURE Study
- PMID: 39348833
- PMCID: PMC11483223
- DOI: 10.1016/S2214-109X(24)00287-0
Assessing the built environment through photographs and its association with obesity in 21 countries: the PURE Study
Erratum in
-
Correction to Lancet Glob Health 2024; 12: e1794-806.Lancet Glob Health. 2024 Nov;12(11):e1763. doi: 10.1016/S2214-109X(24)00426-1. Lancet Glob Health. 2024. PMID: 39424568 Free PMC article. No abstract available.
Abstract
Background: The built environment can influence human health, but the available evidence is modest and almost entirely from urban communities in high-income countries. Here we aimed to analyse built environment characteristics and their associations with obesity in urban and rural communities in 21 countries at different development levels participating in the Prospective Urban and Rural Epidemiology (PURE) Study.
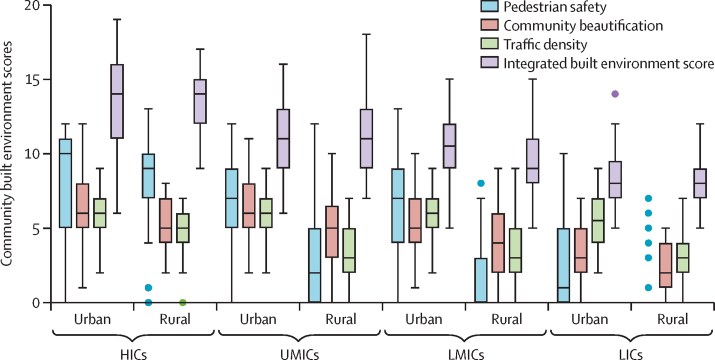
Methods: Photographs were acquired with a standardised approach. We used the previously validated Environmental Profile of a Community's Health photo instrument to evaluate photos for safety, walkability, neighbourhood beautification, and community disorder. An integrated built environment score (ie, a minimum of 0 and a maximum of 20) was used to summarise this evaluation across built environment domains. Associations between built environment characteristics, separately and combined in the integrated built environment score, and obesity (ie, a BMI >30kg/m2) were assessed using multilevel regression models, adjusting for individual, household, and community confounding factors. Attenuation in the associations due to walking was examined.
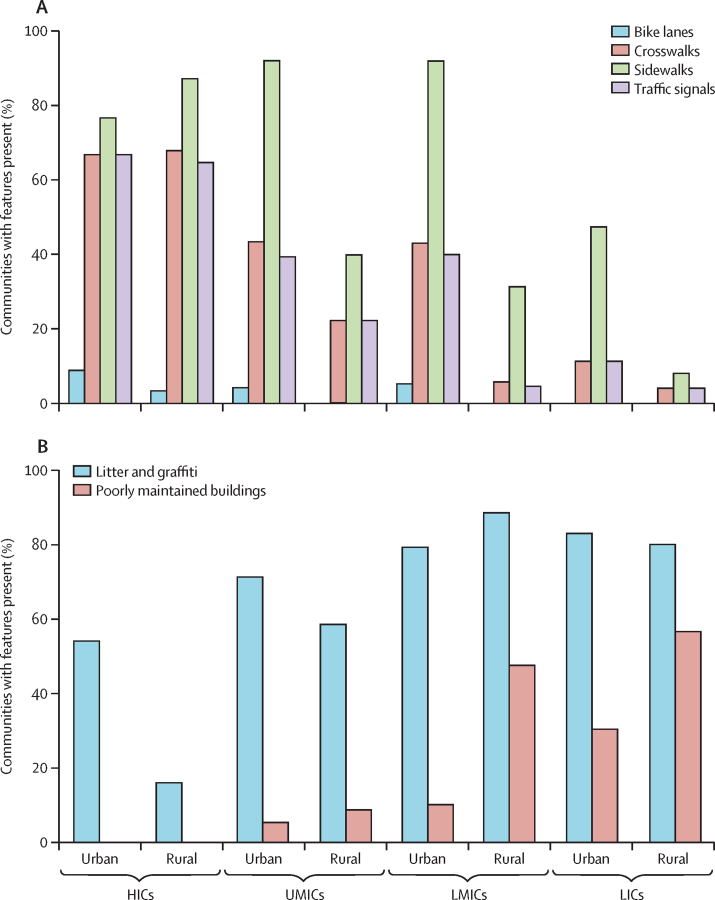
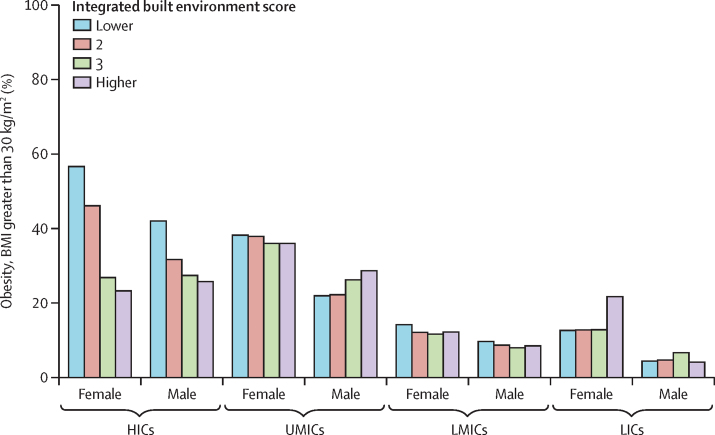
Findings: Analyses include 143 338 participants from 530 communities. The mean integrated built environment score was higher in high-income countries (13·3, SD 2·8) compared with other regions (10·1, 2·5) and urban communities (11·2, 3·0). More than 60% of high-income country communities had pedestrian safety features (eg, crosswalks, sidewalks, and traffic signals). Urban communities outside high-income countries had higher rates of sidewalks (176 [84%] of 209) than rural communities (59 [28%] of 209). 15 (5%) of 290 urban communities had bike lanes. Litter and graffiti were present in 372 (70%) of 530 communities, and poorly maintained buildings were present in 103 (19%) of 530. The integrated built environment score was significantly associated with reduced obesity overall (relative risk [RR] 0·58, 95% CI 0·35-0·93; p=0·025) for high compared with low scores and for increasing trend (0·85, 0·78-0·91; p<0·0001). The trends were statistically significant in urban (0·85, 0·77-0·93; p=0·0007) and rural (0·87, 0·78-0·97; p=0·015) communities. Some built environment features were associated with a lower prevalence of obesity: community beautification RR 0·75 (95% CI 0·61-0·92; p=0·0066); bike lanes RR 0·58 (0·45-0·73; p<0·0001); pedestrian safety RR 0·75 (0·62-0·90; p=0·0018); and traffic signals RR 0·68 (0·52-0·89; p=0·0055). Community disorder was associated with a higher prevalence of obesity (RR 1·48, 95% CI 1·17-1·86; p=0·0010).
Interpretation: Community built environment features recorded in photographs, including bike lanes, pedestrian safety measures, beautification, traffic density, and disorder, were related to obesity after adjusting for confounders, and stronger associations were found in urban than rural communities. The method presents a novel way of assessing the built environment's potential effect on health.
Funding: Population Health Research Institute, Hamilton Health Sciences Research Institute, Heart and Stroke Foundation of Ontario, Canadian Institutes of Health Research's Strategy for Patient Oriented Research, Ontario Support Unit, Ontario Ministry of Health and Long-Term Care, AstraZeneca, Sanofi-Aventis, Boehringer Ingelheim, Servier, and GlaxoSmithKline.
Copyright © 2024 The Author(s). Published by Elsevier Ltd. This is an Open Access article under the CC BY 4.0 license. Published by Elsevier Ltd.. All rights reserved.
Conflict of interest statement
Declaration of interests CKC is supported by a National Health and Medical Research Council of Australia Investigator grant (APP1195326). AR declares institutional support from the Swedish Research Council, the Swedish Heart and Lung Foundation, and grants from the Swedish state under the agreement concerning research and the education of doctors. LMP-V declares a research grant from the Philippine Council for Health Research and Development, Department of Science and Technology. PH declares institutional grants from the US National Institute of Environmental Health Sciences (R21ES031226) and the National Heart, Lung, and Blood Institute (R01HL50119). All other authors declare no competing interests.
Figures
References
-
- Chandrabose M, Rachele JN, Gunn L, et al. Built environment and cardio-metabolic health: systematic review and meta-analysis of longitudinal studies. Obes Rev. 2019;20:41–54. - PubMed
-
- Creatore MI, Glazier RH, Moineddin R, et al. Association of neighborhood walkability with change in overweight, obesity, and diabetes. JAMA. 2016;315:2211–2220. - PubMed
MeSH terms
LinkOut - more resources
Full Text Sources
Medical
