. 2025 Feb 6;74(3):451-466.
doi: 10.1136/gutjnl-2024-332837.

Spatial single-cell profiling and neighbourhood analysis reveal the determinants of immune architecture connected to checkpoint inhibitor therapy outcome in hepatocellular carcinoma

Affiliations

Spatial single-cell profiling and neighbourhood analysis reveal the determinants of immune architecture connected to checkpoint inhibitor therapy outcome in hepatocellular carcinoma

Henrike Salié et al. Gut. .

Abstract

Background: The determinants of the response to checkpoint immunotherapy in hepatocellular carcinoma (HCC) remain poorly understood. The organisation of the immune response in the tumour microenvironment (TME) is expected to govern immunotherapy outcomes but spatial immunotypes remain poorly defined.

Objective: We hypothesised that the deconvolution of spatial immune network architectures could identify clinically relevant immunotypes in HCC.

Design: We conducted highly multiplexed imaging mass cytometry on HCC tissues from 101 patients. We performed in-depth spatial single-cell analysis in a discovery and validation cohort to deconvolute the determinants of the heterogeneity of HCC immune architecture and develop a spatial immune classification that was tested for the prediction of immune checkpoint inhibitor (ICI) therapy.

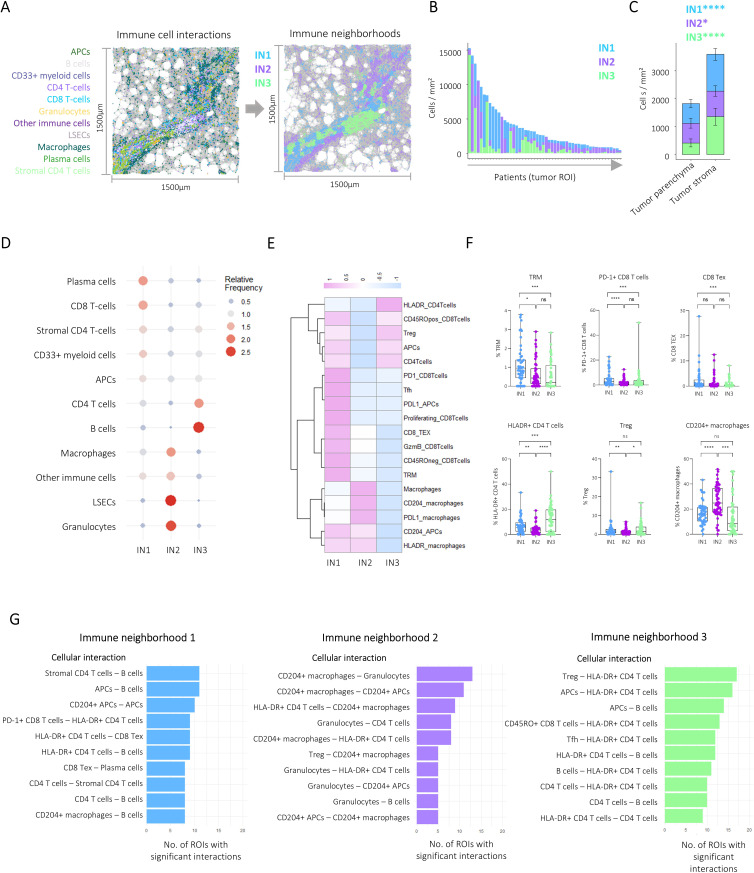
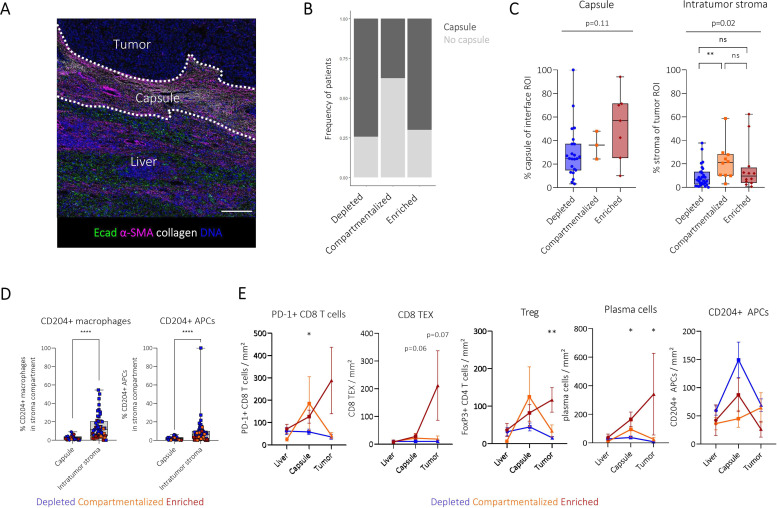
Results: Bioinformatic analysis identified 23 major immune, stroma, parenchymal and tumour cell types in the HCC TME. Unsupervised neighbourhood detection based on the spatial interaction of immune cells identified three immune architectures with differing involvement of immune cells and immune checkpoints dominated by either CD8 T-cells, myeloid immune cells or B- and CD4 T-cells. We used these to define three major spatial HCC immunotypes that reflect a higher level of intratumour immune cell organisation: depleted, compartmentalised and enriched. Progression-free survival under ICI therapy differed significantly between the spatial immune types with improved survival of enriched patients. In patients with intratumour heterogeneity, the presence of one enriched area governed long-term survival.

Keywords: CANCER IMMUNOBIOLOGY; HEPATOCELLULAR CARCINOMA; IMAGE ANALYSIS; IMMUNOTHERAPY; LIVER IMMUNOLOGY.


Conflict of interest statement

Competing interests: None declared.

Figures

Figure 1
Figure 1. Imaging mass cytometry of the hepatocellular carcinoma tumour microenvironment. (A) Workflow illustrating IMC data preparation and analysis steps. (B) Example H&E (left) and respective IMC composite image (right) from one HCC patient. Scale bars indicate 200 µm (C) Example composite images visualising key cellular components of the HCC TME. Scale bars indicate 50 µm. (D) Heatmap visualising mean marker expression of detected cell types after channel normalisation and PhenoGraph clustering. (E) Cell types on example HCC image. (F) UMAP representation coloured by detected immune cell types. (G) Amount and distribution of immune cell types in the tumour ROI from each patient. (H) Stacked bar plots visualising mean immune cell type densities in the tumour parenchyma compared with intratumour stroma. Error bars indicate SE. Significant differences were determined by paired Wilcoxon tests and Bonferroni corrected for multiple comparisons. ns, not significant, **p<0.01, ***p<0.001, ****p<0.0001. FFPE, formalin-fixed paraffine-embedded; HCC, hepatocellular carcinoma; IMC, imaging mass cytometry; ROI, regions of interest; TME, tumour microenvironment.
Figure 2
Figure 2. Spatial profiling of the hepatocellular carcinoma tumour immune microenvironment reveals distinct immune networks. (A) Immune cell type interactions (left image) were used to cluster immune cells into three immune neighbourhoods (right image). (B) Stacked bar plots visualising mean immune neighbourhood composition of each patient. (C) Stacked bar plots visualising mean immune neighbourhood composition per intratumour compartment. Error bars indicate SE of the mean. Wilcoxon tests were used to assess statistical significance. (D) Bubble heatmap illustrating the relative frequency of immune cell types in detected immune neighbourhoods. (E) Heatmap visualising z-scored frequency of gated immune subsets. (F) Boxplots comparing gated immune subset frequencies between immune neighbourhoods. Pairwise comparisons were performed using Wilcoxon tests and Bonferroni corrected for multiple comparisons. (G) Pairwise immune subset interactions were calculated for each immune neighbourhood separately. Bar plots show the 10 most frequent significant immune cell interactions. *p<0.05, **p<0.01, ***p<0.001, ****p<0.0001. APCs, antigen-presenting cells; CD8 Tex, exhausted CD8 T cells; ns, not significant; ROI, region of interest; Treg, regulatory T cells; TRM, tissue-resident memory T cells.
Figure 3
Figure 3. The amount and distribution of CD8 T cells define HCC spatial immune types with distinct immune microenvironments. (A) Pearson correlation of IN1 cell and CD8 T cell densities. Each dot represents one patient’s tumour ROI. Dot size indicates the percentage covered by stroma. (B) Principal component analysis based on IN density. Each dot represents one patient’s tumour ROI. Dot size indicates the percentage covered by stroma and colour the overall CD8 T cell density. Arrows visualise contribution of each parameter to principal components 1 and 2. (C) Boxplot showing CD8 T cell density in the tumour parenchyma and stroma (left) and the ratio of parenchymal to stromal CD8 T cell density. Dots represent patients and are coloured by spatial immunotype. (D) Schematic visualisation of patient classification into spatial immunotypes based on intratumoural CD8 T cell infiltration and distribution. (E) Boxplots showing the comparison of overall (top left), parenchymal (bottom left), stromal (bottom right) and the ratio between parenchymal and stromal CD8 T cell density (top right) between spatial immunotypes. (F) Stacked bar plots visualising mean immune cell type composition in the tumour parenchyma (left) and tumour stroma (right) of spatial immunotypes. Error bars indicate SE. Comparisons were performed using Kruskal-Wallis tests and Bonferroni corrected for multiple comparisons. (G) Boxplots showing immune subset densities in the tumour parenchyma (top) and stroma (bottom) between spatial immune types. Each dot represents a patient, pairwise tests were performed using Mann-Whitney U tests and Bonferroni corrected for multiple comparisons. (H) Example images showing cells coloured by immune neighbourhoods with their interactions (grey lines) for a depleted (top left), compartmentalised (top right) and enriched (bottom left) patient. Stacked bar plots showing mean immune neighbourhood density with error bars for each spatial immune type. Error bars indicate SE. Immune neighbourhood frequencies were compared using Kruskal-Wallis tests and Bonferroni corrected for multiple comparisons. ns, not significant, *p<0.05, **p<0.01, ***p<0.001, ****p<0.0001. HCC, hepatocellular carcinoma; IN, immune neighbourhood; ROI, region of interest.
Figure 4
Figure 4. Deep spatial profiling of the HCC tumour interface. (A) Example image visualising interface compartments: adjacent liver, stroma capsule and tumour. Scale bar indicates 200 µm. (B) Stacked bar plot indicating the frequency of patients with tumour capsule formation between spatial immune types. (C) Boxplot comparing percentage of pixels belonging to the capsule in the interface ROI (left) and intratumour stroma of the tumour ROI (right) inferred by interface and stroma maps, respectively. (D) Frequency of CD204+ macrophages and APCs compared between the capsule and intratumour stroma. Each dot represents a patient and is coloured by spatial immune type. (E) Connected dot plots visualising mean and SE of respective immune subset densities for each spatial immunotype. Kruskal-Wallis tests were used to test for significant differences between spatial immune types within each interface compartment. *p<0.05, **p<0.01, ****p<0.0001. APC, antigen-presenting cell; HCC, hepatocellular carcinoma; ns, not significant; ROI, region of interest.
Figure 5
Figure 5. Tumour molecular profiles and underlying HCC aetiology do not dictate immune organisation in the HCC TME. (A) Heatmap showing frequent molecular alterations assessed by the TSO-500 panel of each patient. Annotations are based on clinical and immune features. (B) Stacked bar plots visualising the number of patients belonging to each spatial immune type of the patients with the indicated mutations. (C) Boxplots comparing the density of IN1 cells between patients with and without respective mutations. Statistical significance was assessed by Mann-Whitney tests. (D) Stacked bar plot showing the relative frequency of tumour grades G1–3 within each spatial immune type. (E) Boxplot comparing the density of Ki-67+ tumour cells between spatial immune types. Pairwise statistical differences were assessed by Mann-Whitney U tests. (F) Boxplots comparing total tumour mutational burden (TMB) between spatial immune types. P value was inferred by Kruskal-Wallis test. (G) Stacked bar plot comparing immunotype contribution to patients with and without pathologically defined cirrhosis in the surrounding liver tissue. χ2 test was applied to assess statistical significance. (H) Stacked bar plots showing the contribution of spatial immune types to patients grouped by underlying liver disease. χ2 test was applied to assess statistical significance. (I) Stacked bar plots visualising mean cell type densities in the tumour parenchyma (left) and stroma (right) between patients with differing HCC aetiologies. Error bars indicate SE. Kruskal-Wallis tests were used to test for overall significant differences. Mann-Whitney U tests were used to assess pairwise statistical differences and p values were Bonferroni-corrected for multiple comparisons. (J) Stacked barplots visualising mean immune neighbourhood densities in the tumour ROIs of patients with differing HCC aetiologies. Error bars indicate SE. Kruskal-Wallis tests were used to test for overall significant differences. Mann-Whitney U tests were used to assess pairwise statistical differences and p values were Bonferroni-corrected for multiple comparisons. *p<0.05. ALD, alcohol-related liver disease; HBV, hepatitis B virus; HCC, hepatocellular carcinoma; HCV, hepatitis C virus; ROI, region of interest; SLD, steatotic liver disease; TME, tumour microenvironment.
Figure 6
Figure 6. Validation of the immune network analysis and spatial immune classification in an independent cohort. (A) Illustration of the workflow used to assess the connection of spatial immune types and response to ICI-based therapy in HCC patients. (B) Identified cell types visualised in one HCC patient from the validation cohort. (C) Pie chart showing the number of patients belonging to each spatial immune type in the ICI cohort. (D) Boxplots comparing CD8 T cell infiltration patterns in microanatomical compartments between spatial immune types. (E) Stacked bar plots visualising mean immune cell type composition in the tumour parenchyma (left) and stroma (right) of spatial immune types. Error bars indicate SE. Comparisons were performed using Kruskal-Wallis tests and Bonferroni corrected for multiple comparisons. (F) Example images of immune neighbourhoods in a depleted (left), compartmentalised (middle) and enriched (right) patient. Stacked bar plots visualising mean immune neighbourhood density of spatial immune types. Error bars indicate SE. Comparisons were performed on IN frequencies using Kruskal-Wallis tests and Bonferroni corrected for multiple comparisons. (G) Plot visualising the number of patients with and without intratumour heterogeneity (inner pie chart) and the contribution of spatial immunotypes (outer donut chart) if two or more ROIs were acquired from patients of the discovery and validation cohort together. *p<0.05, **p<0.01, ***p<0.001, ****p<0.0001. HCC, hepatocellular carcinoma; ICI, immune checkpoint inhibitor; ns, not significant; ROIs, regions of interest.
Figure 7
Figure 7. The spatial immune architecture of HCC patients correlates with immune checkpoint inhibitor therapy outcome. (A) Patients are grouped by best response assessed by RECIST V.1.1 into partial response (PR), stable disease (SD) and progressive disease (PD). Stacked bar plots show contribution of spatial immune types. (B) Kaplan-Meier curves of progression-free survival (PFS) of patients belonging to spatial immune type groups. Statistical significance was assessed by log-rank test for trend. (C) Kaplan-Meier survival curve comparing PFS of spatial immunotypes if patients were assigned the highest immunotype present in at least one ROI. Log-rank test for trend was used to assess statistical significance. (D) Left: Boxplot showing CD8 TEX density in enriched patients. Each dot represents a patient and is coloured by CD8 TEX density above or below the median. Right: Kaplan-Meier curves comparing PFS of CD8 TEX high and low patients. Log-rank test was used to assess statistical significance. (E) ROC curves comparing the sensitivity and specificity for the prediction of 8 months PFS of immune neighbourhood densities. (F) Kaplan-Meier curves comparing PFS of IN1 high (>200 cells/mm²) and low (<200 cells/mm²) patients. Log-rank test was used to assess statistical significance. (G) Left: Boxplot showing IN1 density in compartmentalised patients. Each dot represents a patient and is coloured by IN1 density above or below 200 cells/mm². Right: Kaplan-Meier curves comparing PFS of compartmentalised patients with IN1 high and low density. Log-rank test was used to assess statistical significance. *p<0.05, **p<0.01. AUC, area under the curve; ns, not significant; RC, receiver operaror characteristic; ROI, region of interest.

References

    1. Mellman I, Chen DS, Powles T, et al. The cancer-immunity cycle: Indication, genotype, and immunotype. Immunity. 2023;56:2188–205. doi: 10.1016/j.immuni.2023.09.011. - DOI - PubMed
    1. Sung H, Ferlay J, Siegel RL, et al. Global Cancer Statistics 2020: GLOBOCAN Estimates of Incidence and Mortality Worldwide for 36 Cancers in 185 Countries. CA Cancer J Clin. 2021;71:209–49. doi: 10.3322/caac.21660. - DOI - PubMed
    1. Reig M, Forner A, Rimola J, et al. BCLC strategy for prognosis prediction and treatment recommendation: The 2022 update. J Hepatol. 2022;76:681–93. doi: 10.1016/j.jhep.2021.11.018. - DOI - PMC - PubMed
    1. Ducreux M, Abou-Alfa GK, Bekaii-Saab T, et al. The management of hepatocellular carcinoma. Current expert opinion and recommendations derived from the 24th ESMO/World Congress on Gastrointestinal Cancer, Barcelona, 2022. ESMO Open. 2023;8:101567. doi: 10.1016/j.esmoop.2023.101567. - DOI - PMC - PubMed
    1. Finn RS, Qin S, Ikeda M, et al. Atezolizumab plus Bevacizumab in Unresectable Hepatocellular Carcinoma. N Engl J Med. 2020;382:1894–905. doi: 10.1056/NEJMoa1915745. - DOI - PubMed

Substances