. 2025;19(1):101412.
doi: 10.1016/j.jcmgh.2024.101412. Epub 2024 Sep 28.

Intrahepatic Exhausted Antiviral Immunity in an Immunocompetent Mouse Model of Chronic Hepatitis B

Affiliations

Intrahepatic Exhausted Antiviral Immunity in an Immunocompetent Mouse Model of Chronic Hepatitis B

Satoshi Shigeno et al. Cell Mol Gastroenterol Hepatol. 2025.

Abstract

Background & aims: Targeting exhausted immune systems would be a promising therapeutic strategy to achieve a functional cure for HBV infection in patients with chronic hepatitis B (CHB). However, animal models recapitulating the immunokinetics of CHB are very limited. We aimed to develop an immunocompetent mouse model of CHB for intrahepatic immune profiling.

Methods: CHB mice were created by intrahepatic delivery of the Sleeping Beauty transposon vector tandemly expressing the hepatitis B virus (HBV) genome and fumarylacetoacetate hydrolase (FAH) cDNA into C57BL/6J congenic FAH knockout mice via hydrodynamic tail vein injection. We profiled the viral and intrahepatic immune kinetics in CHB mice with or without treatment with recombinant IFNα or the hepatotropic Toll-like receptor 7 agonist SA-5 using single-cell RNA-seq.

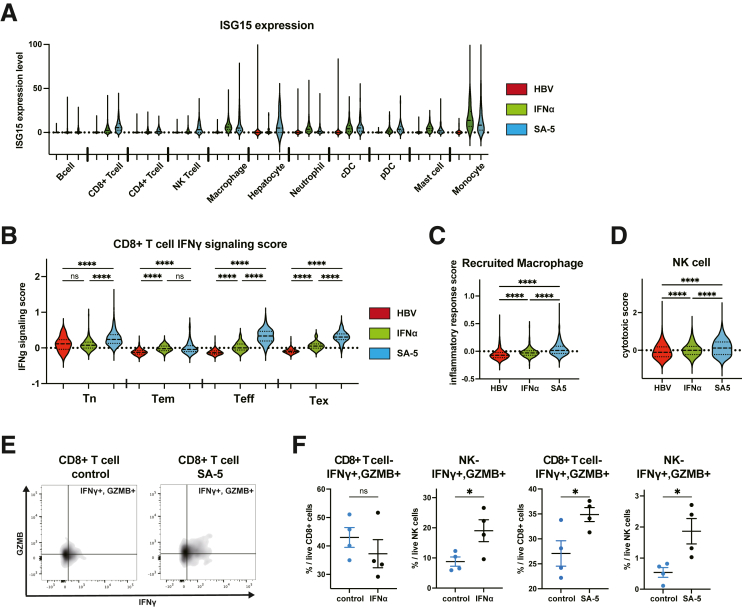
Results: CHB mice exhibited sustained HBV viremia and persistent hepatitis. They showed intrahepatic expansion of exhausted CD8+ T (Tex) cells, the frequency of which was positively associated with viral load. Recruited macrophages increased in number but impaired inflammatory responses in the liver. The cytotoxicity of mature natural killer (NK) cells also increased in CHB mice. IFNα and SA-5 treatment both resulted in viral suppression with mild hepatic flares in CHB mice. Although both treatments activated NK cells, SA-5 had the capacity to revitalize the impaired function of Tex cells and liver-recruited macrophages.

Conclusions: Our novel CHB mouse model recapitulated the intrahepatic exhausted antiviral immunity in patients with CHB, which might be able to be reinvigorated by a hepatotropic TLR7 agonist.

Keywords: Chronic Hepatitis B; HBV; Immunocompetent; Mouse Model.


Figures

None
Graphical abstract
Figure 1
Figure 1
Intrahepatic delivery of a transposon-based tandem HBV and FAH expressing vector in the FAH-KO mice recapitulates the immune active phase of CHB. (A) Design of each HBV vector. Either the 1.24-mer overall length of the HBV genome or CMV promoter-driven FAH cDNA or both were cloned into a single SB transposon vector. (B) Experimental scheme including FAH-KO mice with HBV-FAH and without NTBC (upper left), FAH-KO mice with HBV-FAH and with NTBC (lower left), FAH-KO mice with HBV and without NTBC (upper middle), wild-type mice with HBV-FAH (lower middle), and FAH-KO mice with FAH and without NTBC (upper right) (n = 3–5 mice per group). (C) Body weight of mice after HTVi. (D–F) Serum HBsAg (D), HBV DNA (E), and HBeAg (F) levels after HTVi. (G) Immunohistochemical staining for HBs antigen in the liver, bowel, spleen, lung, and heart tissues of the FAH-KO mice with HBV-FAH and without NTBC. (H) Immunohistochemical staining for FAH in the liver of the FAH-KO mice with HBV-FAH and without NTBC. (I) The positive area of FAH in the liver of the FAH-KO mice with HBV-FAH and without NTBC. (J) The median copy number of transposon integrated into the hepatocytes. (K) FAH mRNA levels in the liver of the FAH-KO mice with HBV-FAH and without NTBC at 18 or 30 weeks of age. (L) pgRNA copies in hepatocytes. (M) Immunohistochemical staining for FAH and HBs antigen in liver tissues. (N) Serum ALT levels after HTVi. (O) H&E staining of liver sections. The white arrow indicates inflammatory cells. (P) Number of inflammatory cells detected by H&E staining. (Q) The ISHAK histopathological inflammatory score assessed by H&E staining. (R) TUNEL-positive cells in TUNEL staining of liver sections. (S) Serum caspase-3/7 activity. AU, Arbitrary unit. ∗P < .05; ∗∗P < .01; ∗∗∗P < .001.
Figure 2
Figure 2
Single-cell atlas of intrahepatic immune cells and the exhaustion of CD8+ T cells in CHB mice. (A–J) Hepatic immune cells from CHB mice and control mice at 8 weeks post-HTVi were analyzed by scRNA-seq (n = 6 for CHB mice and n = 4 for control mice). (A) A total of 24,423 cells were classified into 33 clusters described by UMAP that could be unified into 11 major clusters. (B) Heatmap showing the expression levels of representative genes for each cell type. (C) The population of each major cluster. (D–E) Four CD8+ T cell subsets in UMAP (D) were defined by indicated marker gene expression patterns shown in the heatmap (E). (F–G) Pseudotime trajectory analysis of 4 CD8+ T cell subsets. (H) The population of each cluster of 4 CD8+ T cell subsets. (I) The population of exhausted CD8+ T cell subsets in the liver of CHB mice and control mice and PBMC of CHB mice. (J) Expression levels of Il7r and Tox at each pseudotime point in 4 CD8+ T cell subsets. (K) Violin plots showing the expression levels of PD-1 and Tox in Tex. (L) The correlation between the frequency of intrahepatic PD-1+CD8+ T cells determined by flow cytometry and the serum HBsAg and HBV-DNA levels. (M) The frequency of intrahepatic PD-1+CD8+ T cells and Tim-3+CD8+ T cells among all CD8+ T cells at 18 or 30 weeks of age in the liver of CHB mice determined by flow cytometry. (N) The frequency of HBV-specific T cells for either HBsAg and HBcAg in the liver, spleen, and PBMC of the CHB mice determined by flow cytometry. (O) The frequency of PD-1+ cells and IFNγ+TNFα+ cells in the HBV-specific and non-specific CD8+ T cells in the liver of CHB mice determined by flow cytometry. ∗P < .05; ∗∗P < .01. Nn, Naïve T cell; Tem, effector memory T cell; Teff, effector T cell; Tex, exhausted T cell.
Figure 3
Figure 3
Dysfunction of the recruited macrophages in the livers of CHB mice. (A–I) Hepatic immune cells from CHB mice and control mice at 8 weeks post-HTVi were analyzed by scRNA-seq sequencing (n = 6 for CHB mice and n = 4 for control mice). (A–B) Two macrophage subsets in UMAP (A) were defined by the indicated marker gene expression shown in the heatmap (B). (C) The population ratio of recruited macrophages to resident KCs. (D) Volcano plot of differential gene expression of recruited macrophages (FAH vs HBV). (E) Violin plot showing the proinflammatory score of recruited macrophages. (F–G) Gene enrichment analysis (Gene Ontology [GO]) showed the top 20 pathways (F), and 2 of those are described by the enrichment score curve (G). (H) Heatmap of the differential number of interactions (FAH: n = 3 vs HBV: n = 3) between macrophages and T cells. (I) Cell‒cell interaction probabilities from macrophage subsets to T cell subsets (the thickness of the line represents the strength of the interaction probability). ∗∗P < .01; ∗∗∗∗P < .0001. KC, Kupffer cell; Treg, regulatory T cell; Tfh, T follicular helper.
Figure 4
Figure 4
Activation of mature NK cells in the livers of CHB mice. (A–E) Hepatic immune cells from CHB mice and control mice at 8 weeks post-HTVi were analyzed by scRNA-seq sequencing (n = 6 for CHB mice and n = 4 for control mice). (A–B) Two NK cell subsets in UMAP (A) were defined by the indicated marker gene expression shown in the heatmap (B). (C) Pseudotime analysis of NK cell clusters. (D) Population of each cluster. (E) Violin plots showing the differentially expressed genes as indicated and the cytotoxic score of the mature NK cell cluster. (F) Frequency of IFNγ+ NK cells in the liver as determined by flow cytometry. ∗P < .05; ∗∗∗P < .001.
Figure 5
Figure 5
Immunomodulatory agents induce the intrahepatic immune response and viral suppression in CHB mice. (A) Experimental scheme. Recombinant IFNα (10,000 U/mouse, subcutaneous) or vehicle was administered daily to the CHB mice and the control mice at 8 weeks after HTVi (n = 7 mice per group). (B) Alterations in serum HBV-DNA levels compared with those at pretreatment and the intrahepatic pgRNA expression levels at the end of treatment. (C) Alteration in serum ALT levels compared with those at pretreatment. (D) FAH expression levels in the liver at the end of treatment. (E) Tenofovir disoproxil fumarate (TDF) (90 mg/kg orally every other day) was administered to the CHB mice at 8 weeks after HTVi (n = 3 mice per group). Alterations in serum HBV-DNA levels compared with those at pretreatment. (F) Intrahepatic mRNA expression levels of Isg15, Oas2, and Gzmb at the end of treatment. (G) Experimental scheme. The TLR7 agonist SA-5 (3 mg/kg orally) or vehicle was orally administered to CHB mice (n = 4 mice per group) at 8 weeks after HTVi. (H) Alteration of serum HBV-DNA levels compared with those at pretreatment and the intrahepatic pgRNA expression levels at the end of treatment. (I) Alteration in serum ALT levels compared with those at pretreatment. (J) Intrahepatic mRNA expression levels of Isg15, Oas2 and Gzmb at the end of treatment. (K) Recombinant IFNα (10,000 U/mouse, subcutanously 3 times/week) or SA-5 (3 mg/kg orally weekly) or vehicle was administered to the CHB mice and the control mice for 3 weeks at 8 weeks after HTVi (n = 5 mice per group). Alterations in serum HBV-DNA levels compared with those at pretreatment. ∗P < .05; ∗∗P < .01.
Figure 6
Figure 6
Immunomodulatory effects of IFNα and SA-5 in CHB mice. (A–D) Hepatic immune cells from CHB mice and control mice with IFNα or SA-5 treatment were analyzed by scRNA-seq sequencing (n = 3 mice per group). (A) Violin plots showing the ISG15 expression levels of each major cluster. (B) Violin plots showing the functional score (IFNγ signaling) of the indicated CD8+ T cell cluster. (C) Violin plots showing inflammatory response scores of recruited macrophages. (D) Violin plots showing cytotoxic scores of NK cell. (E) Representative dot plots of IFNγ+GZMB+ CD8+ T cells in the liver as determined by flow cytometry. (F) Frequencies of intrahepatic IFNγ+GZMB+ CD8+ T and IFNγ+GZMB+ NK cells as determined by flow cytometry. ∗P < .05; ∗∗∗∗P < .0001.

References

    1. World Health Organization Fact sheet, Hepatitis B. 2022; June. https://www.who.int/news-room/fact-sheets/detail/hepatitis-b Available at:
    1. McMahon B.J. The natural history of chronic hepatitis B virus infection. Hepatology. 2009;49:S45–S55. - PubMed
    1. Terrault N.A., Bzowej N.H., Chang K.M., et al. American Association for the Study of Liver Diseases AASLD guidelines for treatment of chronic hepatitis B. Hepatology. 2016;63:261–283. - PMC - PubMed
    1. European Association for the Study of the Liver EASL 2017 Clinical Practice Guidelines on the management of hepatitis B virus infection. J Hepatol. 2017;67:370–398. - PubMed
    1. Fanning G.C., Zoulim F., Hou J.L., Bertoletti A. Therapeutic strategies for hepatitis B virus infection: towards a cure. Nat Rev Drug Discov. 2019;18:827–844. - PubMed

MeSH terms