. 2024 Oct 1;10(1):420.
doi: 10.1038/s41420-024-02191-0.

The critical role of Gαi3 in oral squamous cell carcinoma cell growth

Affiliations

The critical role of Gαi3 in oral squamous cell carcinoma cell growth

Quan Li et al. Cell Death Discov. .

Abstract

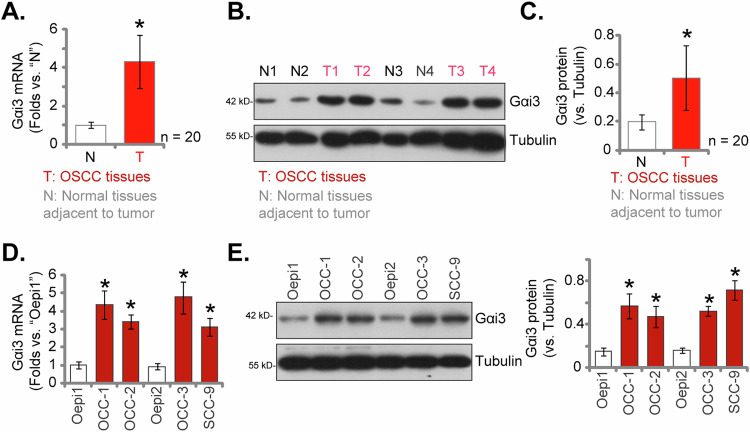
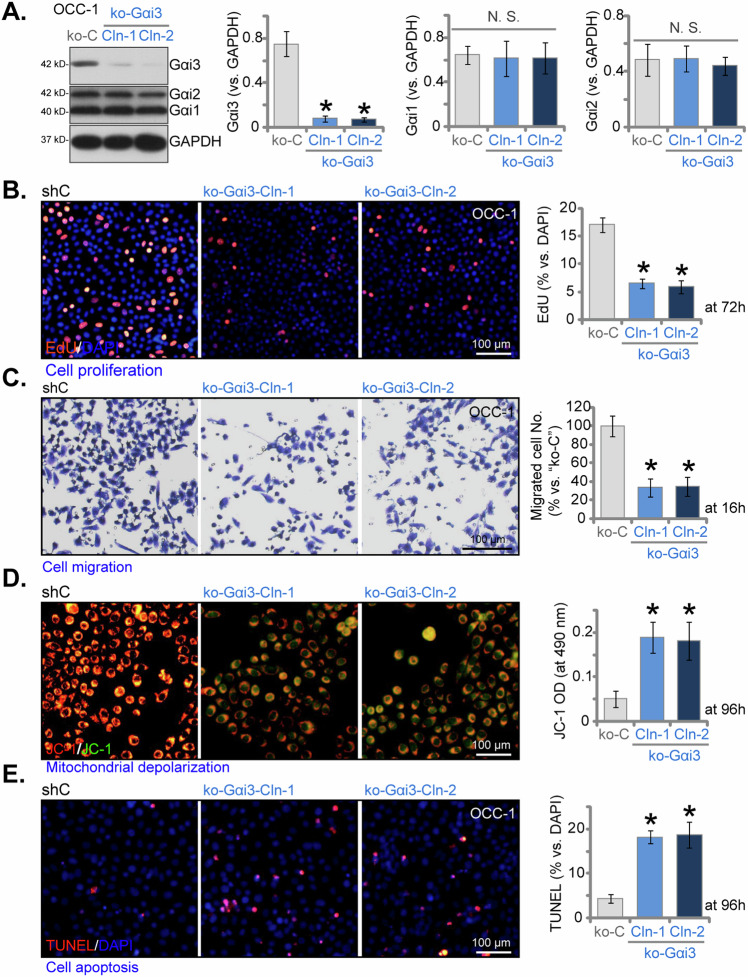
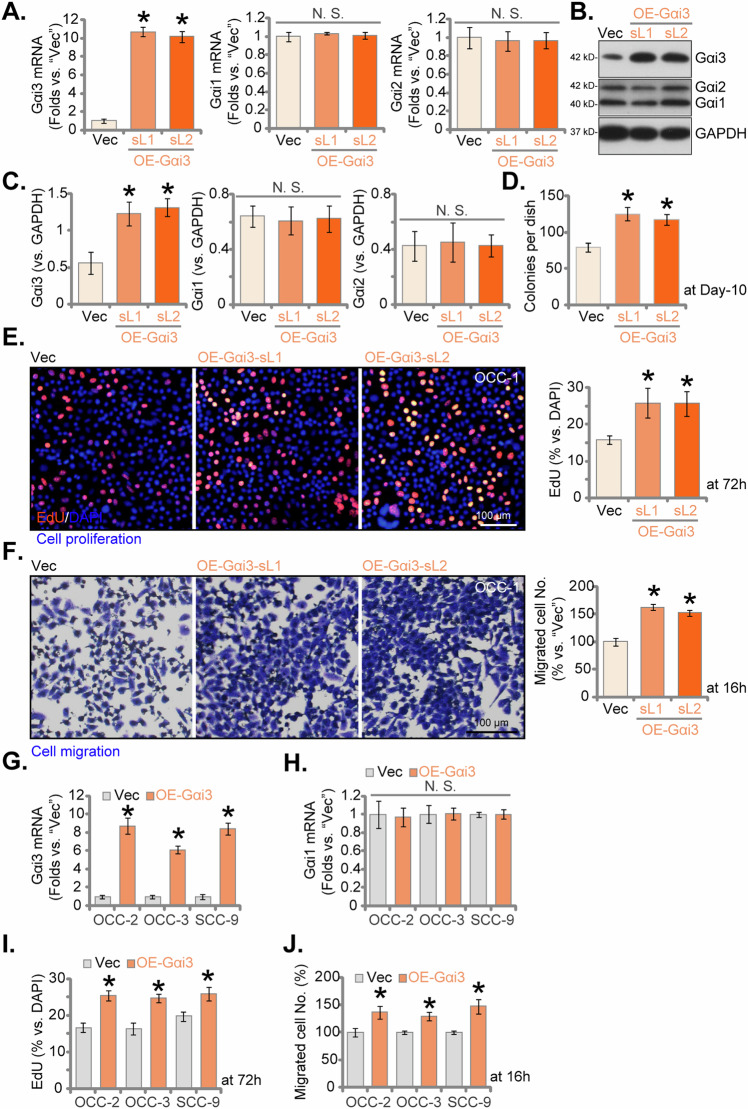
The identification of novel and effective therapeutic targets for oral squamous cell carcinoma (OSCC) is of paramount importance. This study investigates the expression, potential functions, and mechanistic insights of G protein inhibitory subunit 3 (Gαi3) in OSCC. Gαi3 is found to be upregulated in human OSCC tissues as well as in various primary and established OSCC cells. In different OSCC cells, silencing of Gαi3 through shRNA resulted in inhibited cell proliferation and migration, while also inducing apoptosis. Knockout (KO) of Gαi3 via the CRISPR/Cas9 method produced significant anti-cancer effects in OSCC cells. Conversely, ectopic overexpression of Gαi3 enhanced OSCC cell growth, promoting cell proliferation and migration. Gαi3 plays a crucial role in activating the Akt-mTOR signaling pathway in OSCC cells. Silencing or KO of Gαi3 led to decreased phosphorylation levels of Akt and S6K, whereas overexpression of Gαi3 increased their phosphorylation. Restoration of Akt-mTOR activation through a constitutively active mutant Akt1 mitigated the anti-OSCC effects induced by Gαi3 shRNA. In vivo, Gαi3 silencing significantly suppressed the growth of subcutaneous OSCC xenografts in nude mice, concomitant with inactivation of the Akt-mTOR pathway and induction of apoptosis. Collectively, these findings underscore the critical role of Gαi3 in OSCC cell growth both in vitro and in vivo.


Conflict of interest statement

The authors declare no competing interests.

Figures

Fig. 1
Fig. 1. Gαi3 is upregulated in human OSCC tissues and cells.
The expression of Gαi3 mRNA and protein was assessed in twenty pairs (n = 20) of OSCC tissues (“T”) and adjacent normal tissues (“N”) through qPCR (A) and western blotting (B, C) assays. The expression of Gαi3 mRNA and protein in a panel of primary and established human OSCC cells, as well as primary human oral cavity epithelial cells (“Oepi1-2”), was evaluated using qPCR (D) and western blotting (E) assays, respectively. Results were presented as mean values ± standard deviation (SD). *P < 0.05 compared to “N” tissues (AC) or “Oepi1” cells (D, E). Scale bar = 100 μm.
Fig. 2
Fig. 2. Silencing of Gαi3 leads to significant anti-cancer effects in OSCC cells.
Primary and established human OSCC cells underwent stable transduction with Gαi3 lentivirus shRNA (sh-Gαi3-seq1/sh-Gαi3-seq2, two distinct sequences) or a scramble control shRNA (“shC”). Subsequently, the expression levels of the listed mRNAs and proteins were evaluated using qPCR (A, G, H) and western blotting (B, C) assays, respectively. Following culturing for specified durations, assays were conducted to assess colony formation (D), cell proliferation (quantification of EdU-positive nuclei ratio, E, I), cell migration (“Transwell” assays, F, J). The designation “pare” denotes parental control cells. Data were expressed as mean ± standard deviation (SD, n = 5). Statistical significance was denoted by *P < 0.05 compared to the “shC” group, while “N .S.” indicated non-statistically significant differences (P > 0.05). Experiments were repeated five times with consistent results. Scale bar = 100 μm.
Fig. 3
Fig. 3. Silencing of Gαi3 leads to apoptosis in OSCC cells.
Primary and established human OSCC cells underwent stable transduction with Gαi3 lentivirus shRNA (sh-Gαi3-seq1/sh-Gαi3-seq2, two distinct sequences) or a scramble control shRNA (“shC”). Following culturing for 96 h, the caspase-3 activity (A, F), expression of apoptosis-related proteins (B), the cytosol cytochrome C content (ELISA assay, C), and mitochondrial depolarization (JC-1 staining assay, D) were tested; Cell apoptosis was measured via nuclear TUNEL staining (E, G) assays. Data were expressed as mean ± standard deviation (SD, n = 5). Statistical significance was denoted by *P < 0.05 compared to the “shC” group. Experiments were repeated five times with consistent results. Scale bar = 100 μm.
Fig. 4
Fig. 4. Knocking out of Gαi3 induces significant anti-cancer effects in OSCC cells.
Cas9-expressing OCC-1 primary cells were utilized to establish two stable colonies, namely “ko-Gαi3-Cln-1 and ko-Gαi3-Cln-2”, harboring the CRISPR/Cas9-Gαi3-KO-puro construct, along with a control group transfected with the CRISPR/Cas9 empty vector (“koC”). The expression levels of the listed proteins were evaluated via western blotting assays (A). Subsequently, cells were cultured for specified durations, and assays were conducted to evaluate cell proliferation (quantification of EdU-positive nuclei ratio, B), cell migration (“Transwell” assays, C), mitochondrial depolarization (JC-1 staining assay, D), and apoptosis (measuring TUNEL-positive nuclei ratio, E). Data were expressed as mean ± standard deviation (SD, n = 5). Statistical significance was denoted by *P < 0.05 compared to the “koC” group, while “N. S.” indicated non-statistically significant differences (P > 0.05). Experiments were repeated five times with consistent results. Scale bar = 100 μm.
Fig. 5
Fig. 5. Ectopic overexpression of Gαi3 fosters the growth of OSCC cells.
Primary human OSCC cells (OCC-1, OCC-2, OCC-3) and immortalized OS cell line (SCC-9) were stably transduced with a lentiviral construct containing either wild-type Gαi3 (“OE-Gαi3”) or an empty vector (“Vec”). Subsequently, the expression levels of specific mRNAs and proteins were evaluated through qPCR and western blotting assays (AC, G, H). The cells were cultured for designated time intervals. Various functional assays were performed: colony formation (D), cell proliferation (assessed by the ratio of EdU-positive nuclei, E, I), and migration (via “Transwell” assays, F, J). Data were expressed as mean ± standard deviation (SD, n = 5). Statistical significance was denoted by *P < 0.05 compared to the “Vec” group, while “N. S.” indicated non-statistically significant differences (P > 0.05). Experiments were repeated five times with consistent results. Scale bar = 100 μm.
Fig. 6
Fig. 6. Gαi3 plays a critical role in activating Akt-mTOR signaling in OSCC cells.
The OCC-1 primary cells underwent stable transduction with Gαi3 lentivirus shRNA (sh-Gαi3-seq1/sh-Gαi3-seq2, two distinct sequences), a scramble control shRNA (“shC”), Cas9 plus CRISPR/Cas9-Gαi3-KO-puro construct (“ko-Gαi3-Cln-1 and ko-Gαi3-Cln-2”, two stable colonies), the CRISPR/Cas9 empty vector (“koC”), a lentiviral construct containing either wild-type Gαi3 (“OE-Gαi3”) or an empty vector (“Vec”), and expression of listed proteins was shown (AC). OCC-1 primary cells transduced with Gαi3 lentivirus shRNA (sh-Gαi3-seq1) were further stably transduced with a constitutively active mutant Akt1 (caAkt1). The expression of the listed proteins was confirmed (D). Cells were then cultivated for the indicated time periods, and assays were performed to test cell proliferation, migration, and apoptosis via nuclear EdU staining (E), “Transwell” (F), and nuclear TUNEL staining (G), respectively. Data were expressed as mean ± standard deviation (SD, n = 5). Statistical significance was denoted by *P < 0.05 compared to the control genetic treatment group (AC). # P < 0.05 (DG). Experiments were repeated five times with consistent results. Scale bar = 100 μm.
Fig. 7
Fig. 7. Gαi3 silencing hinders subcutaneous OSCC xenograft growth in nude mice.
The stable OCC-1 cells expressing Gαi3 shRNA (“sh-Gαi3-seq1”) or control shRNA (“shC”) were subcutaneously injected into the flanks of nude mice at eight million cells per mouse, with nine mice per experimental group (n = 9). Recordings commenced ten days post-cell inoculation (day-10). The volumes of the OCC-1 xenografts (A) and the body weights of the mice (D) were monitored and recorded at six-day intervals from day-10 to day-46. The daily growth rate of the OCC-1 xenografts was also evaluated (B). On day-46, the xenografts were surgically excised, and their weights were measured (C). Two xenografts per group (labeled as “1#” and “2#”) were isolated, protein and mRNA expression analyses were performed on tissue lysates from the harvested xenografts (EH, J), and Caspase-3 activity was also assessed (I). Additionally, xenograft sections underwent TUNEL/DAPI fluorescence staining (K). Data were expressed as mean ± standard deviation (SD). Statistical significance was denoted by *P < 0.05 compared to the “shC” group, while “N. S.” indicated non-statistically significant differences (P > 0.05). AD n = 9 mice per group. EK, each xenograft was cut into five pieces and tested separately. Scale bar = 100 μm.

References

    1. Chamoli A, Gosavi AS, Shirwadkar UP, Wangdale KV, Behera SK, Kurrey NK, et al. Overview of oral cavity squamous cell carcinoma: risk factors, mechanisms, and diagnostics. Oral Oncol. 2021;121:105451. - PubMed
    1. Rivera C, Venegas B. Histological and molecular aspects of oral squamous cell carcinoma (Review). Oncol Lett. 2014;8:7–11. - PMC - PubMed
    1. Massano J, Regateiro FS, Januario G, Ferreira A. Oral squamous cell carcinoma: review of prognostic and predictive factors. Oral Surg Oral Med Oral Pathol Oral Radiol Endod. 2006;102:67–76. - PubMed
    1. Omura K. Current status of oral cancer treatment strategies: surgical treatments for oral squamous cell carcinoma. Int J Clin Oncol. 2014;19:423–30. - PubMed
    1. Bhatia A, Burtness B. Treating head and neck cancer in the age of immunotherapy: a 2023 update. Drugs. 2023;83:217–48. - PubMed

LinkOut - more resources