. 2024 Sep 30;10(1):417.
doi: 10.1038/s41420-024-02184-z.

Fatty acid synthase (FASN) is a tumor-cell-intrinsic metabolic checkpoint restricting T-cell immunity

Affiliations

Fatty acid synthase (FASN) is a tumor-cell-intrinsic metabolic checkpoint restricting T-cell immunity

Elisabet Cuyàs et al. Cell Death Discov. .

Abstract

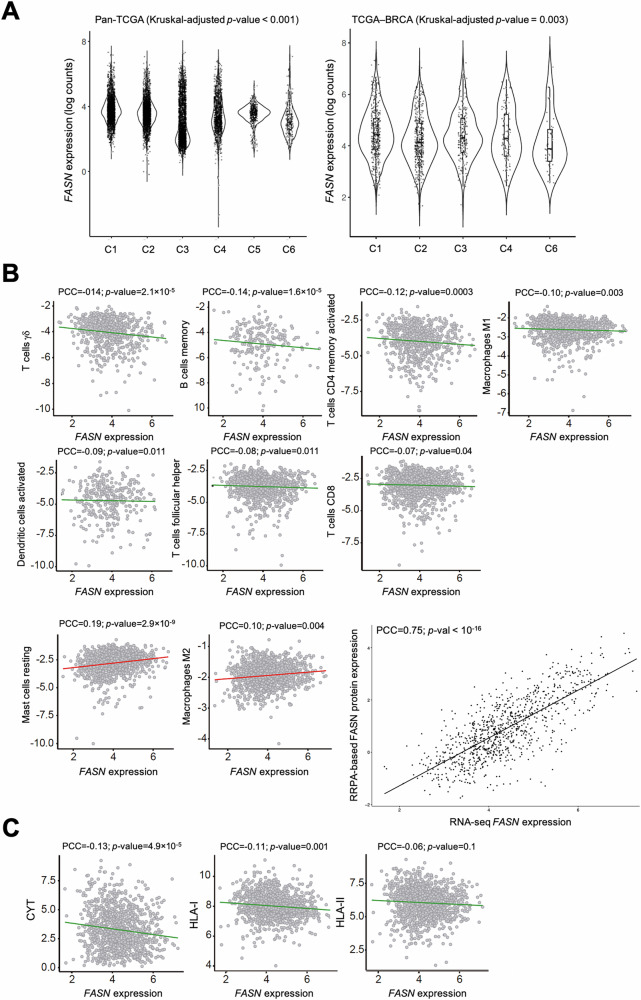
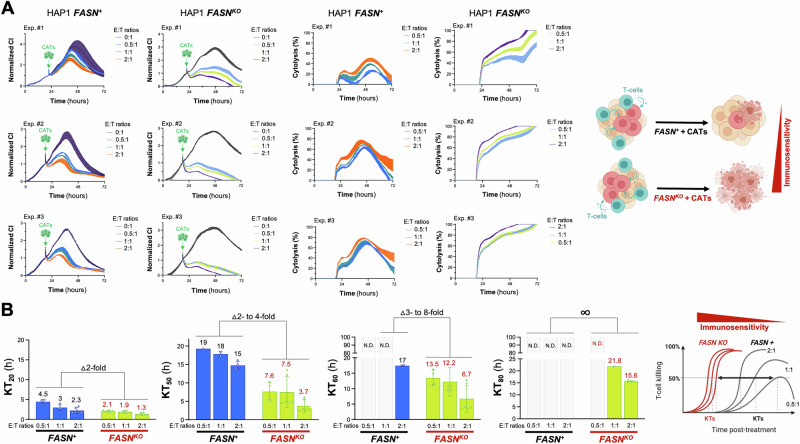
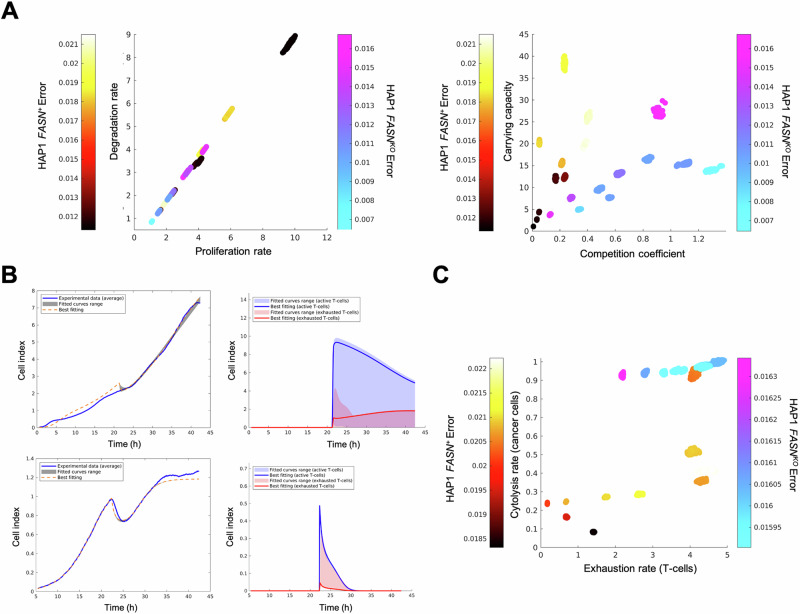
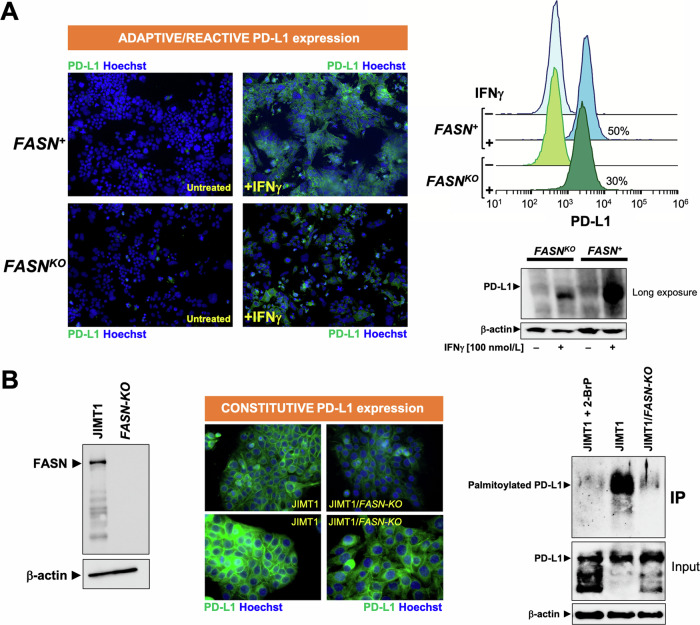
Fatty acid synthase (FASN)-catalyzed endogenous lipogenesis is a hallmark of cancer metabolism. However, whether FASN is an intrinsic mechanism of tumor cell defense against T cell immunity remains unexplored. To test this hypothesis, here we combined bioinformatic analysis of the FASN-related immune cell landscape, real-time assessment of cell-based immunotherapy efficacy in CRISPR/Cas9-based FASN gene knockout (FASN KO) cell models, and mathematical and mechanistic evaluation of FASN-driven immunoresistance. FASN expression negatively correlates with infiltrating immune cells associated with cancer suppression, cytolytic activity signatures, and HLA-I expression. Cancer cells engineered to carry a loss-of-function mutation in FASN exhibit an enhanced cytolytic response and an accelerated extinction kinetics upon interaction with cytokine-activated T cells. Depletion of FASN results in reduced carrying capacity, accompanied by the suppression of mitochondrial OXPHOS and strong downregulation of electron transport chain complexes. Targeted FASN depletion primes cancer cells for mitochondrial apoptosis as it synergizes with BCL-2/BCL-XL-targeting BH3 mimetics to render cancer cells more susceptible to T-cell-mediated killing. FASN depletion prevents adaptive induction of PD-L1 in response to interferon-gamma and reduces constitutive overexpression of PD-L1 by abolishing PD-L1 post-translational palmitoylation. FASN is a novel tumor cell-intrinsic metabolic checkpoint that restricts T cell immunity and may be exploited to improve the efficacy of T cell-based immunotherapy.


Conflict of interest statement

Joaquim Bosch-Barrera reports grant funding and personal fees from Pfizer, MSD Spain, BMS, AstraZeneca, Novartis, Boehringer-Ingelheim, Vifor, Sanofi, and LEO Pharma outside the submitted work. These companies had no role in the design of the study, in the collection, analysis, or interpretation of the data; in writing the manuscript; or in the decision to submit the results for publication. All of the other authors declare that they have no known competing financial interests or personal relationships that could potentially influence the work reported in this article.

Figures

Fig. 1
Fig. 1. Correlation of FASN expression with inferred immune cell types and characteristics.
A FASN expression distribution across the C1-C6 TCGA transcriptomic immune subtypes: C1 (wound healing), C2 (IFNγ dominant), C3 (inflammatory), C4 (lymphocyte depleted), C5 (immunologically quiet), and C6 (TGFβ dominant). Kruskal-Wallis-adjusted p-values are shown. B Negative (upper and middle panels) and positive (lower panels) correlations of FASN (gene expression, log2) with CIBERSORTx-inferred immune cell content (Y-axis) in TCGA primary breast tumors. The inset shows the correlation between FASN gene expression by RNA-seq and FASN protein expression by RPPA. The PCCs are indicated (FDR-adjusted p-values < 0.05). C Negative correlation of FASN (gene expression, log2) with inferred cytolytic activity (CYT) and gene expression signatures of HLA-I and HLA-II components. PCCs are indicated (FDR-adjusted p-values < 0.05).
Fig. 2
Fig. 2. Correlation of FASN expression with immune system and immunotherapy-related signatures.
A Negative correlation of FASN (gene expression, log2) immunotherapy-related gene signatures, including acquired resistance (top left), CD8 T-cell exhaustion (top right), activated regulatory T cells (bottom left), and IFNγ-mediated prediction of response to anti-PD1 therapy (bottom right). PCCs are indicated (FDR-adjusted p-values < 0.05). B Negative correlation of FASN (gene expression, log2) with signatures of T cell accumulation in tumors (left), genes encoding for stimulatory checkpoints (middle), and biological processes of the inflammatory response (right). PCCs are indicated (FDR-adjusted p-values < 0.05).
Fig. 3
Fig. 3. Effect of FASN loss on the sensitivity of HAP1 cancer cells to cytolysis by cytokine-activated T cells (CATs).
A. Left. Raw CI plots (n = 3 independent experiments) of parental FASN+ HAP1 and FASNKO HAP1 derivatives (target cells) incubated with different E:T ratios of CATs. Y-axis is the normalized CI (for the CI value measured before the addition of CATs) generated by the RTCA software and displayed in real time. X-axis is the cell culture/treatment time in hours (up to 72 hours). The spike in the CI signal is noise due to the removal of the E-plates from the incubator to add CATs. Right. CI plots were converted to % cytolysis plots using the xCELLigence Immunotherapy Software (xIMT) after addition of CATs at different E:T ratios. B Killing kinetics of CATs against HAP1-FASN+ and HAP1-FASNKO derivatives using 20%, 50%, 60%, and 80% Killing Time (KT) values calculated with the xIMT software from the impedance measurements shown in (A). Figure shows means (columns) of KT values ± S.D. (bars). ND Not detected. In the absence of FASN, there is a marked leftward shift in the KT values at any E:T ratio, indicating increased immunosensitivity.
Fig. 4
Fig. 4. Mathematical deconvolution of T-cell killing and exhaustion from real-time killing assay data.
A Comparison of intrinsic parameters of cancer cell models (FASN+ HAP1 parental cells in hot colors and FASNKO HAP1 derivatives in cold colors). Left. Scatter plot showing the comparison between growth (r) and death (d) rates. The growth rate (i.e., r-d) is the same for both cell types. Right. Scatter plot showing the comparison between the weight (alpha1) and the carrying capacity (K). B Experimental (blue curve) and fitted cell index data of FASN+ HAP1 parental cells (top) and FASNKO HAP1 derivatives (bottom) growing in the presence of CATs. Left panels. Fitted cancer cell index data. Right panels. Dynamics for the active and exhausted T cells obtained from the model for the parameter values that provide the best fits to the experimental data. The parameters for best fits are: for HAP1 FASN+, r = (2.701; 2.342; 4.462), d = (2.141; 1.757; 3.834), a = (0.834; 0.036; 0.677), K = 1.794, h = (0.642; 0.356; 0.084), l = (3.845; 3.403; 1.437), b = (0.548; 0.378), rA = 23.300, dE = 29.383, C = 6.334; for HAP1 FASNKO, r = (4.424; 6.162; 10.005), d = (3.975; 5.922; 9.659), a = (0.175; 0.980; 0.138), K = 2.037, h = (0.955; 4.212; 3.677), l = (3.875; 1.637; 1.597), b = (0.169; 0.469), rA = 2.671, dE = 35.676, C = 72.179. The parameter values shown in triplicate correspond to the three tumor cell populations. C Comparison of the interaction parameters I (exhaustion) and h (cytolysis). FASN+ HAP1 parental cells are shown in hot colors and FASNKO HAP1 derivatives are shown in cold colors. The bars with the color gradients show the error, calculated as the average absolute value of the difference between the fitted data and the experimental data at each time step.
Fig. 5
Fig. 5. Effect of FASN loss on mitochondrial OXPHOS function and priming.
A GSEA results for the positive and (strongest) negative association between FASN and immune system-related gene sets in the CRISPR-based dependencies of the CCLE. The GSEA normalized enrichment score (NES) and nominal p-values, as well as the top 5 associated genes, are shown for each positively associated feature. The GSEA NES and FDR-adjusted p-value are shown in the negatively associated feature. B Left. Mitochondrial function in FASN+ HAP1 parental cells and FASNKO HAP1 derivatives was assessed using the Seahorse XFp Cell Mito Stress Test Assay. The figure shows representative Seahorse OCR bioenergetic profiles (n ≥ 3) that were acquired after sequential addition of pharmacological inhibitors to examine the function of individual components of the mitochondrial electron transport chain (ETC). To estimate the fraction of basal OCR coupled to ATP synthesis, ATP synthase (ETC complex V) was inhibited by oligomycin, which reduces the OCR rate to the extent that cells use mitochondria to generate ATP. Proton leak across the mitochondrial membrane is responsible for the remaining OCR. The proton ionophore FCCP was injected for determination of the maximum OCR that the cells could sustain. Finally, antimycin A was injected to inhibit the flow of electrons through the ETC complex III, which leads to a dramatic suppression of the OCR. The remaining OCR is attributable to O2 consumption due to formation of mitochondrial ROS and non-mitochondrial sources. Spare capacity is calculated as the maximal rate minus the basal rate and represents a parameter the cells can use to back up increased work to cope with stress. Right. Expression of mitochondrial ETC proteins in FASN+ HAP1 parental cells and FASNKO HAP1 derivatives. Representative immunoblot of ETC complex I (NDUFB8), complex II (SDHB), III (UQCRC2), IV (COXII) and V (V-ATP5A) protein expression proteins in FASN+ HAP1 parental cells and FASNKO HAP1 derivatives cultured in the absence or presence of IFNγ (100 nmol/L) for 48 h. Similar results were obtained from two additional independent experiments. In response to targeted FASN loss of function, mitochondrial OXPHOS dysfunction occurs with drastic downregulation of ETC complexes I, III and IV. C FASN+ HAP1 parental cells and FASNKO HAP1 derivatives (60,000 cells/well) were challenged with increasing concentrations of BH3 mimetics (ABT-263/navitoclax, A1331852, ABT-199/venetoclax, S63845) in the absence or presence of CAT cells at a fixed E:T ratio of 0.5:1. Tumor cells were fixed and stained and subjected to crystal violet staining 2 days later. Representative microphotographs (n = 3) are shown. FASN loss-of-function appears to enhance the mitochondrial apoptotic priming state to bring tumor cells closer to the apoptotic threshold, a phenomenon that can be further enhanced by pro-apoptotic, BCL-XL-targeting BH3 mimetics, thereby facilitating the cytolytic activity of immune cells.
Fig. 6
Fig. 6. Effect of FASN loss on adaptive/reactive and constitutive PD-L1 expression.
A Left. Representative immunofluorescence staining of PD-L1 in FASN+ HAP1 parental cells and FASNKO HAP1 derivatives, either with or without IFNγ (100 nmol/L, 24 h) exposure. Right. Flow cytometry-based PD-L1 cell surface expression in FASN+ HAP1 parental cells and FASNKO HAP1 derivatives, either with or without IFNγ (100 nmol/L, 24 h) exposure. Representative immunoblot analysis of PD-L1 expression in FASN+ HAP1 parental cells and FASNKO HAP1 derivatives, either with or without IFNγ (100 nmol/L, 24 h). Each cell line was tested in at least three independent experiments. B Left. Representative immunoblot analysis of FASN expression in JIMT1 parental cells and JIMT1/FASN-KO derivatives. Middle. Representative immunofluorescence staining of PD-L1 in FASN+ JIMT1 parental cells and JIMT1/FASN-KO derivatives. Right. Representative immunoblot analysis of whole lysates or immunoprecipitates of S-palmitoylated proteins in JIMT1 parental cells (either with or without 2-bromopalmitate) and JIMT1/FASN-KO derivatives. Each cell line was tested in a minimum of three independent experiments.
Fig. 7
Fig. 7. Effect of FASN loss on the sensitivity of PD-L1/HER2-overexpressing JIMT1 breast cancer cells to cytolysis by cytokine-activated T cells (CATs).
A Mitochondrial function in JIMT1 parental cells and JIMT1/FASN-KO derivatives was assessed using the Seahorse XFp Cell Mito Stress Test Assay. The figure shows representative Seahorse OCR bioenergetic profiles (n ≥ 3) that were acquired after sequential addition of pharmacological inhibitors to examine the function of individual components of the mitochondrial ETC as described in Fig. 5. B Killing kinetics of CATs against JIMT1 parental cells and JIMT1/FASN-KO derivatives using 50% Killing Time (KT) values calculated with the xIMT software as described in Fig. 3. C FASN is a tumor-cell-intrinsic metabolic checkpoint that restricts T-cell immunity by protecting mitochondrial OXPHOS function, reducing mitochondrial priming, and promoting PD-L1 trafficking to the cancer cell membrane via PD-L1 palmitoylation (created with Biorender.com).

References

    1. Menendez JA, Lupu R. Fatty acid synthase and the lipogenic phenotype in cancer pathogenesis. Nat Rev Cancer. 2007;7:763–77. - PubMed
    1. Ameer F, Scandiuzzi L, Hasnain S, Kalbacher H, Zaidi N. De novo lipogenesis in health and disease. Metabolism. 2014;63:895–902. - PubMed
    1. Röhrig F, Schulze A. The multifaceted roles of fatty acid synthesis in cancer. Nat Rev Cancer. 2016;16:732–49. - PubMed
    1. Munir R, Lisec J, Swinnen JV, Zaidi N. Lipid metabolism in cancer cells under metabolic stress. Br J Cancer. 2019;120:1090–8. - PMC - PubMed
    1. Vanauberg D, Schulz C, Lefebvre T. Involvement of the pro-oncogenic enzyme fatty acid synthase in the hallmarks of cancer: a promising target in anti-cancer therapies. Oncogenesis. 2023;12:16. - PMC - PubMed