. 2024 Sep 30;15(9):699.
doi: 10.1038/s41419-024-07079-6.

Identification of Gαi3 as a promising molecular oncotarget of pancreatic cancer

Affiliations

Identification of Gαi3 as a promising molecular oncotarget of pancreatic cancer

Jian-Zhuo Jiang et al. Cell Death Dis. .

Abstract

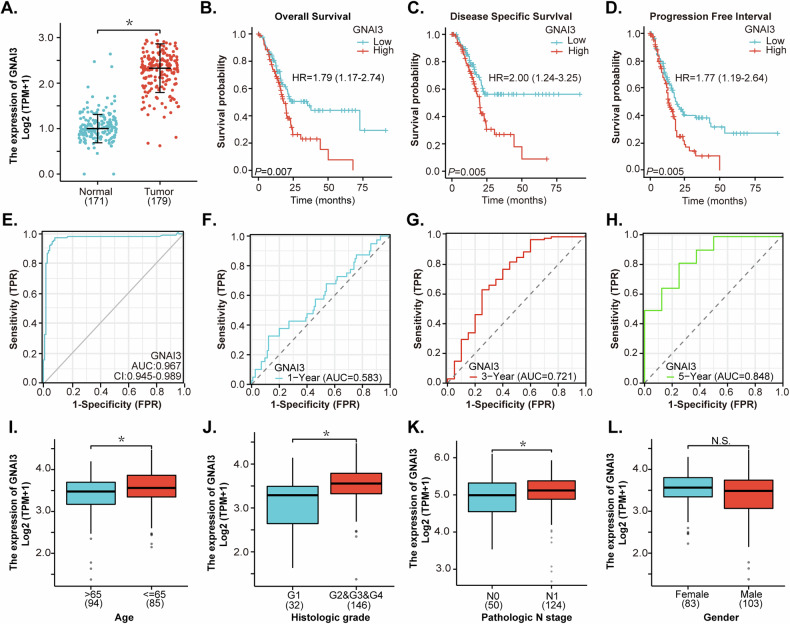
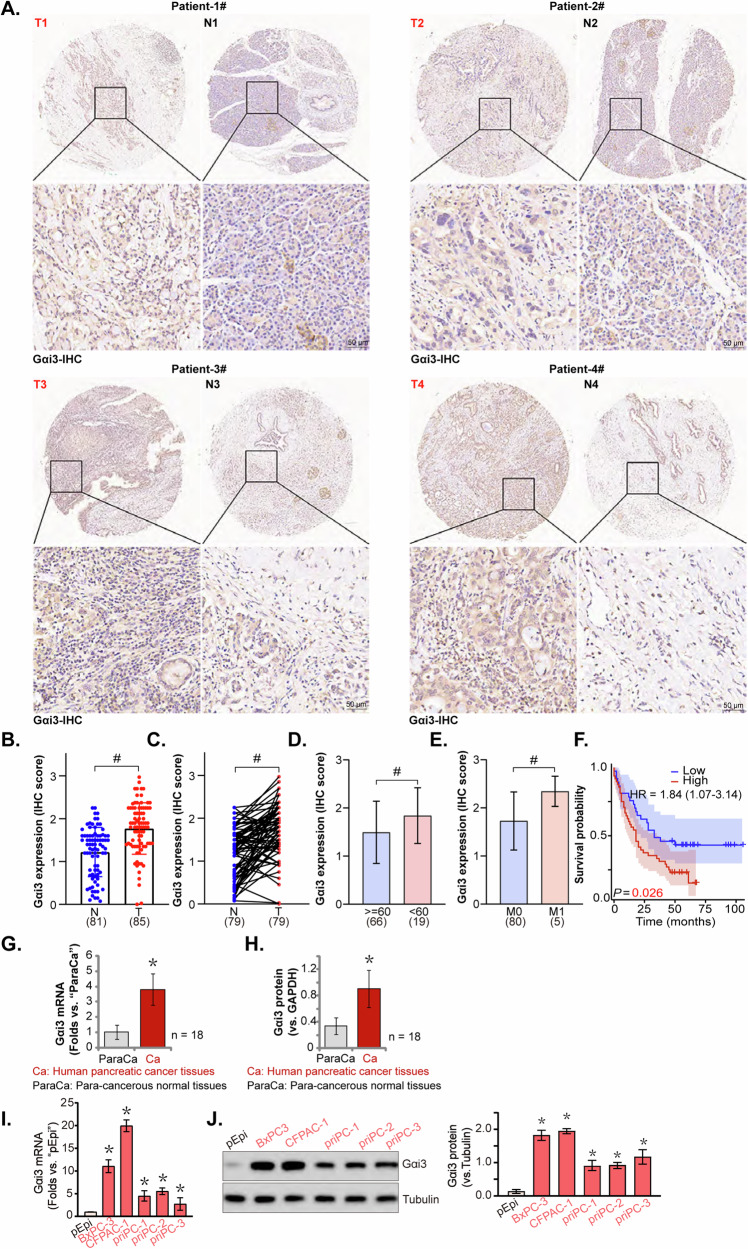
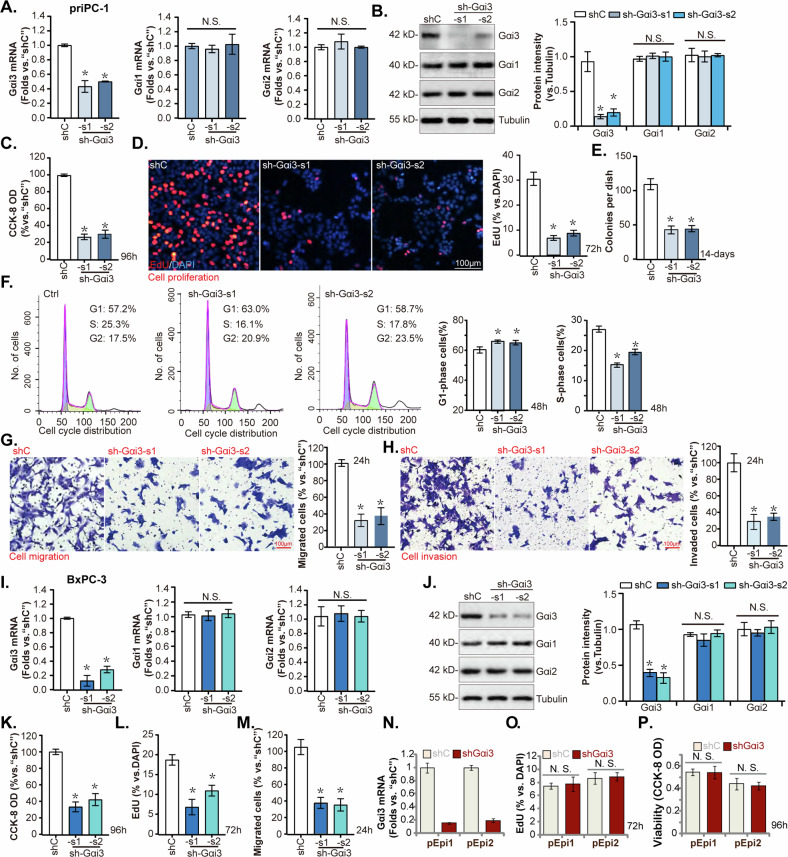
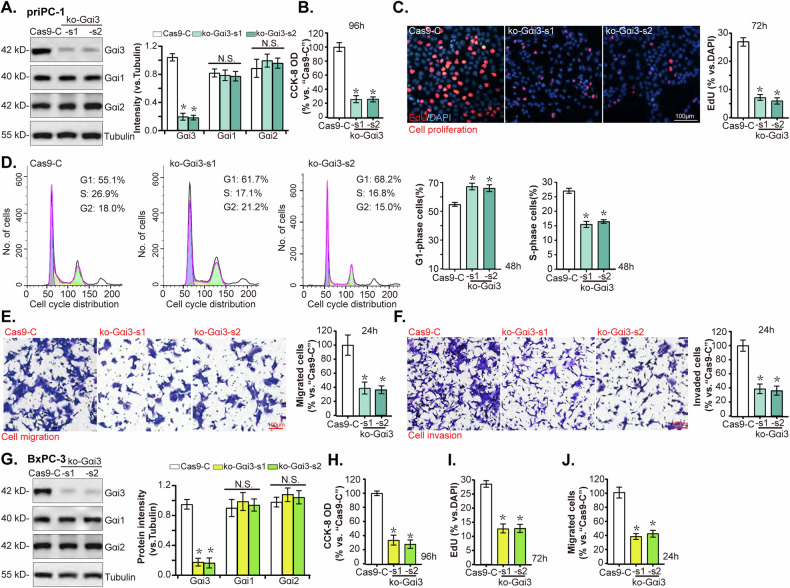
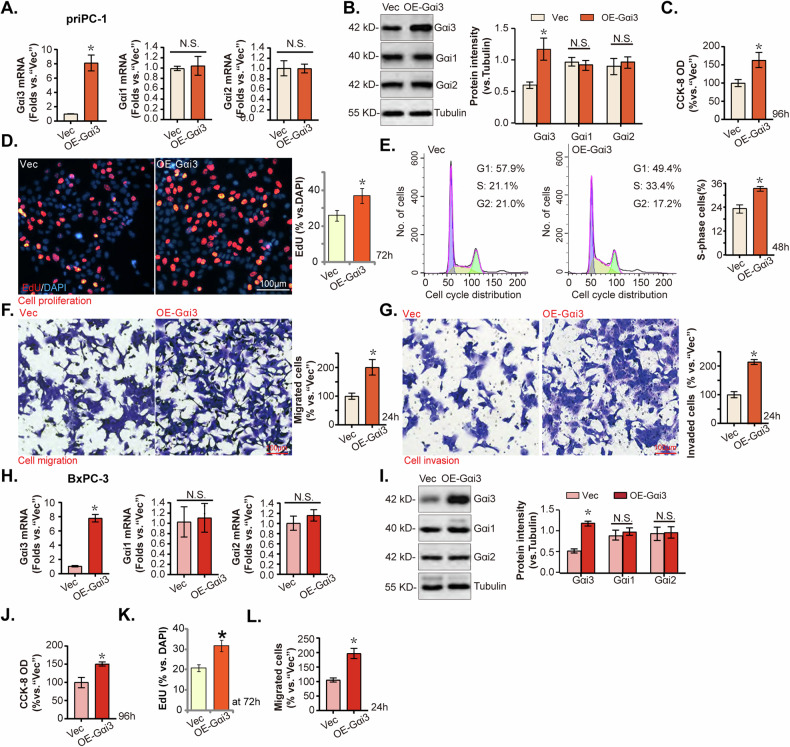
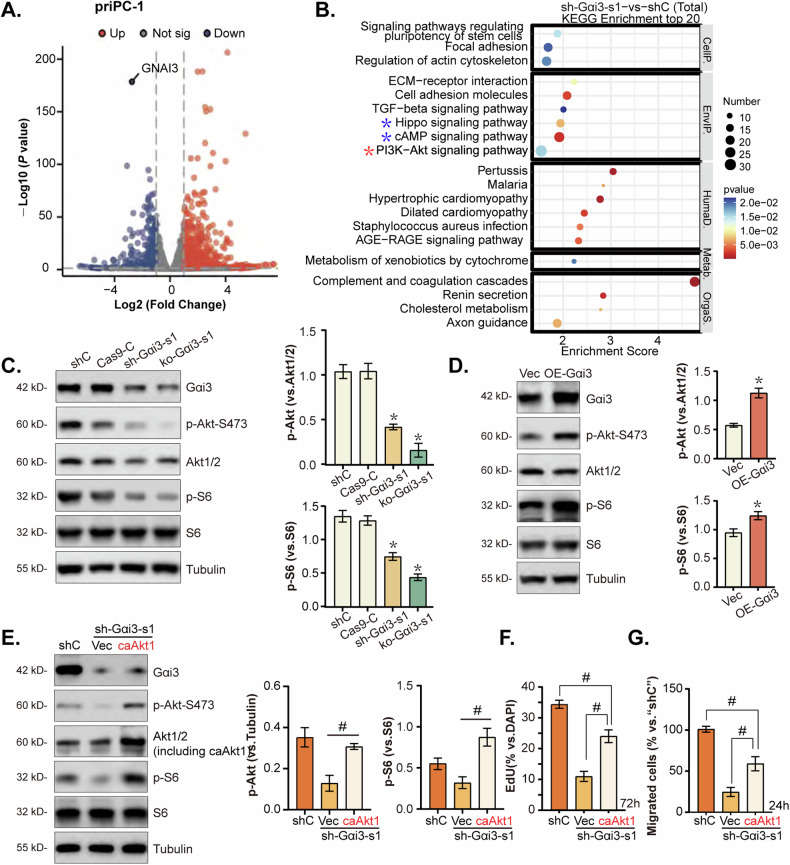
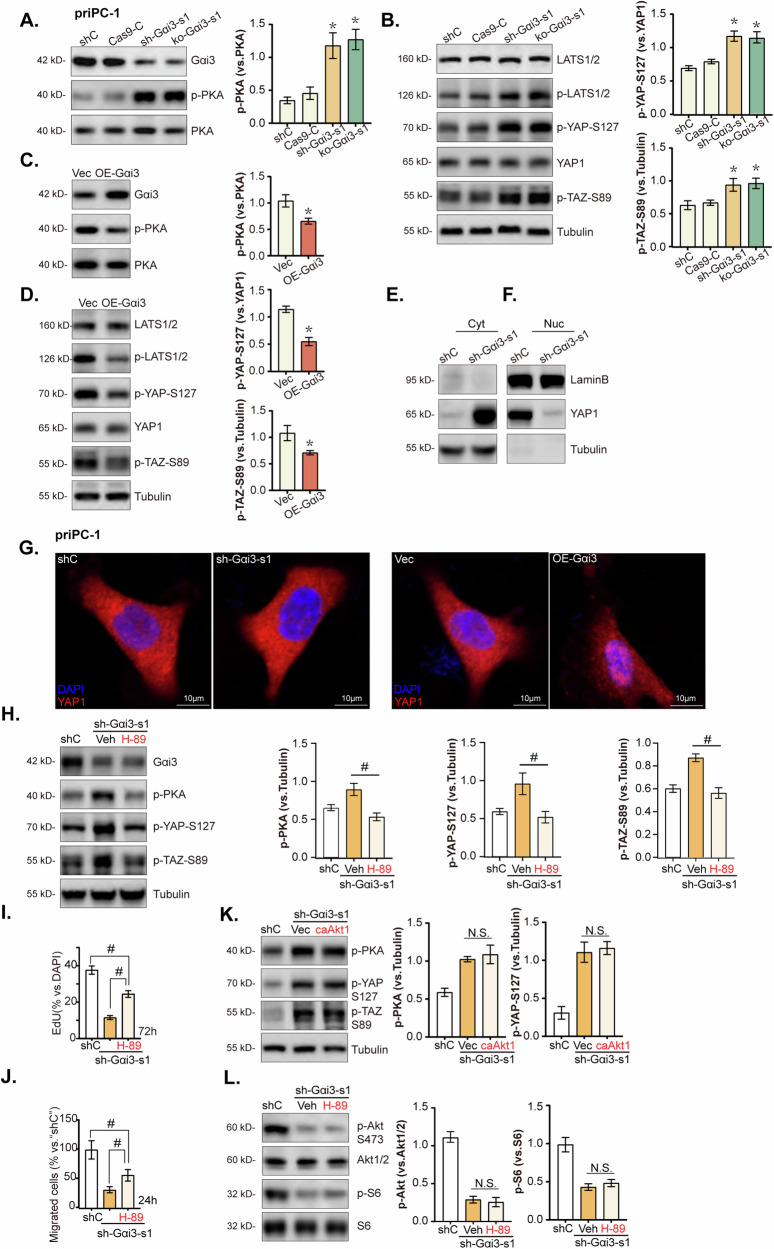
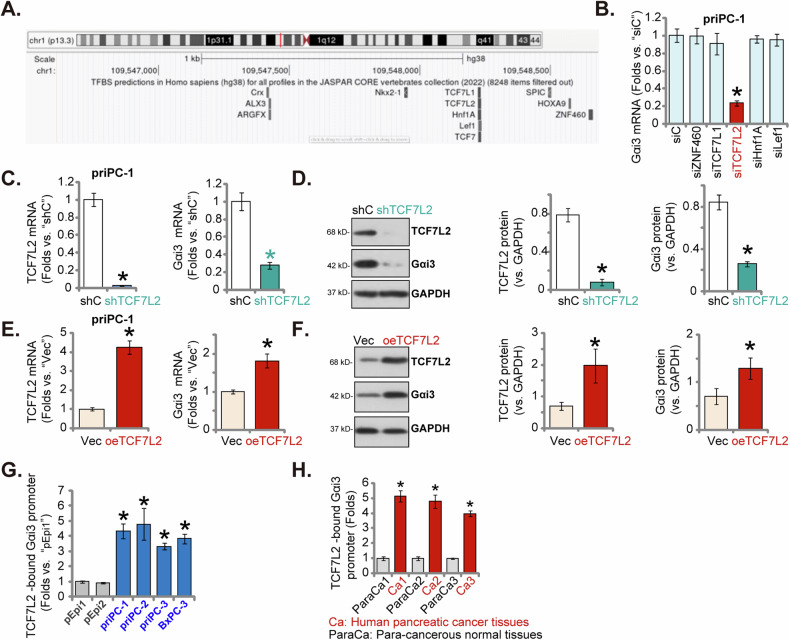
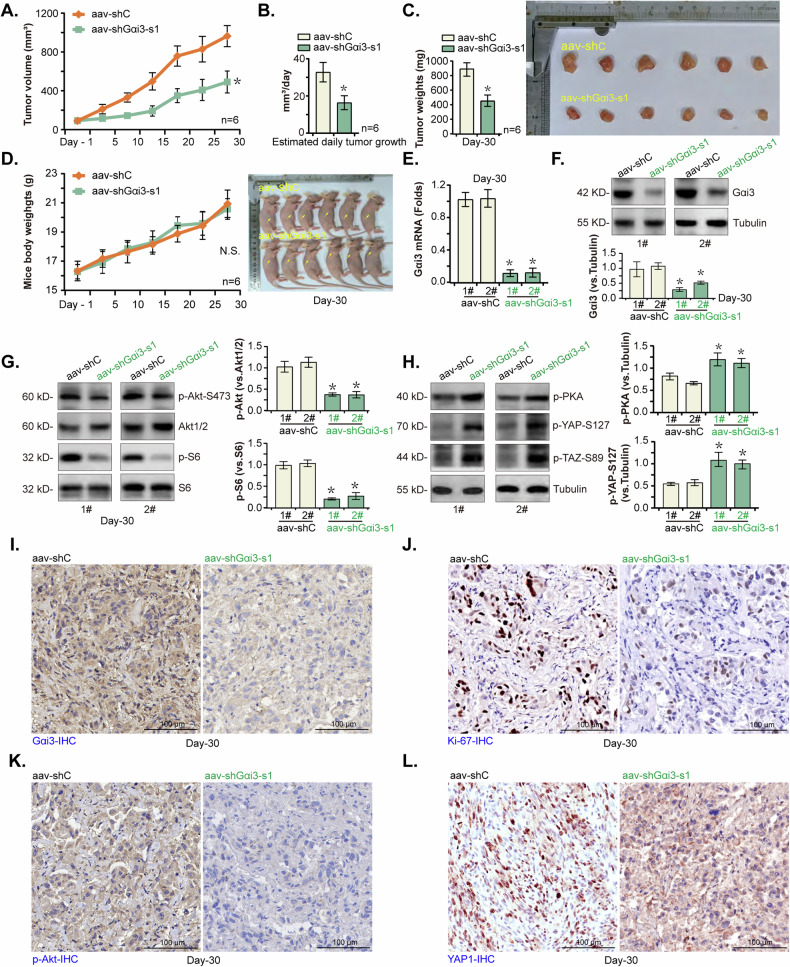
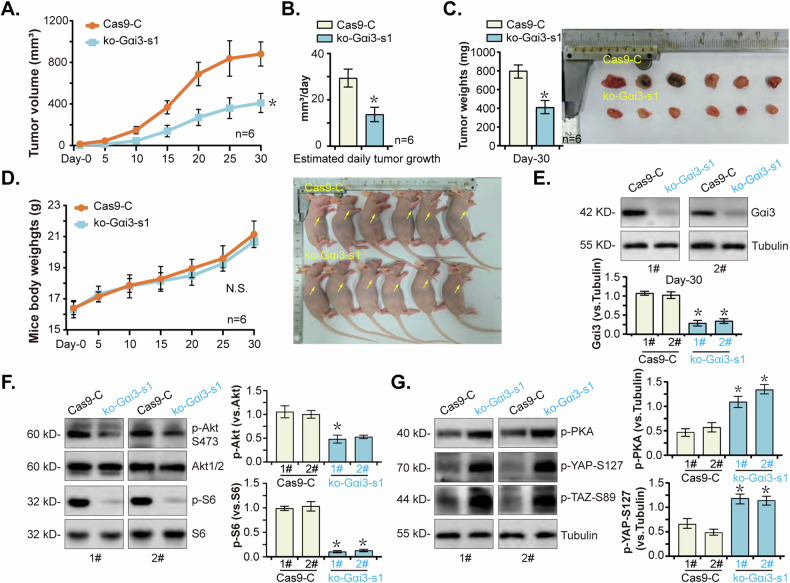
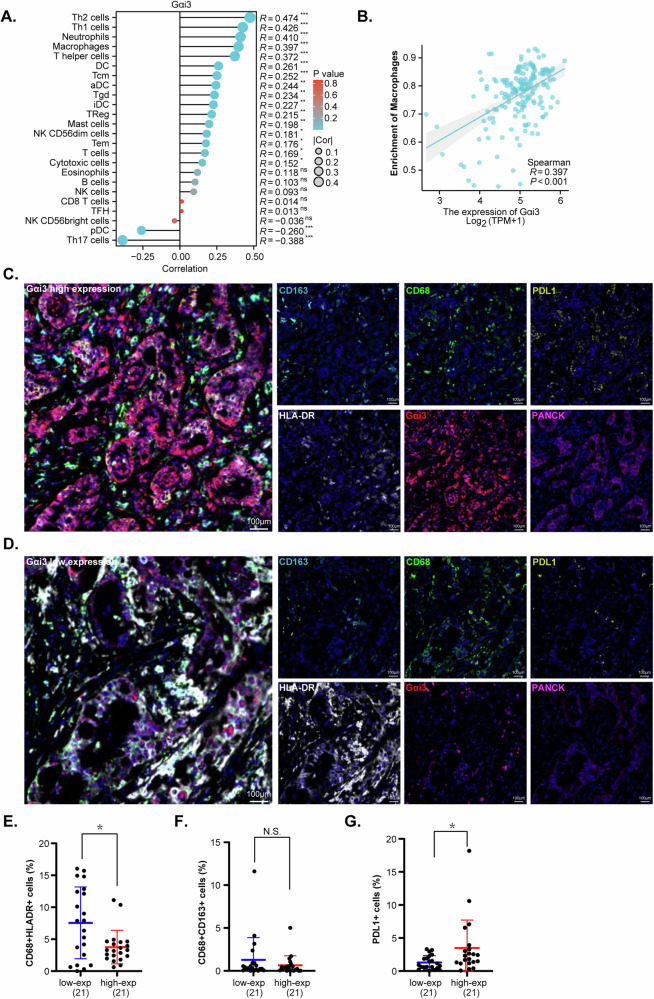
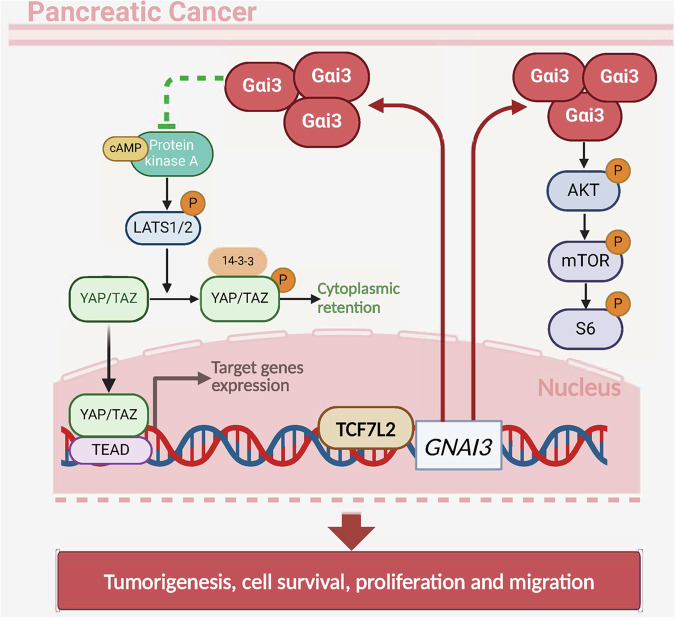
The increasing mortality rate of pancreatic cancer globally necessitates the urgent identification for novel therapeutic targets. This study investigated the expression, functions, and mechanistic insight of G protein inhibitory subunit 3 (Gαi3) in pancreatic cancer. Bioinformatics analyses reveal that Gαi3 is overexpressed in human pancreatic cancer, correlating with poor prognosis, higher tumor grade, and advanced classification. Elevated Gαi3 levels are also confirmed in human pancreatic cancer tissues and primary/immortalized cancer cells. Gαi3 shRNA or knockout (KO) significantly reduced cell viability, proliferation, cell cycle progression, and mobility in primary/immortalized pancreatic cancer cells. Conversely, Gαi3 overexpression enhanced pancreatic cancer cell growth. RNA-sequencing and bioinformatics analyses of Gαi3-depleted cells indicated Gαi3's role in modulating the Akt-mTOR and PKA-Hippo-YAP pathways. Akt-S6 phosphorylation was decreased in Gαi3-depleted cells, but was increased with Gαi3 overexpression. Additionally, Gαi3 depletion elevated PKA activity and activated the Hippo pathway kinase LATS1/2, leading to YAP/TAZ inactivation, while Gαi3 overexpression exerted the opposite effects. There is an increased binding between Gαi3 promoter and the transcription factor TCF7L2 in pancreatic cancer tissues and cells. Gαi3 expression was significantly decreased following TCF7L2 silencing, but increased with TCF7L2 overexpression. In vivo, intratumoral injection of Gαi3 shRNA-expressing adeno-associated virus significantly inhibited subcutaneous pancreatic cancer xenografts growth in nude mice. A significant growth reduction was also observed in xenografts from Gαi3 knockout pancreatic cancer cells. Akt-mTOR inactivation and increased PKA activity coupled with YAP/TAZ inactivation were also detected in xenograft tumors upon Gαi3 depletion. Furthermore, bioinformatic analysis and multiplex immunohistochemistry (mIHC) staining on pancreatic cancer tissue microarrays showed a reduced proportion of M1-type macrophages and an increase in PD-L1 positive cells in Gαi3-high pancreatic cancer tissues. Collectively, these findings highlight Gαi3's critical role in promoting pancreatic cancer cell growth, potentially through the modulation of the Akt-mTOR and PKA-Hippo-YAP pathways and its influence on the immune landscape.


Conflict of interest statement

The authors declare no competing interests.

Figures

Fig. 1
Fig. 1. The bioinformatic analysis supports Gαi3 overexpression in pancreatic cancer.
The Cancer Genome Atlas (TCGA) PAAD database shows the mRNA levels of Gαi3 (GNAI3) in pancreatic cancer tissues (“Tumor”, n = 171) and normal pancreatic tissues (“Normal”, n = 179) (A), and the Kaplan–Meier Survival analyses of overall survival (B), disease-specific survival (C), and progression-free survival (D) were performed based on Gαi3 expression in TCGA-PAAD dataset. The receiver operating characteristic(ROC) curves for evaluating the prognostic potential of Gαi3 overexpression in relation to the overall survival probability of pancreatic cancer patients were shown (EH). Subgroup analyses explore the correlation between Gαi3 expression levels and distinct clinical characteristics of pancreatic cancer patients (IL). “TPM” refers to transcripts per million, “AUC” denotes the area under the curve, “HR” represents the hazard rate, “TPR” is the true positive rate, and “FPR” stands for the false positive rate. *P < 0.05. “N.S.” stands for non-statistical difference (P > 0.05).
Fig. 2
Fig. 2. Gαi3 is overexpressed in pancreatic cancer tissues and different pancreatic cancer cells.
Immunohistochemistry (IHC) staining was performed on a tissue microarray from pancreatic cancer patients. Representative Gαi3 IHC images from four pancreatic cancer patients (Patient-1#/-2#/-3#/-4#) were displayed (A). A comprehensive evaluation of Gαi3 expression was conducted using IHC scores from the tissue microarray. Gαi3 expression levels in unpaired samples, comprising pancreatic cancer tissues (“T”, n = 85) and normal tissues (“N”, n = 81), and paired samples, comprising pancreatic cancer tissues (“T”, n = 79) and their corresponding normal tissues (“N”, n = 79, were shown (B, C). Subgroup analyses showed the Gαi3 expression in different clinical categories of pancreatic cancer patients (D, E). Kaplan Meier Survival analyses based on Gαi3 expression in pancreatic cancer patients were shown (F). Gαi3 mRNA (G) and protein (H) expression in the surgically-resected fresh pancreatic cancer tissues (“Ca”) and paired adjacent normal tissue (“ParaCa”) of a total of 18 different patients (n = 18) was tested, with results quantified. Gαi3 mRNA (I) and protein (J) expression in the described pancreatic cancer cells and primary human pancreatic epithelial cells (“pEpi”) was shown, with results quantified. The data were presented as mean ± standard deviation (SD). *P < 0.05 vs.“N” tissues/“ParaCa”/“pEpi”. #P < 0.05. Scale bar = 50 μm.
Fig. 3
Fig. 3. Gαi3 silencing by shRNA inhibits pancreatic cancer cell growth, cell cycle progression and mobility.
The primary priPC-1 cells, the immortalized BxPC-3 cells and primary human pancreatic epithelial cells (pEpi1 and pEpi3) underwent stable transfection with lentivirus carrying Gαi3-targeting shRNAs (“sh-Gαi3”, with s1/s2 representing two distinct sequences) or a scramble control shRNA (“shC”), listed genes and proteins were tested (A, B, I, J, N). Cells were further cultivated for applied periods, cell viability (CK, and P), proliferation (D, L, O), colony formation (E), cell cycle progression (F), migration (G and M), and invasion (H) were assessed. *P < 0.05 versus “shC” group. “N.S.” stands for P > 0.05. The experiments depicted in this figure were replicated five times (n = 5, biological repeats), consistently yielding similar results. Scale bar = 100 μm.
Fig. 4
Fig. 4. Gαi3 KO causes robust anti-pancreatic cancer cell activity.
Primary priPC-1 cells and immortalized BxPC-3 cells were subjected to transduction with two distinct lentiviral CRISPR/Cas9 constructs targeting Gαi3 for KO (“ko-Gαi3 “, with s1/s2 representing two distinct sgRNAs), in comparison to a control group transduced with an empty CRISPR/Cas9 vector (“Cas9-C”). Subsequently, stable cells were generated, and the listed proteins were evaluated (AG). Cells were then cultured for additional specified time periods, cell viability (BH), proliferation (CI), cell cycle progression (D), migration (EJ), and invasion (F) were tested, with results quantified. *P < 0.05 versus “Cas9-C” group. “N. S.” stands for P > 0.05. The experiments depicted in this figure were replicated five times (n = 5, biological repeats), consistently yielding similar results. Scale bar = 100 μm.
Fig. 5
Fig. 5. Ectopic Gαi3 overexpression induces pro-cancerous activity in pancreatic cancer cells.
The primary priPC-1 cells and the immortalized BxPC-3 cells, expressing a lentiviral construct encoding Gαi3 (“OE-Gαi3”) or the empty vector (“Vec”), were formed, and the expression of listed genes and proteins were tested (A, B, H, I); Cells underwent further cultivation for indicated time periods, cell viability (CJ), proliferation (DK), cell cycle progression (E), migration (FL), and invasion (G) were tested, with results quantified. *P < 0.05 versus “Vec” group. “N.S.” stands for P > 0.05. The experiments depicted in this figure were replicated five times (n = 5, biological repeats), consistently yielding similar results. Scale bar = 100 μm.
Fig. 6
Fig. 6. Gαi3 is crucial for the activation of Akt-mTOR in pancreatic cancer cells.
RNA-sequencing (RNA-seq) was employed to analyze the gene expression profile of priPC-1 cells following the knockdown of Gαi3 using shRNA (“sh-Gαi3-s1”) in contrast to cells treated with a non-specific scramble shRNA (“shC”). This comparison elucidated a set of differentially expressed genes (DEGs), as depicted in volcano plots (A). Kyoto Encyclopedia of Genes and Genomes (KEGG) pathway analysis of the DEGs in sh-Gαi3-s1-expressing priPC-1 cells is shown (B). Western blot analysis was performed to examine the activation states of AKT-mTORC1 signaling in priPC-1 cells bearing the described genetic modifications (C, D). priPC-1 cells with“sh-Gαi3-s1” were engineered to express either a constitutively active Akt1 mutant (caAkt1, S473D) or a control vector (“Vec”), expression of the described proteins was assessed in these cells (E); Cells were then cultured for 24-72 h, cell proliferation (F) and migration (G) were measured by the indicated experiments, with results quantified. *P < 0.05 versus “shC”/“Cas9-C”/“Vec” group. #P < 0.05. The experiments depicted in this figure were replicated five times (n = 5, biological repeats), consistently yielding similar results.
Fig. 7
Fig. 7. Gαi3 regulates PKA-Hippo-YAP signaling axis in pancreatic cancer cells.
The primary priPC-1 cells stably expressing the Gαi3 shRNA (“sh-Gαi3-s1”), the CRISPR/Cas9-Gαi3-KO construct (“ko-Gαi3-s1”), the Gαi3-expressing lentiviral construct (“OE-Gαi3”), alongside their respective controls (“shC”, “Cas9-C” or “Vec”) were established, and the expression of listed proteins were tested (AD). Primary priPC-1 cells stably expressing the Gαi3 shRNA (“sh-Gαi3-s1”), as well as the corresponding control (“shC”) underwent cytoplasmic/nuclear protein extraction, and listed proteins in the described cell fraction lysates were measured (E, F), cells were also subjected to immunofluorescence (IF) staining, with representative images presented (G). The priPC-1 cells expressingsh-Gαi3-s1 were treated with H-89 (a PKA inhibitor, 7 μM) or 0.1% DMSO as vehicle control (“Veh”), and expression of listed proteins was shown (HL). After specified cultivation periods, cell proliferation and migration were examined, with results quantified (I, J). The priPC-1 cells with“sh-Gαi3-s1” were engineered to express either a constitutively active Akt1 mutant (caAkt1, S473D) or a control vector (“Vec”), expression of the described proteins was assessed by Western blotting (K). The designations “Cyt” and “Nuc” refer to cytoplasmic and nuclear proteins, respectively. *P < 0.05 versus “shC”/“Cas9-C”/“Vec” group. #P < 0.05. Scale bars are provided as specified.
Fig. 8
Fig. 8. TCF7L2 is a key transcription factor of Gαi3 in pancreatic cancer cells.
The JASPAR database was employed to predict the putative transcription factors of Gαi3 (A). priPC-1 cells underwent transfection with siRNAs targeting various transcription factors, alongside a negative control siRNA (“siC”) for 48 h, Gαi3 mRNA level was subsequently tested (B). priPC-1 cells were modified to express either a lentiviral shRNA targeting TCF7L2 (“shTCF7L2”), a scramble control shRNA (“shC”), a lentiviral construct overexpressing TCF7L2 (“oeTCF7L2”), or an empty vector (“Vec”), and the expression of listed mRNAs and proteins was examined (CF). Chromatin immunoprecipitation (ChIP) assays presented the relative levels of TCF7L2-bound Gαi3 promoter in the listed pancreatic cancer cells and primary human pancreatic epithelial cells (“pEpi”) (G) as well as in the designated pancreatic cancer tumor tissues (“T”) and matched adjacent normal pancreatic tissues (“N”) (H), with results quantified. The data were presented as mean ± standard deviation (SD). *P < 0.05 versus “siC”/“shC”/“Vec” /“pEpi”/“ParaCa” tissues. The experiments depicted in this figure were replicated five times (n = 5, biological repeats), consistently yielding similar results.
Fig. 9
Fig. 9. Gαi3 shRNA suppresses pancreatic cancer xenograft growth in nude mice.
Mice bearing priPC-1 xenografts received intratumoral injections of adeno-associated virus (aav) expressing sh-Gαi3-s1 (“aav-shGαi3-s1”) or a scramble control shRNA (“aav-shC”), the volumes of the priPC-1 xenografts (A) and the mice body weights (D) were monitored and recorded at five-day intervals. The estimated daily priPC-1 xenograft growth was calculated (B). On the 30th day post-injection, all priPC-1 xenografts were excised and weighed (C). Tissue lysates from the harvested priPC-1 xenografts were obtained and expression of the listed mRNAs and proteins was tested (EH). Furthermore, sections from these xenografts were processed for immunohistochemistry (IHC) staining to visualize the expression of Gαi3 (I), Ki-67 (J), p-Akt (Ser-473) (K), and YAP1 (L). The presented results are expressed as the mean ± standard deviation (SD), with the study including six mice per experimental group (n = 6). *P < 0.05 versus “aav-shC” group. “N. S.” stands for P > 0.05. Scale bar = 100 μm.
Fig. 10
Fig. 10. Gαi3 KO impedes pancreatic cancer cell growth in vivo.
priPC-1 cells with the Gαi3 sgRNA1-expressing lenti-CRISPR/Cas9-KO construct (“ko-Gαi3-s1”) or the lenti-CRISPR/Cas9-KO construct (“Cas9-C”) were s.c. injected to flanks of the nude mice at a concentration of 20 million cells per mouse, with six mice included in each experimental group. The volumes of the priPC-1 xenografts (A) and the mice body weights (D) were monitored and recorded at five-day intervals. The daily growth rate of the priPC-1 xenografts was also assessed (B). Thirty days post-injection, the developed xenografts were surgically removed and tumor weights were recorded (C). Analysis of protein expression was conducted on tissue lysates derived from the harvested priPC-1 xenografts (EG). The data were presented as mean ± standard deviation (SD, n = 6). *P < 0.05 versus “Cas9-C” group. “N. S.” stands for P > 0.05.
Fig. 11
Fig. 11. Gαi3 expression is correlated with immune cell infiltration of pancreatic cancer.
Analysis based on TCGA-PAAD cohort shows the Gαi3’s association with various immune cell populations (A). The scatter plot shows the specific correlation between Gαi3 expression and the proportion of macrophages in pancreatic cancer tissues (B). Multiplex immunohistochemistry (mIHC) staining on tissue microarrays from pancreatic cancer patients, categorized by high (C) and low (D) Gαi3 expression levels, is presented alongside a color legend for the markers used. Different colors represent specific markers: Gαi3 in red, CD163 in turquoise, HLA-DR in white, CD68 in green, PANCK in pink, PDL1 in gold, and DAPI as the nuclear counter-stain. Quantitative analysis subsequent to the staining process allowed for the comparison of immune cell populations between the groups with high and low Gαi3 expression. The percentages of M1 macrophages (E), M2 macrophages (F), and PDL1 positive cells (G) were shown. The terms “low-exp” and “high-exp” are utilized to denote groups with low and high Gαi3 expression, respectively. *P < 0.05 versus “low-exp” group. “N. S.” stands for P > 0.05. Scale bar = 100 μm.
Fig. 12
Fig. 12. The proposed signaling carton of the present study.
The current study emphasizes the complex role of Gαi3 in promoting the growth of pancreatic cancer cells by regulating the Akt-mTOR and PKA-Hippo-YAP signaling pathways. TCF7L2 is a crucial transcription factor for Gαi3, driving its upregulation in pancreatic cancer.

References

    1. Klein AP. Pancreatic cancer epidemiology: understanding the role of lifestyle and inherited risk factors. Nat Rev Gastroenterol Hepatol. 2021;18:493–502. - PMC - PubMed
    1. Halbrook CJ, Lyssiotis CA, Pasca di Magliano M, Maitra A. Pancreatic cancer: advances and challenges. Cell. 2023;186:1729–54. - PMC - PubMed
    1. Siegel RL, Miller KD, Jemal A. Cancer statistics, 2020. CA: a cancer J clinicians. 2020;70:7–30. - PubMed
    1. Blackford AL, Canto MI, Klein AP, Hruban RH, Goggins M. Recent trends in the incidence and survival of stage 1a pancreatic cancer: a surveillance, epidemiology, and end results analysis. J Natl Cancer Inst. 2020;112:1162–9. - PMC - PubMed
    1. Neoptolemos JP, Kleeff J, Michl P, Costello E, Greenhalf W, Palmer DH. Therapeutic developments in pancreatic cancer: current and future perspectives. Nat Rev Gastroenterol Hepatol. 2018;15:333–48. - PubMed

Substances