. 2024 Sep 30;15(1):8452.
doi: 10.1038/s41467-024-52186-9.

The morphospace of the brain-cognition organisation

Affiliations

The morphospace of the brain-cognition organisation

Valentina Pacella et al. Nat Commun. .

Abstract

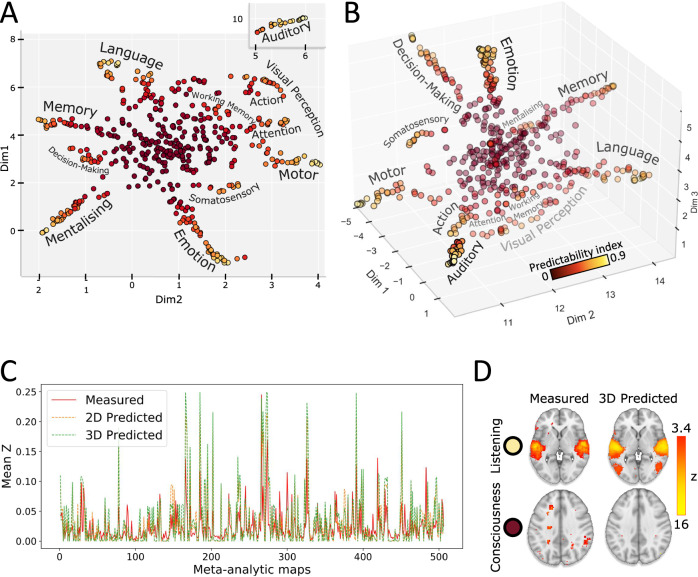
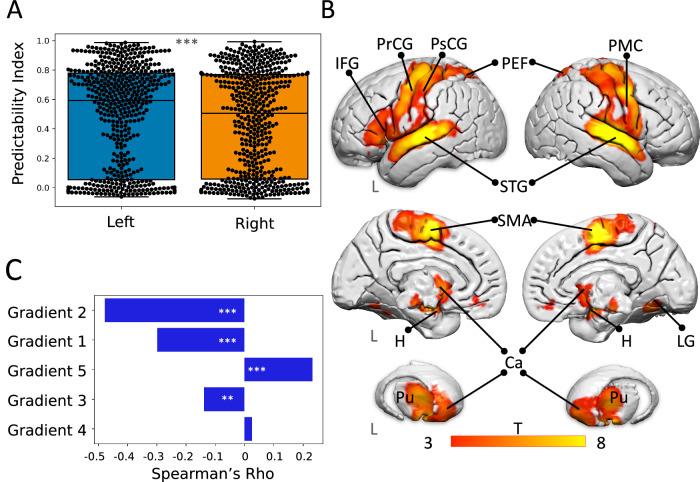
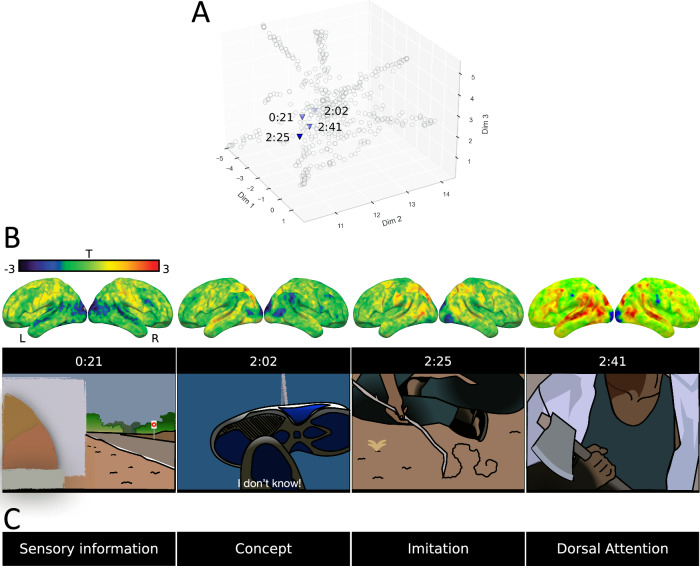
Over the past three decades, functional neuroimaging has amassed abundant evidence of the intricate interplay between brain structure and function. However, the potential anatomical and experimental overlap, independence, granularity, and gaps between functions remain poorly understood. Here, we show the latent structure of the current brain-cognition knowledge and its organisation. Our approach utilises the most comprehensive meta-analytic fMRI database (Neurosynth) to compute a three-dimensional embedding space-morphospace capturing the relationship between brain functions as we currently understand them. The space structure enables us to statistically test the relationship between functions expressed as the degree to which the characteristics of each functional map can be anticipated based on its similarities with others-the predictability index. The morphospace can also predict the activation pattern of new, unseen functions and decode thoughts and inner states during movie watching. The framework defined by the morphospace will spur the investigation of novel functions and guide the exploration of the fabric of human cognition.


Conflict of interest statement

The authors declare no competing interests.

Figures

Fig. 1
Fig. 1. The morphospace and the predictability index.
In the 2D (A) and 3D (B) morphospace, similar functional meta-analytic maps cluster together. The colour bar indicates the predictability index. Cognitive domains are indicated next to each branch. C Comparison between the measured maps and the 2D and 3D predicted maps’ mean z (see “Materials and Methods” for 4D, 5D comparison). D Representative examples of the best (listening) and worst (consciousness) measured (left) and predicted (right) pair of meta-analytic maps. The colour bar represents the z-statistic of voxels from the Neurosynth meta-analysis maps (measured) and voxels resulting from the voxel-wise linear regression (predicted). Source data are provided as a Source Data file.
Fig. 2
Fig. 2. Hemispheric and regional reliability of functional characterisation and their relationship with the data-driven domain-wise organisation of brain functions (i.e., resting-state fMRI gradients).
A The two-sided t-test shows the difference between the mean predictability index of the left (blue) and right (orange) hemispheres. ***, p < 0.001. Lines, boxes, whiskers and dots represent the median, quartiles, distribution, and observations (506 meta-analytic maps). B Left and right lateral (top), left and right medial (bottom) views and 3D reconstruction of the basal ganglia indicating the brain structures that are the most reliably characterised functionally (predictability map). The colour bar represents the t-statistics. C Two-sided Spearman correlation between the predictability map and the five resting-state fMRI gradients. *** = p < .001, ** = p = .004. Ca: caudate nucleus. H: hippocampus. IFG: inferior frontal gyrus. L: left hemisphere. LG: lingual gyrus. PEF: parietal eye field. PMC: premotor cortex. PrCG: precentral gyrus. PsCG: postcentral gyrus. Pu: putamen. SMA: supplementary motor area. STG: superior temporal gyrus. Source data are provided as a Source Data file.
Fig. 3
Fig. 3. The morphospace ability to predict unexplored functions.
The bar plots displayed on the left indicate the predictability index for (A) the Neuroquery meta-analytic maps, B Neurosynth meta-analytic maps reported after 2017, and (C) independent fMRI maps. These indices were calculated using Spearman rank correlation between predicted and measured activations. The colour for each new map’s bar plot corresponds to its five nearest neighbours’ (5nn) predictability index. The 888 new maps from Neuroquery (C) were summarised into 25 cognitive macro-categories via topic modelling (see “Materials and Methods”). The macro-categories are based on the terms most frequently associated in the literature with the 888 terms of interest. On the right panels, triangles indicate each new map’s coordinate in the morphospace, while transparent circles indicate the morphospace meta-analytic maps’ location. The “cool” palette characterises the new projected meta-analytic and single activation maps. Source data are provided as a Source Data file.
Fig. 4
Fig. 4. Illustration of the cognitive decoding of 4 representative neural activations during movie observation.
A The projections of the activation maps in the morphospace, triangles indicate each representative map’s coordinate in the morphospace, and transparent circles indicate the morphospace meta-analytic maps’ location. B Localisation of the activations on a brain template (top) and drawings representing the frames from the movie ‘Two Man’ eliciting the activations (bottom). C The cognitive terms whose meta-analytic map had the shortest Euclidean distance from each activation. The colour bar indicates the activations’ t-statistics. Source data are provided as a Source Data file.

References

    1. Parlatini, V. et al. Functional segregation and integration within fronto-parietal networks. Neuroimage146, 367–375 (2017). - PMC - PubMed
    1. Cohen, J. D. et al. Temporal dynamics of brain activation during a working memory task. Nat386, 604–608 (1997). - PubMed
    1. Coull, J. T. & Nobre, A. C. Where and when to pay attention: the neural systems for directing attention to spatial locations and to time intervals as revealed by both PET and fMRI. J. Neurosci.18, 7426–7435 (1998). - PMC - PubMed
    1. Corbetta, M. & Shulman, G. L. Control of goal-directed and stimulus-driven attention in the brain. Nat. Rev. Neurosci.3, 201–215 (2002). - PubMed
    1. Price, C. J. A review and synthesis of the first 20 years of PET and fMRI studies of heard speech, spoken language and reading. Neuroimage62, 816–847 (2012). - PMC - PubMed

Publication types

LinkOut - more resources