. 2024 Sep 30;15(1):8438.
doi: 10.1038/s41467-024-52862-w.

NEAT1 modulates the TIRR/53BP1 complex to maintain genome integrity

Affiliations

NEAT1 modulates the TIRR/53BP1 complex to maintain genome integrity

Susan Kilgas et al. Nat Commun. .

Abstract

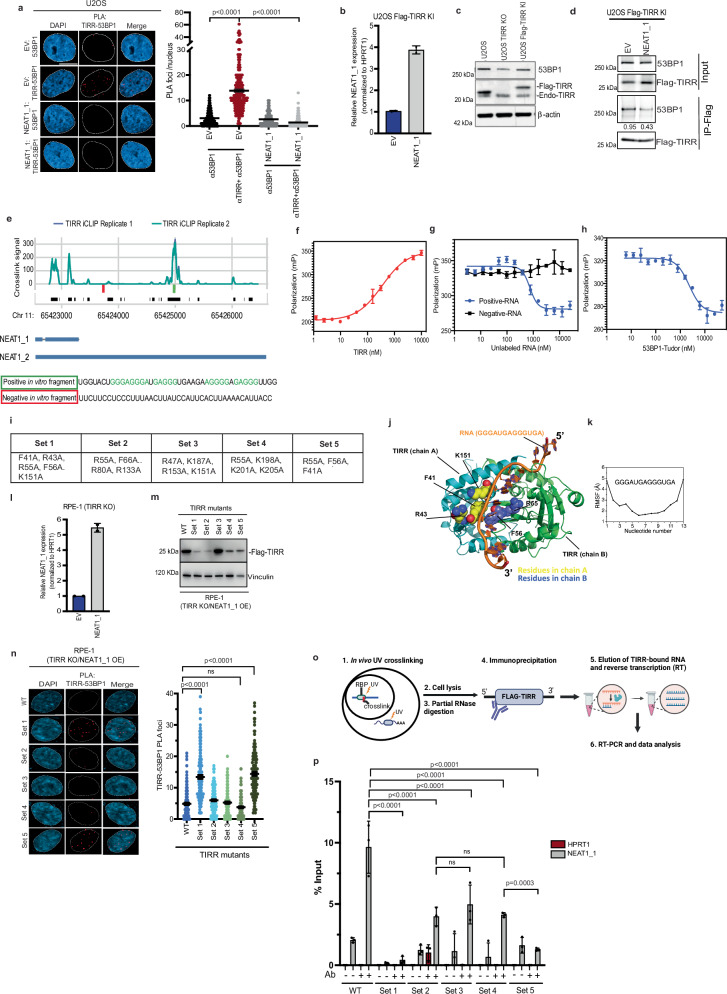
Tudor Interacting Repair Regulator (TIRR) is an RNA-binding protein (RBP) that interacts directly with 53BP1, restricting its access to DNA double-strand breaks (DSBs) and its association with p53. We utilized iCLIP to identify RNAs that directly bind to TIRR within cells, identifying the long non-coding RNA NEAT1 as the primary RNA partner. The high affinity of TIRR for NEAT1 is due to prevalent G-rich motifs in the short isoform (NEAT1_1) region of NEAT1. This interaction destabilizes the TIRR/53BP1 complex, promoting 53BP1's function. NEAT1_1 is enriched during the G1 phase of the cell cycle, thereby ensuring that TIRR-dependent inhibition of 53BP1's function is cell cycle-dependent. TDP-43, an RBP that is implicated in neurodegenerative diseases, modulates the TIRR/53BP1 complex by promoting the production of the NEAT1 short isoform, NEAT1_1. Together, we infer that NEAT1_1, and factors regulating NEAT1_1, may impact 53BP1-dependent DNA repair processes, with implications for a spectrum of diseases.


Conflict of interest statement

The authors declare no competing interests.

Figures

Fig. 1
Fig. 1. The LncRNAs NEAT1 and MALAT1 are the main RNA targets of TIRR.
a (Left) Immunoprecipitated TIRR-RNA complexes from iCLIP visualized on a nitrocellulose membrane after SDS-PAGE via the 3′end label that is ligated to RNA and Western blot. The visual shift of TIRR to a higher molecular weight is due to crosslinking of TIRR protein to labeled RNA. (Right) Western blot showing the migration position of TIRR protein. EV, empty vector. b A pie chart showing the regional distribution of TIRR RNA binding sites. UTR, untranslated region; CDS, coding sequence. c A scatter plot showing the enriched binding of NEAT1 and MALAT1 by TIRR. Average and library normalized (TPM) iCLIP crosslink counts at a whole gene level from two replicates are plotted against library normalized (TPM) RNA-seq whole gene read counts. Both data sets are log10 transformed. d Mapping of TIRR iCLIP crosslink count data onto NEAT1 (top track) and MALAT1 (bottom track) genome coordinates. The iCLIP crosslink signal was normalized by library size and plotted with smoothed lines. Chr, Chromosome. e CLIP RT-qPCR showing TIRR binding to NEAT1_1 but not NEAT1_2 region in U2OS cells; n = 3 independent experiments. Data represents mean ± SEM. Ordinary one-way ANOVA with Dunnett’s multiple comparisons. Ab, antibody. f (Left) Representative images of TIRR-53BP1 PLA foci in control (CT) or NEAT1 and MALAT1 CRISPRi U2OS cells. 53BP1-53BP1 PLA foci is a positive control. Scale bar, 10 μm. (Right) Quantifications of PLA. Data shown are the mean of at least n = 146 nuclei across n = 2 independent experiments ± SEM. Kruskal-Wallis test with Dunn’s multiple comparisons. g Mean NEAT1 (left) and MALAT1 (right) transcript levels by RT-qPCR, normalized to HPRT1. n = 3 independent experiments ± SD. Ordinary one-way ANOVA with Dunnett’s multiple comparisons. h Total protein levels of 53BP1 and TIRR by Western blot. Beta actin is loading control. n = 2 independent experiments. Source data are provided as a Source data file.
Fig. 2
Fig. 2. NEAT1 dissociates the TIRR/53BP1 complex in vivo and in vitro.
a (Left) Representative TIRR-53BP1 PLA foci in U2OS cells. Scale bar, 10 μm. EV, empty vector. (Right) Quantifications. Data shown are the mean of at least n = 246 nuclei across n = 3 independent experiments ± SEM. Kruskal-Wallis test with Dunn’s multiple comparisons. b NEAT1_1 RT-qPCR transcripts in indicated U2OS Flag-TIRR knock-in (KI) cells, normalized to HPRT1. n = 2 independent experiments. c Flag-TIRR KI Western Blot in U2OS cells. Beta-actin is loading control. d Flag-TIRR IP in indicated U2OS cells. n = 2 independent experiments. e Normalized iCLIP coverage tracks and genomic coordinates containing NEAT1_1 (n = 2 replicates). The motif track shows positions of G-rich clusters identified by PEKA. Red and green boxes: negative and positive RNA sequences used in vitro, respectively. Chr, chromosome. f Fluorescence polarization (FP) of FAM-NEAT1-RNA as a function of increasing TIRR concentration. FP of FAM-NEAT1-RNA/TIRR complex disruption from increasing concentrations of unlabeled RNA (g) or 53BP1 (h). f, h Represents mean ± SD (n = 3 independent experiments). i Selected amino acid mutations based on potential RNA-binding residues from TIRR surface. j Predicted structural model of a TIRR dimer bound to RNA using molecular-dynamic (MD) simulation-assisted modeling. Key interface residues indicated in spheres are mutated to alanine. k Root-mean-square fluctuation (RMSF) plot of each nucleotide in the TIRR-RNA complex derived from a 500-ns MD simulation. l NEAT1_1 RT-qPCR transcripts in indicated RPE-1 cells, normalized to HPRT1. n = 2 independent experiments. m TIRR WT or RBD mutant Western blot in indicated RPE-1 cells. Vinculin is loading control. n (Left) Representative TIRR-53BP1 PLA foci in indicated RPE-1 cells. (Right) Quantifications. Data shown are the mean of at least n = 128 nuclei across n = 3 biological replicates ± SEM. Kruskal-Wallis test with Dunn’s multiple comparisons. o CLIP RT-qPCR schematic. Created with BioRender.com released under a Creative Commons Attribution-NonCommercial-NoDerivs 4.0 International license. p CLIP RT-qPCR of NEAT1 binding to WT TIRR or RBD mutants in TIRR KO RPE-1 cells. Ab, antibody. HPRT1, housekeeping control. Data represents mean ± SEM (n = 3 independent experiments). Ordinary one-way ANOVA with Dunnett’s multiple comparisons. Source data are provided as a Source data file.
Fig. 3
Fig. 3. NEAT1 impacts 53BP1-dependent p53 activation and PARPi sensitivity.
a (Left) Representative images of 53BP1 and γH2AX foci in U2OS cells (1 Gy + 1 h). Scale bar, 10 μm. CT, control. b Quantifications of 53BP1 foci (left) and γH2AX foci (right). Data shown are the mean of at least n = 185 nuclei across n = 3 independent experiments ± SEM. Ordinary one-way ANOVA with Dunnett’s multiple comparisons. IR, ionizing radiation. c Cell survival of COV362 BRCA1-deficient cells with sgRNA-mediated NEAT1 downregulation (±TIRR siRNA) upon indicated doses of Olaparib. Empty control (CT) and NEAT1 non-targeting (NT) CT are negative controls. Data represents mean ± SEM (n = 3 independent experiments). Two-way ANOVA with Tukey’s multiple comparisons. Top row significance: CT vs NEAT1 knockdown (KD) #2; bottom row significance: CT vs NEAT1 KD #2 + siTIRR. d Mean NEAT1 transcript levels by RT-qPCR, normalized to HPRT1. n = 3 independent experiments ± SD. Ordinary one-way ANOVA with Dunnett’s multiple comparisons. EV empty vector. e Mean p21, BAX, and PUMA transcript levels by RT-qPCR in RPE-1 cells (±53BP1 siRNA), normalized to HPRT1. Cells were treated with Nutlin-3 (4 μM for 4 h). n = 3 independent experiments ± SD. Ordinary one-way ANOVA with Dunnett’s multiple comparisons. f Mean 53BP1 transcript levels by RT-qPCR in RPE-1 cells upon siRNA-mediated depletion of 53BP1, normalized to HPRT1. n = 3 independent experiments ± SD. Ordinary one-way ANOVA with Dunnett’s multiple comparisons. g (Left) Quantifications of senescent RPE-1 cells (β-galactosidase positive). Data shown are the mean of n = 18 (EV), n = 19 (TIRR KO), and n = 21 (NEAT1_1 overexpression) microscopy images counted over n = 2 biological replicates ± SEM. Kruskal–Wallis test with Dunn’s multiple comparisons. (Right) Representative images of β-galactosidase staining. Scale bar, 10 μm. Representative staining patterns are shown in cropped regions. Source data are provided as a Source data file.
Fig. 4
Fig. 4. TDP-43 represses the TIRR/53BP1 complex by promoting NEAT1_1.
a Representative images of RNA-FISH co-localization of two NEAT1 probes recognizing either the 5′ end of the transcript (green, NEAT1_1) or the long isoform (magenta, NEAT1_2) in U2OS cells. Scale bar, 5 μm. b Quantification of the percentage of cells in which NEAT1_1 was detected independently of NEAT1_2 in U2OS cells. Data shown are the mean of n = 371 (siControl) and n = 323 (siTDP-43) measurements across n = 3 biological replicates ± SEM. Two-tailed Mann–Whitney test. c Mean NEAT1 (total) and NEAT1_2 (long isoform) transcript levels by RT-qPCR in U2OS cells, normalized to HPRT1. n = 4 independent experiments ±SD. Ordinary one-way ANOVA with Dunnett’s multiple comparisons. d Representative images of the number of 53BP1 and γH2AX foci (1 Gy + 1 h) in U2OS cells. Scale bar, 5 μm. e Quantifications of 53BP1 (left) and γH2AX foci (right). Data shown are the mean of at least n = 254 nuclei across n = 3 biological replicates ± SEM. Two-tailed Mann–Whitney test. IR, ionizing radiation. f Representative images of TIRR-53BP1 PLA foci in TDP-43-depleted control (CT) or NEAT1 CRISPRi U2OS cells. Scale bar, 5 μm. g Quantifications of PLA. Data shown are the mean of at least n = 195 nuclei across n = 3 biological replicates ± SEM. Kruskal-Wallis test with Dunn’s multiple comparisons. h Representative images of the number of 53BP1 and γH2AX foci (1 Gy + 1 h) in TDP-43-depleted CT or NEAT1 CRISPRi U2OS cells. Scale bar, 5 μm. i Quantifications of 53BP1 (left) and γH2AX foci (right). Data shown are the mean of at least n = 226 nuclei across n = 3 biological replicates ± SEM. Kruskal–Wallis test with Dunn’s multiple comparisons. Source data are provided in a Source data file.
Fig. 5
Fig. 5. NEAT1-mediated 53BP1 regulation impacts DSB repair and end resection.
a Representative 53BP1 and γH2AX foci (1 Gy + 1 h) in S phase (EdU-positive) RPE-1 cells. Scale bar, 5 μm. EV empty vector. b 53BP1 (left) and γH2AX foci (right) quantifications. Data shown are the mean of at least n = 152 nuclei across n = 3 biological replicates ± SEM. Two-tailed Mann-Whitney test. IR, ionizing radiation. c Representative EdU-positive BrdU foci (2 Gy + 2 h) in RPE-1 cells. Scale bar, 5 μm. d BrdU foci quantifications. Data shown are the mean of at least n = 137 nuclei across n = 3 biological replicates ± SEM. Two-tailed Mann–Whitney test. e Representative EdU-positive RPA and γH2AX foci (2 Gy + 4 h) in RPE-1 cells. Scale bar, 5 μm. f Quantifications of RPA (left) and γH2AX (right) foci. Data shown are the mean of at least n = 137 nuclei across n = 3 biological replicates ± SEM. Two-tailed Mann–Whitney test. g Representative EdU-positive RAD51 and γH2AX foci (2 Gy + 4 h) in RPE-1 cells. Scale bar, 5 μm. h Quantifications of RAD51 (left) and γH2AX (right) foci. Data shown are the mean of at least n = 161 nuclei across n = 3 biological replicates ± SEM. Two-tailed Mann–Whitney test. i Representative RPA and γH2AX foci (2 Gy + 4 h) in indicated U2OS cells. Scale bar, 5 μm. j Quantifications of RPA (left) and γH2AX foci (right). Data shown are the mean of at least n = 282 nuclei across n = 3 biological replicates ±SEM. Kruskal–Wallis test with Dunn’s multiple comparisons. k Estrogen receptor (ER)-AsiSI schematic to measure single-stranded DNA (ssDNA) by qPCR. 4-OHT, 4-hydroxytamoxifen. Created with BioRender.com released under a Creative Commons Attribution-NonCommercial-NoDerivs 4.0 International license. l Percent ssDNA formation 4 h after 4-OHT treatment in U2OS ER-AsiSI cells (±NEAT1 antisense oligonucleotide (ASO)). Data represents mean ± SD (n = 3 independent experiments). Two-tailed unpaired t-test. m Mean NEAT1 RT-qPCR transcripts, normalized to HPRT1 control. n = 3 independent experiments ±SD. Two-tailed unpaired t-test. n Percent ssDNA formation as in (l) (±siTDP-43). Data represents mean ± SD (n = 3 independent experiments). Two-tailed unpaired t-test. Source data are provided as a Source data file.
Fig. 6
Fig. 6. NEAT1 modulates TIRR/53BP1 complex in a cell cycle-dependent manner.
a iCLIP analysis of TIRR binding to NEAT1 (±5 Gy IR). Scatter plot shows the log10 of average iCLIP crosslink counts at whole gene level for both the non-IR and IR-treated samples, normalized to library size. b (Left) Representative TIRR-53BP1 PLA foci in U2OS cells (1 Gy + 1 h). Scale bar, 10 μm. CT, control. (Right) Quantifications of the PLA foci. Data shown are the mean of at least n = 193 nuclei across n = 3 biological replicates ± SEM. Ordinary one-way ANOVA with Dunnett’s multiple comparisons. c Percentage of TIRR-53BP1 interaction after IR (1 Gy + 1 h) in indicated U2OS cells. n = 3 independent experiments. Data represents mean ± SEM. Ordinary one-way ANOVA with Dunnett’s multiple comparisons. d Co-IP of TIRR and 53BP1 interaction in U2OS cells across the cell cycle (±5 Gy). n = 2 independent experiments. e (Left) Representative co-localization images of NEAT1 probes (green, total NEAT1; magenta, NEAT1_2) in synchronized U2OS cells. NONO is a paraspeckle component. Scale bar, 5 μm. (Right) Percentage of NEAT1_1 signal in synchronized U2OS cells. Data shown are the mean of at least n = 324 nuclei across n=3 biological replicates ± SEM. Kruskal–Wallis test with Dunn’s multiple comparisons. f Percentage distribution of cell cycle phases by FACS in synchronized U2OS cells. n = 3 independent experiments. Data represents mean ± SEM. NS, non-synchronized. g Representative QIBC coupled to PLA profiles in indicated U2OS cells. h Quantifications of TIRR/53BP1 PLA foci by QIBC. Data shown are the mean of at least n = 69 nuclei across n = 3 biological replicates ± SEM. Kruskal–Wallis test with Dunn’s multiple comparisons. i Working model: NEAT1_1 is elevated in G1, dissociating the TIRR/53BP1 complex. This promotes 53BP1 recruitment to DSBs and a subsequent decrease in end resection and HR. In S phase, BRCA1 negatively regulates NEAT1 and the TIRR/53BP1 complex is more stable. 53BP1 recruitment to DSBs is restricted, thereby promoting end resection and HR. Created with BioRender.com released under a Creative Commons Attribution-NonCommercial-NoDerivs 4.0 International license. Source data are provided as a Source data file.

References

    1. Chapman, J. R., Sossick, A. J., Boulton, S. J. & Jackson, S. P. BRCA1-associated exclusion of 53BP1 from DNA damage sites underlies temporal control of DNA repair. J. Cell Sci.125, 3529–3534 (2012). - PMC - PubMed
    1. Zimmermann, M. & de Lange, T. 53BP1: pro choice in DNA repair. Trends Cell Biol.24, 108–117 (2014). - PMC - PubMed
    1. Bunting, S. F. et al. 53BP1 inhibits homologous recombination in Brca1-deficient cells by blocking resection of DNA breaks. Cell141, 243–254 (2010). - PMC - PubMed
    1. Daley, J. M. & Sung, P. 53BP1, BRCA1, and the choice between recombination and end joining at DNA double-strand breaks. Mol. Cell. Biol.34, 1380–1388 (2014). - PMC - PubMed
    1. Bryant, H. E. et al. Specific killing of BRCA2-deficient tumours with inhibitors of poly(ADP-ribose) polymerase. Nature434, 913–917 (2005). - PubMed

Publication types

MeSH terms

Associated data

LinkOut - more resources