. 2024 Sep 30;15(1):8439.
doi: 10.1038/s41467-024-52388-1.

CRISPR/Cas9 editing of NKG2A improves the efficacy of primary CD33-directed chimeric antigen receptor natural killer cells

Affiliations

CRISPR/Cas9 editing of NKG2A improves the efficacy of primary CD33-directed chimeric antigen receptor natural killer cells

Tobias Bexte et al. Nat Commun. .

Abstract

Chimeric antigen receptor (CAR)-modified natural killer (NK) cells show antileukemic activity against acute myeloid leukemia (AML) in vivo. However, NK cell-mediated tumor killing is often impaired by the interaction between human leukocyte antigen (HLA)-E and the inhibitory receptor, NKG2A. Here, we describe a strategy that overcomes CAR-NK cell inhibition mediated by the HLA-E-NKG2A immune checkpoint. We generate CD33-specific, AML-targeted CAR-NK cells (CAR33) combined with CRISPR/Cas9-based gene disruption of the NKG2A-encoding KLRC1 gene. Using single-cell multi-omics analyses, we identified transcriptional features of activation and maturation in CAR33-KLRC1ko-NK cells, which are preserved following exposure to AML cells. Moreover, CAR33-KLRC1ko-NK cells demonstrate potent antileukemic killing activity against AML cell lines and primary blasts in vitro and in vivo. We thus conclude that NKG2A-deficient CAR-NK cells have the potential to bypass immune suppression in AML.


Conflict of interest statement

E.U. has a sponsored research project with Gilead and BMS and acts as medical advisor of Phialogics and CRIION. T.O. has disclosures to Merck KGaA: Honoraria; Gilead: Research Funding; Merck KGaA: Research Funding; Roche: Honoraria. O.P. has received honoraria or travel support from Astellas, Gilead, Jazz, MSD, Neovii Biotech, Novartis, Pfizer, and Therakos, he has received research support from Gilead, Incyte, Jazz, Neovii Biotech, and Takeda and is member of advisory boards to Jazz, Gilead, MSD, Omeros, Priothera, Shionogi, and SOBI. N.M. is employee of Miltenyi Biotec. T.B., P.W., E.U. have filed patents on data partly published in this manuscript: PCT/EP2024/060767: Treatment of leukemia with engineered immune checkpoint inactivated CAR-NK cells and CAR-T cells (U31175WO). No competing interests exists for the remaining authors.

Figures
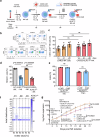
Fig. 1
Fig. 1. Generation process and evaluation of CRISPR/Cas9 knockout for CAR33-KLRC1ko-NK cells.
a Scheme of the in vitro generation of primary CAR33-KLRC1ko-NK cells. b Exemplary flow cytometry plots of CAR33 and NKG2A expression on modified NK cells. c Flow cytometry-based CAR33 surface expression analysis over time (n = 6–9). Mean ± SD. CAR33 vs CAR33-KLRC1ko: d14 (n = 0.1158), d21 (n = 0.1296), d28 (n = 0.8095). d Flow cytometric analysis of NKG2A expression following CRISPR/Cas9 knockout of the KLRC1 gene (n = 7). Mean ± SD. e Frequency of KLRC1 disruption on genomic level was evaluated by Inference of CRISPR Edits (ICE) and T7E1 assay for CAR-transduced (+CAR) and control NK cells (−CAR) (n = 3). Mean ± SD. f Insertion/deletion (indel) distribution profiles were shown for ICE analysis from three different donors (D1, D2, D3). g Expansion-fold and workflow of non-transduced (NT)-NK, KLRC1ko-NK, CAR33-NK and CAR33-KLRC1ko-NK cells generation in the presence of IL-2 (500 U/mL) and IL-15 (10 ng/ml Miltenyi Biotec or 50 ng/mL CellGenix) (n = 7). Mean ± SD (ns = 0.9991). Statistical analysis was performed using two-way ANOVA (c, g) and paired Student’s t test (d, e). The entity of n is biological replicates (from different healthy donors) (ce, g).
Fig. 2
Fig. 2. CAR33 expression and KLRC1 knockout induce changes in NK cell gene and but not in surface marker expression profiles.
a Scheme of the sorting strategy for NK single-cell analysis of the four different NK cells preparations. CAR-NK cells were sorted on CAR+, KLRC1ko-NK cells on NKG2A- and CAR33-KLRC1ko-NK cells on CD33+/NKG2A− NK cells prior to CITE-Seq analysis. b-d Overall transcriptional (RNA) changes in NK cells upon introduction of CAR33 (b), knockout of KLRC1 (c) and synergistic effects of CAR33 and knockout of KLRC1 (d). Statistical test: quasi-likelihood (QL) F-test against threshold (bd). Volcano plots show combined analysis of NK cells from donors D1 and D2 and indicate adjusted p-value (y-axis) and inferred logFC (x-axis) for each gene feature and for each genetic modification (CAR33 (b), KLRC1ko (c), synergistic effect of CAR33 and KLRC1ko (d)). Up- and down-regulated features are highlighted in color. The horizontal line indicated an FDR of 5% and the vertical lines delimit the range of logFC between −log2 (1.2) and log2 (1.2). Selected genes of interest are labeled. Statistical test: quasi-likelihood (QL) F-test against threshold. e Distribution of surface marker expression from CITE-seq data for the four cell preparations. Distributions are displayed as density, with an area under the curve normalized to 1. f Surface expression of different receptors of NK cells measured by flow cytometry. Representative histograms are shown.
Fig. 3
Fig. 3. CAR33- and CAR33-KLRC1ko-NK cell pools contain an increased fraction of cells with activated, mature NK cell phenotype.
a t-SNE representation of NK cells at single-cell level according to their combined RNA and protein expression profile. Cells are colored and faceted according to the different conditions (NT-NK, KLRC1ko-NK, CAR33-NK and CAR33-KLRC1ko-NK cells). b Principal component analysis of differently modified NK cell expression profiles following CITE-seq of two different donors. c Pooled subclustering of NK cell expression profiles from all conditions (t-SNE representation as in (a)). Louvain clustering on PCA results. d Relative abundance of cells belonging to the six clusters as percentage of all sequenced single cells. e Relative abundance of cells belonging to the 6 subclusters as fraction of the NK cell pools. For each NK cell pool (NT-NK, KLRC1ko-NK, CAR33-NK and CAR33-KLRC1ko-NK), the relative abundances over all clusters sum up to one. f Differential expression score of selected gene or protein features per cluster. The gene and protein features are grouped according to function (Checkpoint & Suppressive Regulators, Downstream TCR signaling, Lymphocyte Activation, Mature NK Cells). Each dot represents one gene or protein feature. The differential expression score of feature X in cluster Y is the mean expression of feature X over all cells in cluster Y divided by its mean over all cells in all other clusters (excluding cluster Y, displayed as log10). A score above zero indicates upregulation of a particular feature in a given cluster compared to the other clusters. Black squares indicate median differential expression score of its features (statistics are medians over genes). g Grouping of genes and proteins according to their function. A description of each group and their associated features is shown. a, cf Representative analysis of cells from donor D1.
Fig. 4
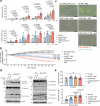
Fig. 4. KO of inhibitory receptor NKG2A (KLRC1) boosts anti-AML activity of CAR33-KLRC1ko-NK cells in vitro.
a Short-term (4 h) and long-term (24 h) flow cytometry-based killing assay of NK cells against CD33+/HLA-E+ OCI-AML2 cells at indicated E:T ratios (n = 5). Mean ± SD. b Dynamic monitoring of CAR33-KLRC1ko-NK-mediated killing using an IncuCyte-S3 imager. CAR33-KLRC1ko-NK cells were co-cultured with GFP+ OCI-AML2 cells for 26.5 h and the fluorescence emission was measured over time (OCI-AML2 only condition n = 3; rest n = 4). Median + range. c Representative images taken after 24.5 h of IncuCyte analysis of NT-NK, KLRC1ko-NK, CAR33-NK and CAR33-KLRC1ko-NK cells co-cultured with GFP+ OCI-AML2 cells (E:T = 0.5:1). Viable tumor cells are shown in green based on their GFP expression. Apoptotic tumor cells are labeled red by Annexin V staining. For imaging, the IncuCyteS3 platform was used. d Caspase-cleavage in survived and sorted OCI-AML2 cells following 2 h NK cell co-culture was analyzed using western blot (one representative experiment of 3 is shown; “clvd” = “cleaved”, “ctrl” = “control”). e qPCR gene expression analysis of NT-, KLRC1ko-, CAR33- and CAR33-KLRC1ko-NK cells following 2 h co-cultured with OCI-AML2 cells (E:T = 3:1) (n = 5). Mean of technical triplicates ± SD. Statistical analysis was performed by two-way ANOVA (a), paired Student’s t test (b), paired Wilcoxon (e). The entity of n is biological replicates (from different healthy donors) (a, b, e).
Fig. 5
Fig. 5. HLA-E is a homogenously expressed target in AML-patients and CAR33-KLRC1ko-NK cells demonstrated superior killing capacity against patient-derived blasts cells ex vivo.
a Scheme of workflow for AML patient preparation and co-incubation with healthy donor NK cells followed by functional read out of lysed patient-derived bone marrow (BM) cells. b Rank plot-visualization of coefficients of variation (CV). Every point is a protein’s CV ranked by increasing order. HLA-E is highlighted. c PCA scatter plot of the first two principal components (PCs) colored by HLA-E intensity. Every point is a sample. d Heatmap of adjusted -values from a non-parametric Kruska–Wallis test comparing HLA-E intensity over categories: de novo AML (de novo vs. secondary vs. therapy-related, adj. p-value = 1.0), NPM1 (mutated vs. wild type, adj.p-value = 1.0), FLT3 (ITD vs. TKD vs. wild type, adj.p-value = 1.0), FAB (MO to M7, adj.p-value = 1.0), Age group (<50 vs. 50-65 vs. >65, adj.p-value = 1.0), ELN 2017 (favorable vs. intermediate vs. adverse, adj.p-value = 1.0), Sex (female vs. male, adj.p-value = 0.37). e CD33 expression, HLA-E expression and CD45dim AML-blast expression of one representative primary BMC sample of AML patient day one post-thawing (one day before co-culture with NK cells) were analyzed by flow cytometry. f, g 4 h flow-cytometry-based killing assay of NK cells against primary AML patient material (f) and material from patients with high-risk molecular subsets (g). Due to partially high rates of spontaneous lysis of patient material post-thawing, the specific killing of viable AML cells is displayed. Mean of technical replicates of AML cell lysis by different NK cell donors (Donor 1-20) are shown for each AML patient #1–10 (f, g).
Fig. 6
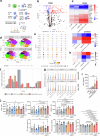
Fig. 6. CAR33- and CAR33-KLRC1ko-NK cells show preserved activation state and distinct gene expression profiles following AML cell contact.
a Scheme of the sorting strategy for NK single-cell analysis post-co-culture is shown. CAR-NK cells were sorted on CAR+, KLRC1ko-NK cells on NKG2A- and CAR33-KLRC1ko-NK cells on CD33+/NKG2A- NK cells following 2 h co-culture with OCI-AML2 cells. b Overall transcriptional (RNA) changes in all NK cell pools after co-culture with OCI-AML2 cells. Volcano plot as in Fig. 2bd. c Heatmap showing the logarithmic fold change of selected differentially expressed genes and proteins after contact with OCI-AML2 cells compared to before contact in each NK cell pool. A positive logFC represents an upregulation of the gene after co-culture when compared to its expression before co-culture. d Pooled subclustering of single cells from all NK cell pools after co-culture (t-SNE representation). Louvain clustering on PCA results. e Dot plots illustrating expression of genes and surface markers of interest across the 6 subclusters of NK cells after co-culture with OCI-AML2 cells. Color scale: the unit of measurement is average of log-transformed normalized expression values. f Relative abundance of cells belonging to the 6 subclusters as fraction of the NK cell pools after co-culture. For each NK cell pool (NT-NK, KLRC1ko-NK, CAR33-NK and CAR33-KLRC1ko -NK), the relative abundances over all clusters sum up to one. g Expression values of IFNG, TOP2A and AURKB are compared between the 4 conditions (NT-NK, KLRC1ko-NK, CAR33-NK and CAR33-KLRC1ko-NK) of different NK cell pools before and after co-culture with OCI-AML2 cells. h Heatmap showing the logarithmic fold change of IFNG, TOP2A and AURKB and proteins after contact with OCI-AML2 cells compared to before NK cell contact in each NK cell pool (as in (c)). i INF-γ levels in supernatants of 4 h co-cultures of NK cells with OCI-AML2 (n = 3, biological replicates from different healthy donors). j Analyses of NK cell receptor expression after 24 h of co-culture with OCI-AML tumor cells was measured by flow cytometry (n = 3 donors). Mean ± SD. (b) shows combined data on donors D1 and D2. (cg) show the representative analysis of cells from donor D1. Statistical analysis was performed by paired Student’s t test (i) and two-way ANOVA (j).
Fig. 7
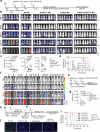
Fig. 7. Low doses CAR33-KLRC1ko-NK cells in an OCI-AML2-xenograft NSG-SGM3 mouse model show improved efficacy compared to KLRC1ko-NK or CAR33-NK cells.
a Scheme of the in vivo evaluation of a triple injection treatment with CAR33-KLRC1ko-NK cells (three doses with 5 × 10⁶ cells intravenously) together with a subcutaneous treatment with IL-2 in OCI-AML2 (Luc+) xenograft NSG-SGM3 mouse model. b BLI images of differently treated OCI-AML2 (Luc+) engrafted NSG-SGM3 mice over time (n = 4–9). Mice received three doses of 5 × 10⁶ NK cells on day 3, day 7 and day 10 post-AML cell injection. c Total flux analysis (photons/second) mice (n = 4–9). Mean ± SD. d Survival and leukemic burden of OCI-AML2 engrafted mice was observed over 36 days. e Scheme of the in vivo evaluation of a double injection treatment with CAR33-KLRC1ko-NK cells (two doses with 3 × 10⁶ cells intravenously) together with a subcutaneous treatment with IL-2 in OCI-AML2 (Luc+) xenograft NSG-SGM3 mouse model. f BLI images of differently treated OCI-AML2 (Luc+) engrafted NSG-SGM3 mice over time (n = 3–4). Mice received two doses of 3 × 10⁶ NK cells on day 3 and day 10 post-AML cell injection. g Total flux analysis (photons/s) mice (n = 3–4). Mean ± SD. h Scheme of in vivo bone marrow (BM) re-engraftment experiment. BM cells of NK treated animals (previously untreated (UT), non-transduced (NT)-NK, KLRC1ko-NK, CAR33-NK and CAR33-KLRC1ko-NK treated animals) were isolated at day 18, pooled, and injected into new NSG-SGM3 mice (5 × 10⁶ cells/animal; n = 2–6). i Survival and leukemic burden of BM re-engrafted mice was observed over 120 days (animal protocol: endpoint of the experiment). j Representative confocal microscopy analysis of GFP+ AML cells in BM histology d18 post-AML cell injection. Statistical analysis was performed two-way ANOVA (c, g) and Kaplan–Meier (Log-rank (Mantel–Cox) test) (d, i).

References

    1. Albinger, N., Hartmann, J. & Ullrich, E. Current status and perspective of CAR-T and CAR-NK cell therapy trials in Germany. Gene Ther.28, 513–527 (2021). - PMC - PubMed
    1. Maude, S. L. et al. Tisagenlecleucel in children and young adults with B-cell lymphoblastic leukemia. N. Engl. J. Med.378, 439–448 (2018). - PMC - PubMed
    1. Munshi, N. C. et al. Idecabtagene vicleucel in relapsed and refractory multiple myeloma. N. Engl. J. Med.384, 705–716 (2021). - PubMed
    1. Bouchkouj, N. et al. FDA approval summary: brexucabtagene autoleucel for treatment of adults with relapsed or refractory B-cell precursor acute lymphoblastic leukemia. Oncologist27, 892–899 (2022). - PMC - PubMed
    1. Maude, S. L. et al. Chimeric antigen receptor T cells for sustained remissions in leukemia. N. Engl. J. Med.371, 1507–1517 (2014). - PMC - PubMed

Publication types

MeSH terms

Substances

Associated data