. 2024 Sep 30;15(1):8447.
doi: 10.1038/s41467-024-52615-9.

The estrogen response in fibroblasts promotes ovarian metastases of gastric cancer

Affiliations

The estrogen response in fibroblasts promotes ovarian metastases of gastric cancer

Simeng Hu et al. Nat Commun. .

Abstract

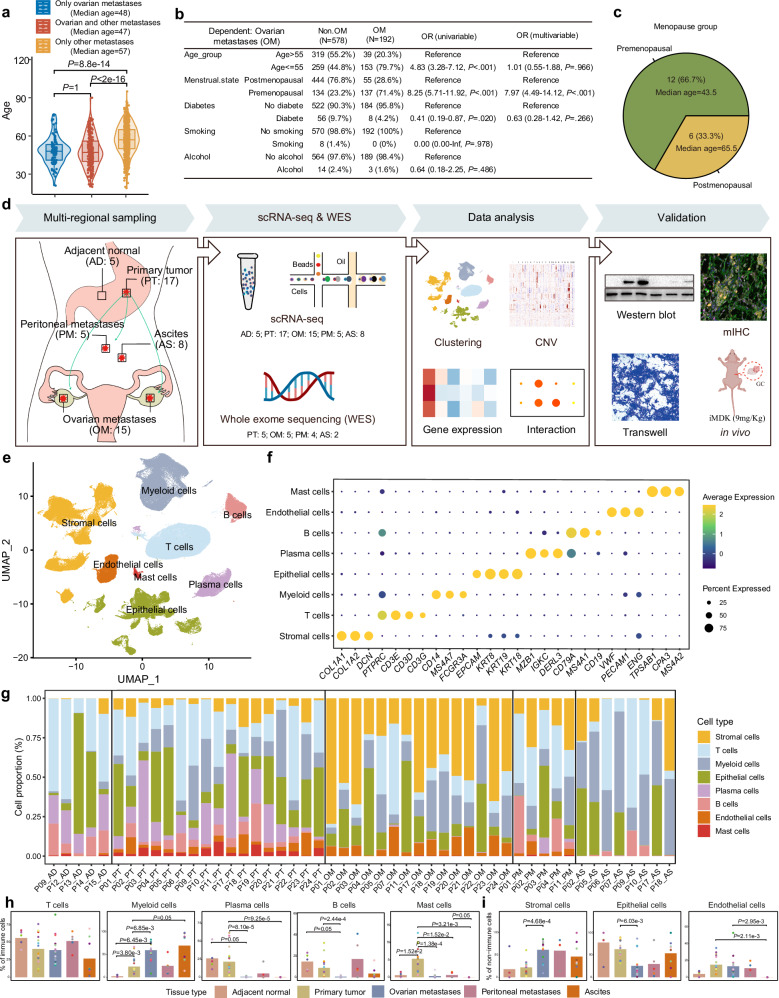
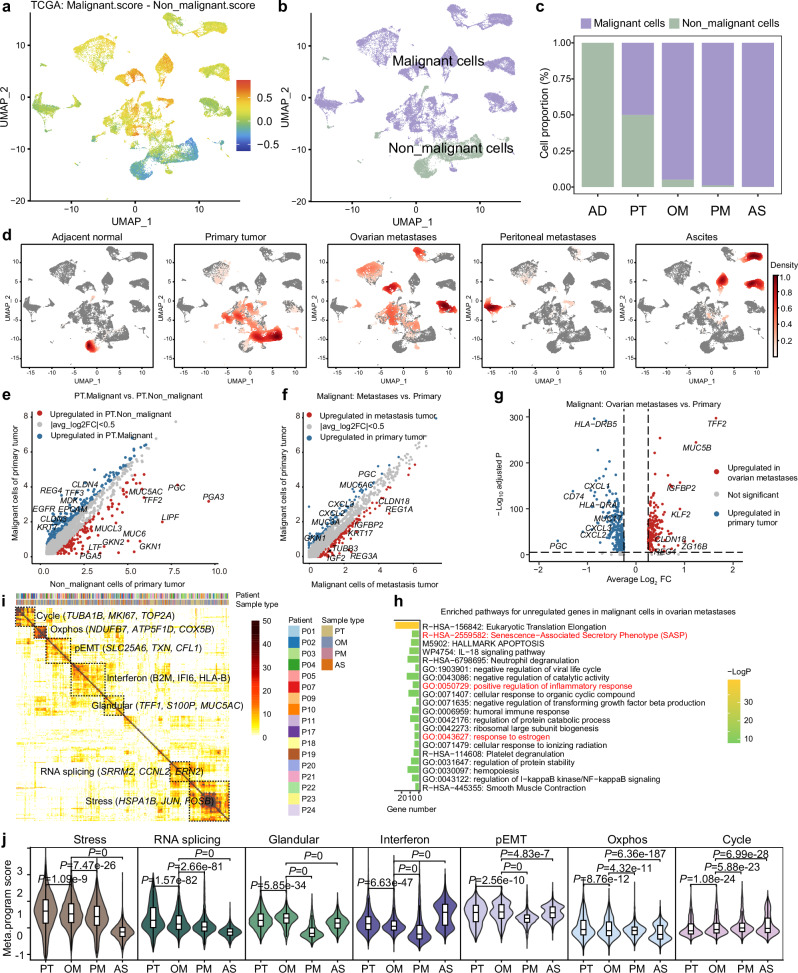
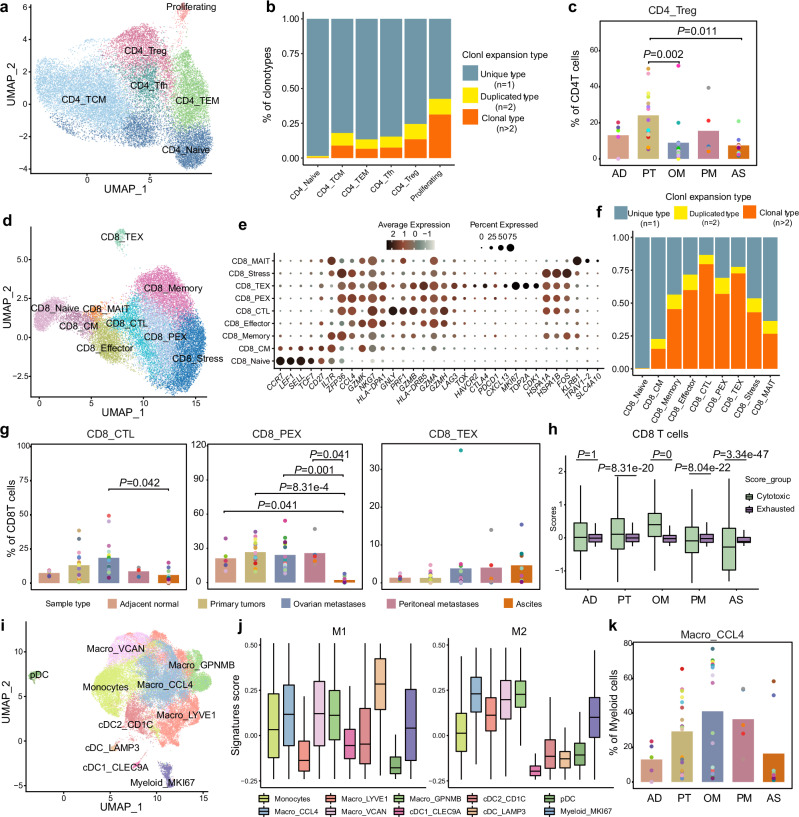
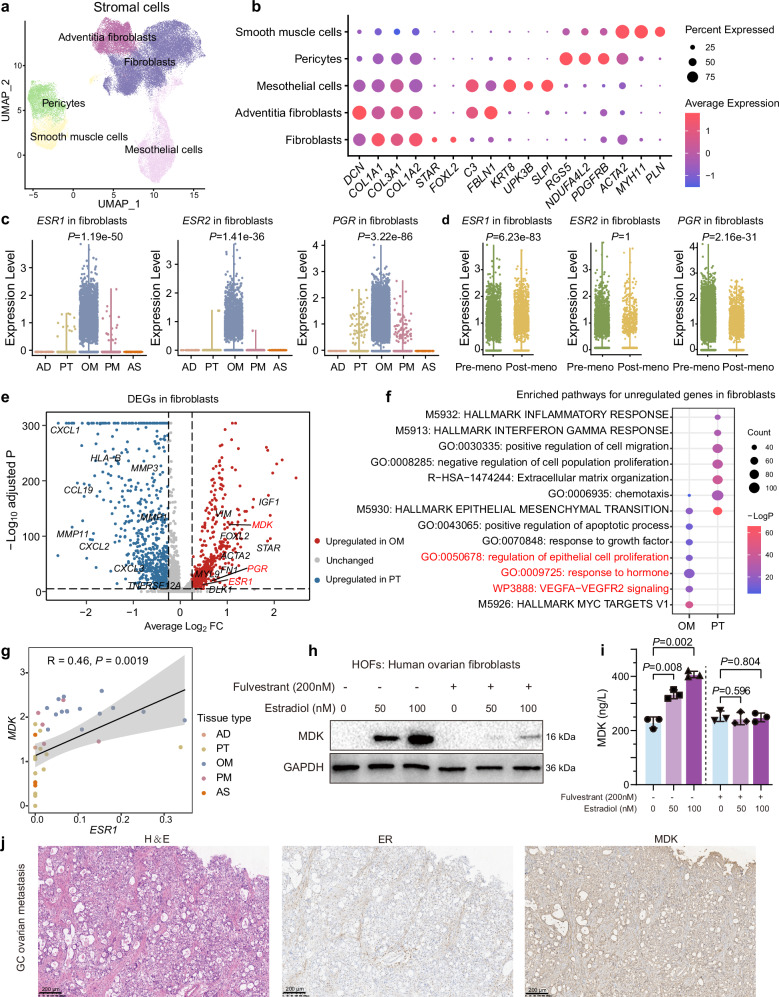
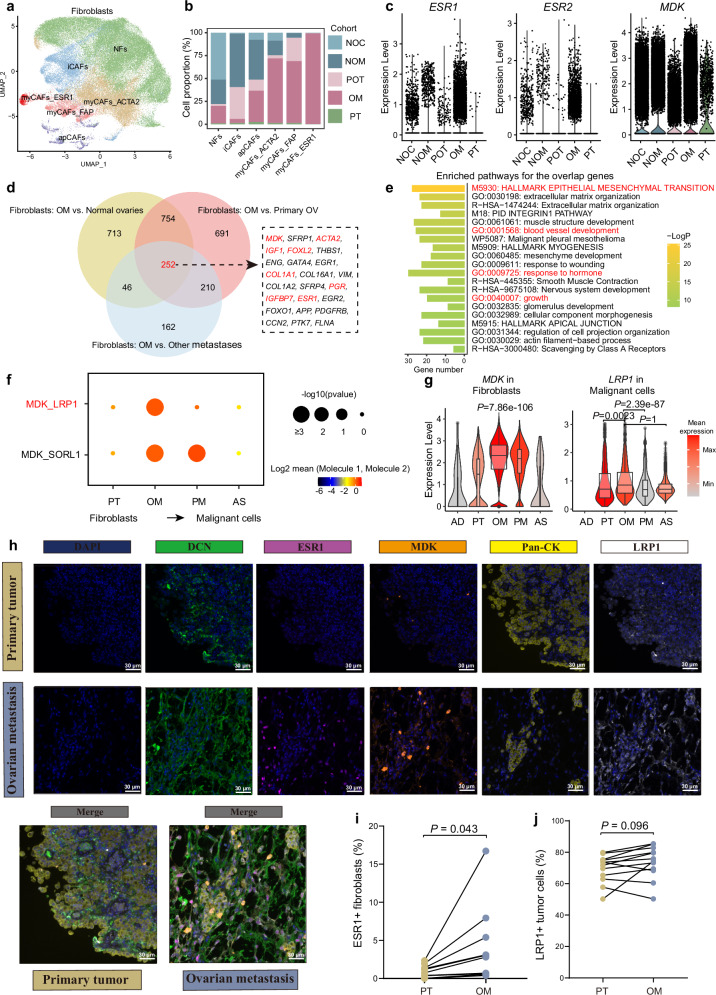
Younger premenopausal women are more prone to developing ovarian metastases (OM) of gastric cancer (GC) than metastases of other organs; however, the molecular mechanisms remain unclear. Here we perform single-cell RNA sequencing on 45 tumor samples from 18 GC patients with OM. Interestingly, fibroblasts in OM of GC express high levels of estrogen receptor (ER) and midkine (MDK), interacting with tumor cells through activating ER-MDK-LRP1 (low-density lipoprotein receptor-related protein 1) signaling axis. Functional experiments demonstrate that estrogen stimulation induces MDK secretion by ovarian fibroblasts, and binding of MDK to LRP1 increases GC cell migration and invasion. Furthermore, in vivo, estrogen stimulation remarkably augments ovarian engraftment and metastasis of LRP1+ GC cells. Collectively, our findings reveal that ER+ ovarian fibroblasts secrete MDK under estrogen influence, driving OM of GC via the MDK-LRP1 axis. Our study holds the potential to catalyze innovative therapeutic strategies aimed at intercepting and managing OM in GC.


Conflict of interest statement

The authors declare no competing interests.

Figures

Fig. 1
Fig. 1. Overview of the workflow and single-cell transcriptomic landscape of OM of GC.
a Violin and box plots showing the median age of patients with only OM (n = 100 patients), patients with ovarian and other metastases (n = 207 patients), and patients with only other metastases (n = 720 patients). The center line of the box represents the median value, the upper and lower limits of the box represent the 25th and 75th percentile points. b Univariate and multivariate logistic regression analysis of the risk factors for the development of OM. Wald test. c Pie chart showing the percentage and median age of premenopausal and postmenopausal patients in our scRNA-seq cohort. d Overview of the workflow and experimental design for scRNA-seq and WES. Mouse model diagram created in BioRender. Hu, C. (2021) BioRender.com/z48q170 released under a Creative Commons Attribution-NonCommercial-NoDerivs 4.0 International license. e UMAP plot showing the clustering of eight major cell types among 227,836 high-quality single cells. The colors represent the major cell types. f Dot plot showing the highly expressed marker genes in each major cell type. The dot size represents the percentage of cells expressing the marker genes in each major cell type, and the dot color represents the average expression level of the marker genes in each cell type. g Stacked histogram showing the relative percentages of major cell types in each sample. h Bar graph showing the percentage of T cells, myeloid cells, plasma cells, B cells, and mast cells among the total immune cells in different sample types. Each point indicates each sample (n = 50 samples from 22 patients). i Bar graphs showing the percentage of stromal cells, epithelial cells, and endothelial cells among the total non-immune cells in different sample types. Each point indicates each sample (n = 50 samples from 22 patients). In a, h, i, Wilcoxon rank sum test followed by Bonferroni’s multiple-comparison test. In h and i, filtering out non-significant values when displaying significance levels. Source data are provided as a Source Data file.
Fig. 2
Fig. 2. Classification of malignant and non-malignant epithelial cells and their heterogeneity and consistency.
a UMAP plot showing the malignant minus non-malignant scores of epithelial cells. b UMAP plot showing the distribution of malignant and non-malignant epithelial cells. Purple indicates malignant epithelium, while green indicates non-malignant epithelium. c Stacked histogram showing the relative percentages of malignant and non-malignant epithelial cells among the total epithelial cells in different sample types. d UMAP plots showing the density of epithelial cells in different sample types. e Scatterplot showing the differentially expressed genes (DEGs) between primary malignant and non-malignant cells. The X-axis indicates the log2 (mean+1) in primary non-malignant cells, while the Y-axis indicates the log2 (mean+1) in primary malignant cells. f Scatterplot showing the DEGs between primary and metastatic malignant cells. The X-axis indicates the log2 (mean+1) in metastatic malignant cells, while the Y-axis indicates the log2 (mean+1) in primary malignant cells. g Volcano plot showing the DEGs between primary and OM malignant cells. h Bar graphs showing the significantly enriched pathways of genes highly expressed in OM malignant cells. Hypergeometric test; P < 0.01. i Heatmap showing hierarchical clustering based on the number of genes shared by two programs derived from NMF analysis. Each dot represents one program from an individual sample. Seven highly correlated meta-programs were identified. *two programs share more than 20 genes. j Violin and box plots showing the scores of seven meta-programs in malignant cells from PT, OM, PM, and AS (n = 29,592 cells). The center line of the box represents the median value, the upper and lower limits of the box represent the 25th and 75th percentile points. In eg and j, Wilcoxon rank sum test followed by Bonferroni’s multiple-comparison test. In c, i and j, AD adjacent normal gastric tissues, PT primary gastric tumors, OM ovarian metastases, PM peritoneal metastases, AS ascites samples.
Fig. 3
Fig. 3. The cellular state and function of CD4+ T cells, CD8+ T cells, and myeloid cells.
a UMAP plot showing the distribution of CD4+ T cell subsets. b Bar graphs showing the percentages of TCR expanded clonotypes in the CD4+ T cell subsets. c Bar graphs showing the percentage of Tregs (CD4-Treg) among the total CD4+ T cells in different sample types (n = 50 samples from 22 patients). d UMAP plot showing the distribution of CD8+ T cell subsets. e Dot plot showing the highly expressed marker genes in each CD8+ T cell subset. The dot size represents the percentage of cells expressing the marker genes in each cell type, and the dot color represents the average expression level of the marker genes in each cell type. f Bar graphs showing the percentages of TCR expanded clonotypes in the CD8+ T cell subsets. g Bar graphs showing the percentages of cytotoxic CD8+ T cells (CD8-CTL), precursor exhausted CD8+ T cells (CD8-PEX), and transitory exhausted CD8+ T cells (CD8-TEX) among the total CD8+ T cells in different sample types (n = 50 samples from 22 patients). h Box plots showing the cytotoxic score and exhausted score in CD8+ T cells from different sample types (n = 22,813 cells). i UMAP plot showing the distribution of myeloid cell subsets. j Box plots showing the M1 scores (left) and M2 scores (right) in myeloid cell subsets (n = 42,618 cells). k Bar graphs showing the percentage of Macro_CCL4 among the total myeloid cells in different sample types (n = 50 samples from 22 patients). In h and j, the center line of the box represents the median value, the upper and lower limits of the box represent the 25th and 75th percentile points. In c, g, h and k, Wilcoxon rank sum test followed by Bonferroni’s multiple-comparison test. In c, g, and k, filtering out non-significant values when displaying significance levels. Source data are provided as a Source Data file. In c, h and k, AD adjacent normal gastric tissues, PT primary gastric tumors, OM ovarian metastases, PM peritoneal metastases, AS ascites samples.
Fig. 4
Fig. 4. Ovarian fibroblasts expressing ER and PR may promote tumor colonization and proliferation.
a UMAP plot showing the distribution of stromal cell subsets. b Dot plot showing the highly expressed marker genes in each stromal cell type. The dot size represents the percentage of cells expressing the marker genes in each stromal cell type, and the dot color represents the average expression level of the marker genes in each cell type. c Violin plots showing the expression levels of ESR1, ESR2, and PGR in fibroblasts from different sample types. d Violin plots showing the expression levels of ESR1, ESR2, and PGR in fibroblasts from the premenopausal and postmenopausal groups. Pre-meno, premenopausal groups; Post-meno, postmenopausal groups. e Volcano plot showing the DEGs between fibroblasts of PT and OM. f Dot plots showing the significantly enriched pathways of genes highly expressed in fibroblasts of OM and PT. Hypergeometric test; P < 0.01. g Scatter plot showing Pearson’s correlation between the average RNA levels of MDK and ESR1 in fibroblasts in each sample. Shade represents 95% confidence interval (R = 0.46; 95% CI = 0.19–0.67). Two-sided Student’s t-test. Western blot images (h) and quantitative analysis (i) showing the levels of MDK secreted by human ovarian fibroblasts (n = 3 experiments). Error bars represent mean ± standard deviations. One-way ANOVA followed by Bonferroni’s multiple-comparison test. Without Fulvestrant: Estradiol 0 nM vs. 50 nM: Mean difference (MD) = −104.09230 [95% CI: −165.7119, −42.4727]. Estradiol 0 nM vs. 100 nM: MD = −177.30071 [95% CI: −240.1326,−114.4688]. With Fulvestrant: Estradiol 0 nM vs. 50 nM: MD = 8.91347 [95% CI: −30.0585, 47.8854]. Estradiol 0 nM vs. 100 nM: MD = 4.14143 [95% CI: −34.8305, 43.1134]. j Representative H&E and IHC staining of ER and MDK in OM of GC (n = 9 patients). Scale bar: 200 μm. In ce, Wilcoxon rank sum test followed by Bonferroni’s multiple-comparison test. In g, h, and i, source data are provided as a Source Data file. In c, f and g, AD adjacent normal gastric tissues, PT primary gastric tumors, OM ovarian metastases, PM peritoneal metastases, AS ascites samples.
Fig. 5
Fig. 5. Fibroblasts promote tumor cell proliferation through activating ER-MDK-LRP1 signaling axis.
a UMAP plot showing the types of integrated fibroblasts from the normal ovarian cortex, normal ovarian medulla, primary ovarian tumors, OM of GC, and PT of GC. b Stacked histograms showing the relative percentages of NFs, iCAFs, apCAFs, myCAFs_ACTA2, myCAFs_FAP, and myCAFs_ESR1 in different cohorts. c Violin plots showing the expression levels of ESR1, ESR2 and MDK in fibroblasts from different cohorts. d Venn diagram showing the intersecting genes in the three lists of DEGs. e Bar graphs showing the significantly enriched pathways for the intersecting genes. Hypergeometric test; P < 0.01. f Dot plot showing the presence of MDK–LRP1 and MDK–SORL1 pairs in the interaction between fibroblasts and malignant cells according to CellPhoneDB analysis. Permutation test. g Violin and box plots showing the expression levels of MDK in fibroblasts (n = 27,697 cells) and those of LRP1 in malignant cells (n = 29,592 cells) from different sample types. The center line of the box represents the median value, the upper and lower limits of the box represent the 25th and 75th percentile points. Wilcoxon rank sum test followed by Bonferroni’s multiple-comparison test. h Multiplex immunohistochemistry staining (mIHC) showing the spatial localization of ESR1 and MDK in fibroblasts (DCN+) and that of LRP1 in malignant cells (Pan-CK+) (n = 12 patients). Scale bar: 30 μm. i Quantitative analyses of the proportions of ESR1+ fibroblasts in mIHC of multiple samples (n = 12 patients). MD = −0.02697 [95% CI: −0.05291, −0.00102]. j Quantitative analyses of the proportions of LRP1+ tumor cells in mIHC of multiple samples (n = 12 patients). MD = 0.04241 [95% CI: −0.00879, 0.09361]. In b and c, NOC normal ovarian cortex, NOM normal ovarian medulla, POT pimary ovarian tumor, OM ovarian metastases of GC, PT primary tumor of GC. In f, g, i and j, AD adjacent normal gastric tissues, PT primary gastric tumors, OM ovarian metastases, PM peritoneal metastases, AS ascites samples. In i and j, paired two-sided Student’s t-test. Source data are provided as a Source Data file.
Fig. 6
Fig. 6. Estrogen stimulation promotes the invasion and metastasis of LRP1+ gastric cancer cells by inducing the secretion of MDK by ovarian fibroblasts in vitro.
a Schematic diagram depicting the co-culture strategy for ovarian fibroblasts with GC cells created in BioRender. Hu, C. (2021) BioRender.com/z48q170 released under a Creative Commons Attribution-NonCommercial-NoDerivs 4.0 International license. Representative images (b) and quantitation (c) of the Transwell assay showing the migration and invasion abilities of NUGC-3 cells after 72 h of co-culture with ovarian fibroblasts plus Estradiol (100 nM), Fulvestrant (100 nM), or iMDK (100 nM) treatment (n = 3 co-culture experiments). Migration: Control vs. Estradiol: MD = −0.29828 [95% CI: −0.4257, −0.1709]. Control vs. Fulvestrant: MD = 0.34433 [95% CI: 0.2196, 0.4691]. Control vs. Estradiol + Fulvestrant: MD = 0.10304 [95% CI: −0.0839, 0.2900]. Control vs. iMDK: MD = 0.40379 [95% CI: 0.2029, 0.6047]. Invasion: Control vs. Estradiol: MD = −1.16864 [95% CI: −1.9059, −0.4314]. Control vs. Fulvestrant: MD = 0.49216 [95% CI: 0.1354, 0.8489]. Control vs. Estradiol + Fulvestrant: MD = 0.38712 [95% CI: −0.2022, 0.9764]. Control vs. iMDK: MD = 0.52045 [95% CI: 0.0513, 0.9896]. Representative images (d) and quantitation (e) of the Transwell assay showing the migration and invasion abilities of MKN-1 cells after 72 h of co-culture with ovarian fibroblasts plus Estradiol (100 nM), Fulvestrant (100 nM), or iMDK (100 nM) treatment (n = 3 co-culture experiments). Migration: Control vs. Estradiol: MD = −1.13880 [95% CI: −1.3850, −0.8926]. Control vs. Fulvestrant: MD = 0.55276 [95% CI: 0.2492, 0.8563]. Control vs. Estradiol + Fulvestrant: MD = 0.45942 [95% CI: 0.2317, 0.6871]. Control vs. iMDK: MD = 0.60633 [95% CI: 0.2499, 0.9627]. Invasion: Control vs. Estradiol: MD = −0.55892 [95% CI: −1.0038, −0.1140]. Control vs. Fulvestrant: MD = 0.55096 [95% CI: 0.1746, 0.9273]. Control vs. Estradiol + Fulvestrant: MD = 0.47452 [95% CI: 0.1104, 0.8386]. Control vs. iMDK: MD = 0.54618 [95% CI: 0.2378, 0.8546]. Representative images (f) and quantitation (g) of the Transwell assay showing the migration and invasion abilities of NUGC-3 cells (WT/shLRP1/OV-LRP1) after 72 h of co-culture with ovarian fibroblasts (WT/shMDK/OV-MDK) (n = 3 co-culture experiments). Migration: Control vs. shMDK: MD = 0.46386 [95% CI: 0.2720, 0.6557]. Control vs. OV-MDK: MD = −0.32294 [95% CI: −0.5335, −0.1124]. Control vs. shLRP1: MD = 0.22609 [95% CI: 0.0310, 0.4212]. Control vs. OV-LRP1: MD = −0.31610 [95% CI: −0.5176, −0.1146]. Invasion: Control vs. shMDK: MD = 0.40916 [95% CI: 0.1615, 0.6568]. Control vs. OV-MDK: MD = −0.72788 [95% CI: −0.9293, −0.5265]. Control vs. shLRP1: MD = 0.51109 [95% CI: 0.2793, 0.7428]. Control vs. OV-LRP1: MD = −0.86171 [95% CI: −1.4230, −0.3004]. Representative images (h) and quantitation (i) of the Transwell assay showing the migration and invasion abilities of MKN-1 cells (WT/shLRP1/OV-LRP1) after 72 h of co-culture with ovarian fibroblasts (WT/shMDK/OV-MDK) (n = 3 co-culture experiments). Migration: Control vs. shMDK: MD = 0.50487 [95% CI: 0.2123, 0.7974]. Control vs. OV-MDK: MD = −1.17127 [95% CI: −1.8123, −0.5303]. Control vs. shLRP1: MD = 0.52232 [95% CI: 0.2725, 0.7722]. Control vs. OV-LRP1: MD = −1.21510 [95% CI: −2.0497, −0.3805]. Invasion: Control vs. shMDK: MD = 0.49283 [95% CI: 0.0615, 0.9241]. Control vs. OV-MDK: MD = −0.68153 [95% CI: −1.0402, −0.3229]. Control vs. shLRP1: MD = 0.59236 [95% CI: 0.1119, 1.0728]. Control vs. OV-LRP1: MD = −0.91879 [95% CI: −1.3637, −0.4739]. In b, d, f, and h, scale bar: 100 μm. In c, e, g, and i, one-way ANOVA followed by Bonferroni’s multiple-comparison test. Source data are provided as a Source Data file. Error bars represent mean ± standard deviations.
Fig. 7
Fig. 7. Estrogen stimulation promotes the ovarian implantation and metastasis of LRP1+ gastric cancer cells by inducing the secretion of MDK by ovarian fibroblasts in vivo.
a Schematic diagram and images of luciferase signals in the control, Estradiol, Fulvestrant, and iMDK groups of the OM mouse model. b Macroscopic lesions in the ovaries of mice in different groups. c The tumor mass (determined by the detected photons/sec) of mice in different groups at week 1 (beginning of intervention) and week 5 (end of intervention). One-way ANOVA followed by Bonferroni’s multiple-comparison test. Week 1: log10(tumor mass): Control vs. Estradiol: MD = 0.05772 [95% CI: −0.4858, 0.6013]. Control vs. Fulvestrant: MD = 0.01648 [95% CI: −0.5271, 0.5600]. Control vs. iMDK: MD = −0.09515 [95% CI: −0.6387, 0.4484]. Week 5: log10(tumor mass): Control vs. Estradiol: MD = −0.64320 [95% CI: −1.0341, −0.2523]. Control vs. Fulvestrant: MD = 1.41690 [95% CI: 1.0163, 1.8175]. Control vs. iMDK: MD = 2.04559 [95% CI: 1.6614, 2.4298]. Error bars represent mean ± standard deviations. d Representative H&E and IHC images of MDK expression in mice after different interventions. Scale bar: 100 μm. e Schematic diagram and images of luciferase signals in nude mice injected with GC cells expressing sh-NC or shLRP1. f Macroscopic lesions of bilateral ovarian metastasis in mice at week 4 (end of the experiments). g The tumor mass of bilateral OM (determined by the detected photons/sec) of mice at week 0 (beginning of the construction of the OM model) and at week 4 (end of the experiments). Week 0: log10(tumor mass), MD = 0.05850 [95% CI: −0.18739, 0.30440]. Week 4: log10(tumor mass), MD = −2.04215 [95% CI: −3.44030, −0.64401]. h The tumor weight (g) were measured and documented for the shNC and shLRP1 groups on 4-week-old female nude mice. MD = −0.35840 [95% CI: −0.45218, −0.26462]. In g and h, paired two-sided Student’s t-test. In c, g, and h, n = 5 mice, source data are provided as a Source Data file. In a and e, schematic diagram created in BioRender. Hu, C. (2021) BioRender.com/z48q170 released under a Creative Commons Attribution-NonCommercial-NoDerivs 4.0 International license.

References

    1. Sung, H. et al. Global cancer statistics 2020: Globocan estimates of incidence and mortality worldwide for 36 cancers in 185 countries. CA Cancer J. Clin.71, 209–249 (2021). - PubMed
    1. Gao, J. et al. Transcriptomic characterization and construction of M2 macrophage-related prognostic and immunotherapeutic signature in ovarian metastasis of gastric cancer. Cancer Immunol. Immunother.72, 1121–1138 (2023). - PMC - PubMed
    1. Yu, P. et al. Treatment strategy and prognostic factors for Krukenberg tumors of gastric origin: report of a 10-year single-center experience from China. Oncotarget8, 82558–82570 (2017). - PMC - PubMed
    1. Namikawa, T. et al. Frequency and therapeutic strategy for patients with ovarian metastasis from gastric cancer. Langenbecks Arch. Surg.407, 2301–2308 (2022). - PubMed
    1. Al-Agha, O. M. & Nicastri, A. D. An in-depth look at Krukenberg tumor: an overview. Arch. Pathol. Lab Med130, 1725–1730 (2006). - PubMed

Publication types

MeSH terms

Substances

Associated data