. 2024 Sep 30;15(1):8450.
doi: 10.1038/s41467-024-52545-6.

Contrasting genomic epidemiology between sympatric Plasmodium falciparum and Plasmodium vivax populations

Affiliations

Contrasting genomic epidemiology between sympatric Plasmodium falciparum and Plasmodium vivax populations

Philipp Schwabl et al. Nat Commun. .

Abstract

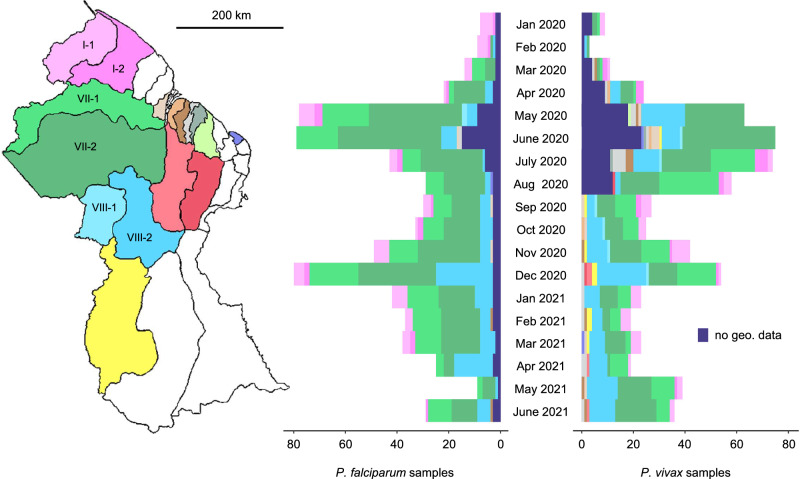
The malaria parasites Plasmodium falciparum and Plasmodium vivax differ in key biological processes and associated clinical effects, but consequences on population-level transmission dynamics are difficult to predict. This co-endemic malaria study from Guyana details important epidemiological contrasts between the species by coupling population genomics (1396 spatiotemporally matched parasite genomes, primarily from 2020-21) with sociodemographic analysis (nationwide patient census from 2019). We describe how P. falciparum forms large, interrelated subpopulations that sporadically expand but generally exhibit restrained dispersal, whereby spatial distance and patient travel statistics predict parasite identity-by-descent (IBD). Case bias towards working-age adults is also strongly pronounced. P. vivax exhibits 46% higher average nucleotide diversity (π) and 6.5x lower average IBD. It occupies a wider geographic range, without evidence for outbreak-like expansions, only microgeographic patterns of isolation-by-distance, and weaker case bias towards adults. Possible latency-relapse effects also manifest in various analyses. For example, 11.0% of patients diagnosed with P. vivax in Greater Georgetown report no recent travel to endemic zones, and P. vivax clones recur in 11 of 46 patients incidentally sampled twice during the study. Polyclonality rate is also 2.1x higher than in P. falciparum, does not trend positively with estimated incidence, and correlates uniquely to selected demographics. We discuss possible underlying mechanisms and implications for malaria control.


Conflict of interest statement

The authors declare no competing interests.

Figures

Fig. 1
Fig. 1. Spatiotemporal and demographic patterns of P. falciparum and P. vivax in Guyana.
a Weekly reported cases (points) and 30-day rolling average (line) between 2006 and 2019. b Percent of cases representing P. falciparum (% Pf) by region and ethnicity in 2019. Asterisks indicate significant differences in % Pf between Afroguyanese and non-Afroguyanese cases via Chi-squared test (Bonferroni-adjusted (bf-adj.) p = 5.5 × 10−9 in Region I, bf-adj. p = 4.1 × 10−60 in Region VII, and bf-adj. p = 1.2 × 10−28 in Region VIII). c Cumulative case count across epidemiological zones in 2019. Zones on the x-axis are ordered by total case count (descending from left to right). d Case counts by gender and age in 2019. e Boxplots summarize monthly variation (median and quartiles) in % Pf by gender and age in 2019. Asterisks indicate significant differences for age bins <15 vs. 15–54 (Benjamini-Hochberg-adjusted (bh-adj.) p = 0.004 in both males and females) and <15 vs. ≥55 (bh-adj. p = 4.6 × 10−6 in males) via two-sided Dunn test.
Fig. 2
Fig. 2. Spatiotemporally matched P. falciparum and P. vivax sampling in Guyana.
Colors in the map and histograms represent the neighborhood councils (NDCs) to which infections from 2020–21 were attributed based on patient response about location of stay 14 days prior to diagnosis. NDCs within Regions I, VII, and VIII are labeled in the map.
Fig. 3
Fig. 3. Pairwise IBD and relationships to spatial distance in P. falciparum and P. vivax in Guyana.
a Histogram of pairwise IBD in 2020–21. The y-axis is log10-scaled to help display less frequent close-relative observations. Dashed lines indicate species means. b Relationship of spatial distance between inferred infection sites and the frequency of >0.50 IBD in 2020–21. Points represent observations from windowed calculation using step size = 10 km starting at 0–30 km. Error bars represent 90% confidence intervals from bootstrapping 1000x. The model y=a*eb*x+c was used to fit regression lines of linear and logarithmic shape. Distance analyses use 359 P. falciparum samples and 474 P. vivax samples (following an exclusion of P. falciparum samples belonging to clonal groups of ≥ 10 membership size).
Fig. 4
Fig. 4. Frequency of >0.50 IBD within and between epidemiological zones in P. falciparum and P. vivax in Guyana.
Nodes indicate epidemiological zones. Node and segment colors indicate frequency of >0.50 IBD within and between epidemiological zones (respectively) in 2020–21. Node sizes are proportional to genomic sampling size. Between-zone comparisons represented by ≤ 50 comparisons are excluded.
Fig. 5
Fig. 5. Relationship between patient case flow and the relative frequency of >0.50 IBD in P. falciparum and P. vivax in Guyana.
Genetic data (y-axis) represents 2020–21 and epidemiological (case flow) data (x-axis) represents 2019. Point color indicates the spatial distance separating the zones being compared. Comparisons represented by ≤ 50 comparisons are excluded. Gray shading indicates 95% confidence intervals predicted by linear regression (dashed line). Labeled points represent observed values for (1) Central Coast (CC) vs. Lower Cuyuni (LC), (2) Head Waini (HW) vs. Kaituma and Barima (KB), (3) Lower Potaro (LP) vs. Mid Essequibo, (4) KB vs. Waini, (5) CC vs. Lower Mazaruni (LM), (6) KB vs. North Delta (ND), (7) LC vs. LM, (8) Head Mazaruni vs. LM, (9) Cristinas Border vs. LM, (10) LM vs. Mid Mazaruni and Issano Rd, (11) LM vs. Upper Cuyuni, (12) CC vs. KB, (13) LM vs. ND, (14) East of Georgetown vs. LP, (15) LM vs. Upper Rupununi (UR), (16) LP vs. UR, (17) Greater Lethem vs. LM, and (18) LM vs. LP. Please note that significant correlation is lost from the P. vivax regression when outlier point #6 is omitted (Pearson’s r = 0.07, two-sided p = 0.675). Significance remains when omitting this point from the P. falciparum regression (Pearson’s r = 0.41, two-sided p = 0.045).
Fig. 6
Fig. 6. Polyclonality rates and relationships to patient gender in P. falciparum and P. vivax in Guyana.
a Complexity of infection (COI) values in 2020–21, population-wide. b Polyclonality rate (2020–21) vs. patient gender fractions in neighborhood district councils (NDCs) represented by ≥ 20 genomic samples (see sample size annotations within plot). Gender fractions likewise represent 2020–21 (patient metadata from the genomic data set). Square and diamond symbols represent observed values for male and female patients, respectively, and error bars represent 90% confidence intervals from bootstrapping 1000x. Polyclonality rate comparison between male and female patients (two-proportions z-test) showed significance only for P. vivax in NDC VIII-2 (one-sided p-value = 0.039, without correction for multiple comparisons).

References

    1. World Health Organization. WHO Malaria Report 2023 (WHO, 2023).
    1. Weiss, D. J. et al. Mapping the global prevalence, incidence, and mortality of Plasmodium falciparum, 2000-17: a spatial and temporal modelling study. Lancet Lond. Engl.394, 322–331 (2019). - PMC - PubMed
    1. Battle, K. E. et al. Mapping the global endemicity and clinical burden of Plasmodium vivax, 2000-17: a spatial and temporal modelling study. Lancet Lond. Engl.394, 332–343 (2019). - PMC - PubMed
    1. Price, R. N., Commons, R. J., Battle, K. E., Thriemer, K. & Mendis, K. Plasmodium vivax in the era of the shrinking P. falciparum map. Trends Parasitol.36, 560–570 (2020). - PMC - PubMed
    1. Oliveira-Ferreira, J. et al. Malaria in Brazil: an overview. Malar. J.9, 115 (2010). - PMC - PubMed

Publication types

MeSH terms

LinkOut - more resources