. 2024 Sep 30;10(1):106.
doi: 10.1038/s41540-024-00438-1.

Spatial interactions modulate tumor growth and immune infiltration

Affiliations

Spatial interactions modulate tumor growth and immune infiltration

Sadegh Marzban et al. NPJ Syst Biol Appl. .

Abstract

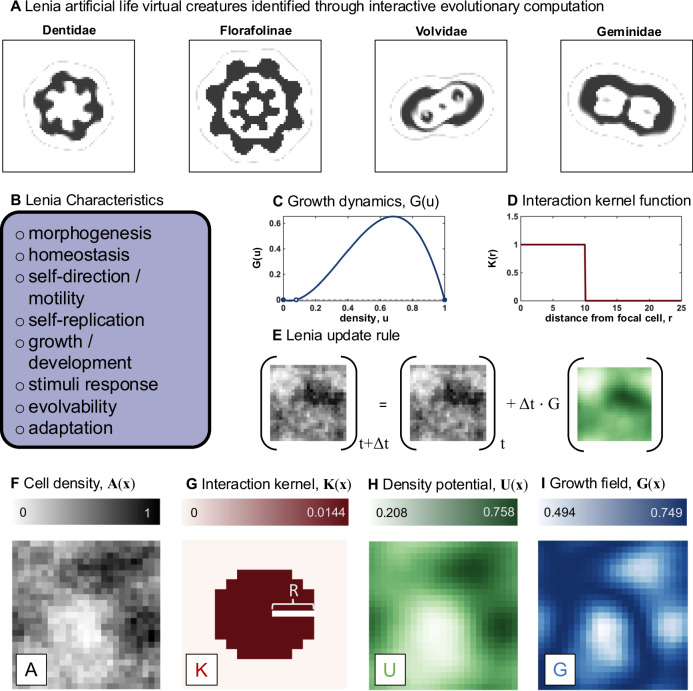
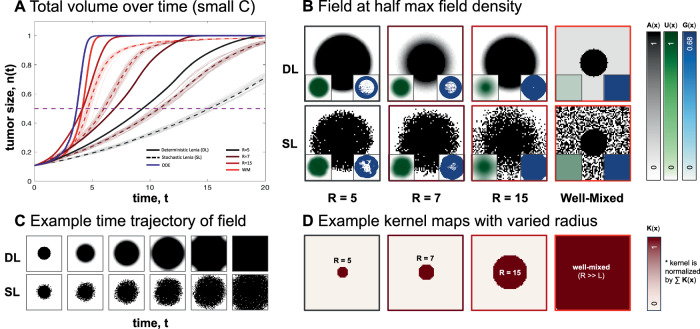
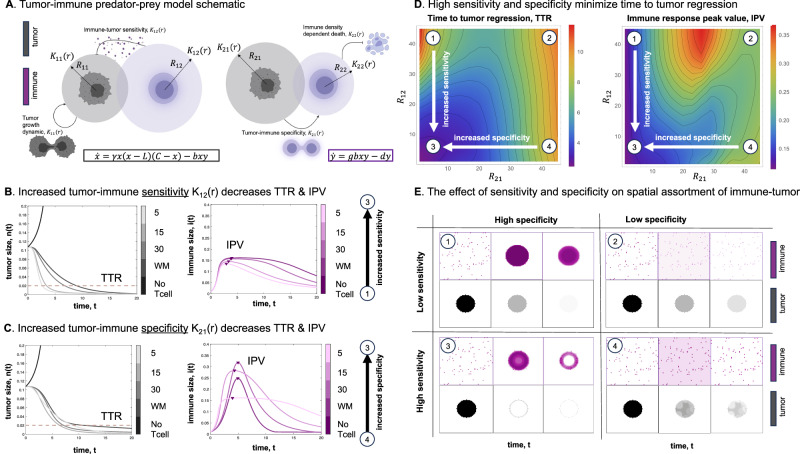
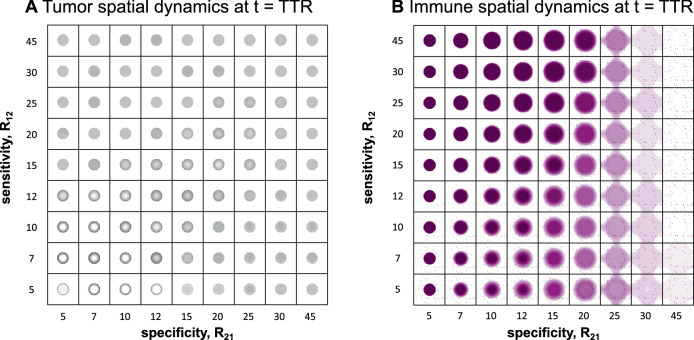
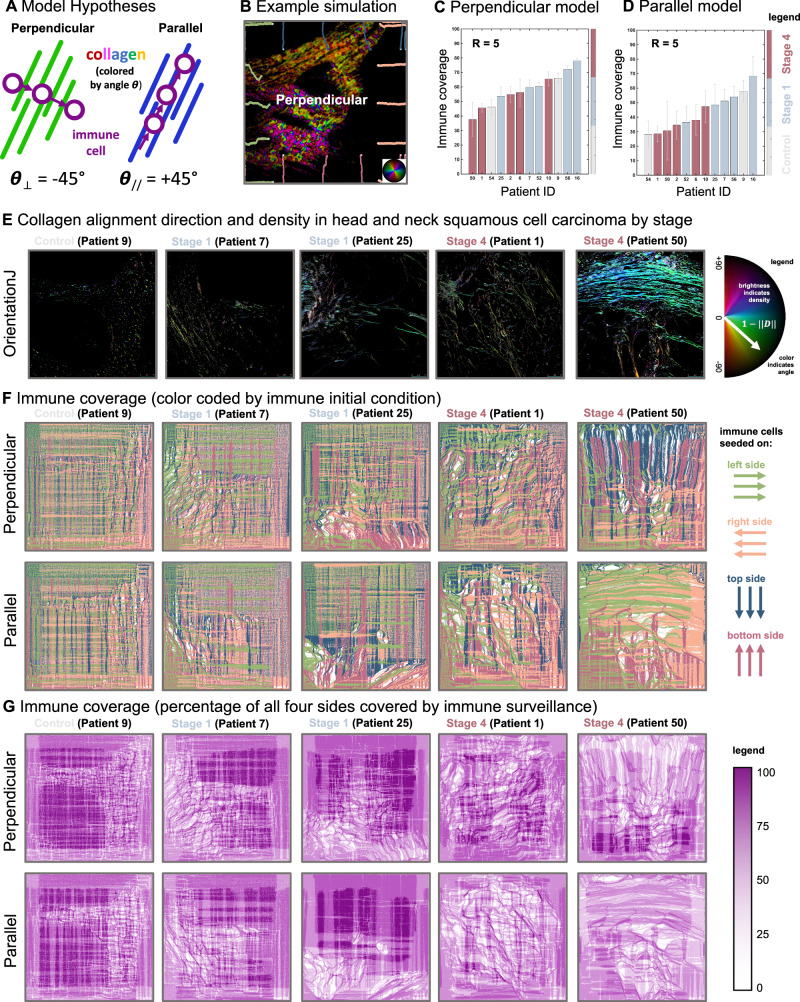
Direct observation of tumor-immune interactions is unlikely in tumors with currently available technology, but computational simulations based on clinical data can provide insight to test hypotheses. It is hypothesized that patterns of collagen evolve as a mechanism of immune escape, but the exact nature of immune-collagen interactions is poorly understood. Spatial data quantifying collagen fiber alignment in squamous cell carcinomas indicates that late-stage disease is associated with highly aligned fibers. Our computational modeling framework discriminates between two hypotheses: immune cell migration that moves (1) parallel or (2) perpendicular to collagen fiber orientation. The modeling recapitulates immune-extracellular matrix interactions where collagen patterns provide immune protection, leading to an emergent inverse relationship between disease stage and immune coverage. Here, computational modeling provides important mechanistic insights by defining a kernel cell-cell interaction function that considers a spectrum of local (cell-scale) to global (tumor-scale) spatial interactions. Short-range interaction kernels provide a mechanism for tumor cell survival under conditions with strong Allee effects, while asymmetric tumor-immune interaction kernels lead to poor immune response. Thus, the length scale of tumor-immune interaction kernels drives tumor growth and infiltration.


Conflict of interest statement

The authors declare no competing interests.

Figures

Fig. 1
Fig. 1. Lenia as a cancer model.
A Lenia artificial life virtual creatures, as found by evolutionary computation in ref. . B List of characteristics possible to produce in Lenia by varying the growth dynamics function (C) or the interaction kernel function (D). E adding a fraction of the growth field at each time step to the cell density, forms the Lenia update rule, as seen in eqn. (1). F An example snapshot of a simulation shows the density of cells at each lattice location where the interaction kernel (G) specifies the nature of interaction of cells depending on their distance from each other. H The density potential, interpreted as a weighted average of interactions at each lattice location, is calculated as the convolution of A(x) and K(x). I the growth field is calculated by applying a growth map to the density potential.
Fig. 2
Fig. 2. Cancer growth dynamics in Lenia.
A Average cell density over time for varying kernel sizes, for deterministic and stochastic Lenia. Averages over stochastic runs are shown in dotted lines, and individual trajectories are shown in translucent lines. ODE solution (shown in blue) matches simulation with a well-mixed kernel (see Supplementary Fig. 1). C indicates that maximum cell number (carrying capacity, C = 1) per pixel. B State of field at half-maximal capacity for different kernel sizes for Stochastic Lenia (SL) or Deterministic Lenia (DL). Density potential and Growth distribution shown in inset. C State of field at progressive time points for kernel size 4 for deterministic and stochastic Lenia. D Kernels used in models in figures (B). L indicates the length of the domain (number of pixels; L = 64).
Fig. 3
Fig. 3. Short-range interaction kernels are more robust to Allee effects.
A Average cell density over time for varying kernel sizes, for deterministic and stochastic Lenia. Averages over stochastic runs are shown in dotted lines and individual trajectories are shown in translucent lines. ODE solution shown in blue. B Long-term tumor fate for deterministic Lenia where trajectories that eventually result in extinction are shown in red, or growth shown in blue (colorbar indicates change in tumor size at t* = 3. C, D Spatial maps shown for deterministic Lenia (C) and stochastic Lenia (D) at time t* = 3. See corresponding Supplementary Movie 1.
Fig. 4
Fig. 4. Competition dynamics in Lenia.
A Schematic representation of the tumor-immune predator-prey model, illustrating various kernel sizes for tumor growth (K11), predation distance (K12), immune recruitment (K21), and density-dependent death distance in the immune system (K22). B, C Impact of different predation distances (K12) and immune recruitment (K21) on the integration results of the tumor-immune predator-prey model, with other kernels held well-mixed. D Effect of varying predation and recruitment (K12 and K21) on the time to tumor regression (considered when there are 2% tumor cells in the area) and the peak value in the immune response. E Spatial outcomes of the tumor and immune response in the model, showcasing the influence of different kernel sizes. See corresponding Supplementary Movie 2. Unless otherwise noted, parameters used are γ = 5, b = 12, g = 1.5, d = 1, L = 0.08 (see eqns. (6)–(7)).
Fig. 5
Fig. 5. Tumor-immune spatial variegation patterns as a function of interaction kernels.
Spatial maps are shown at the time to tumor regression (TTR; see Fig. 4) for a range of tumor-immune sensitivity (r12) and specificity (r21) values. A Tumor spatial map at TTR. B Immune spatial maps at TTR. Spatial variegation in tumor density increases as both specificity and sensitivity are increased. As immune specificity narrows (r21 is small), immune cell concentration strongly correlates with tumor’s location with a high degree of specificity. Unless otherwise noted, parameters used are γ = 5, b = 12, g = 1.5, d = 1, L = 0.08 (see eqns. (6), (7)).
Fig. 6
Fig. 6. Collagen alignment in HNSCC.
A Pipeline of image analysis to computational model using second harmonic generation to determine collagen density and subsequently the alignment and microenvironmental gradient. B Alignment collagen fibers is determined using OrientationJ ImageJ plugin; alignment tends to increase by disease stage. See Supplementary Fig. 2 for alternative metrics to quantify alignment. C Spatial distribution of collagen alignment, color-coded by degree of alignment where red is highly aligned, yellow is moderately aligned, and green is non-aligned. Analysis done using CT-Fire and CurveAlign.
Fig. 7
Fig. 7. Immune cell trafficking model in particle Lenia.
A Hypothesized models of the influence of collagen fiber alignment on immune cell trafficking. See corresponding Supplementary Movie 3. B example simulation showing immune cell infiltration (circles) with track indicating path taken. Cells seed on all four sides, color-coded by initial side (see F). C, D Simulated immune coverage for perpendicular (C) or parallel (D) immune trafficking model, colored by stage. E Representative sample ROI alignment and density of collagen fibers (using OrientationJ ImageJ plugin) ordered by disease stage. F Immune coverage, color-coded by immune initial condition of which of the four sides: left, right, top, bottom (see legend). The color of each pixel is determined the most trafficked side. G Immune coverage as the percentage of all four sides covered by immune surveillance. For example, if no immune cells reached this pixel it is white, if all four sides reached this pixel, it is dark purple. See corresponding Supplementary Movie 4.

Update of

References

    1. Chan, B. W.-C. Lenia-biology of artificial life. Complex Syst. 28, 251–286 (2019).
    1. Chan, B. W.-C. Lenia and expanded universe. In: Artificial Life Conference Proceedings 32, 221–229 (2020).
    1. Jain, S. & Shrestha, A. Capturing emerging complexity in Lenia. arXivhttps://arxiv.org/abs/2305.09378 (2023).
    1. Gardner, M. Mathematical games-the fantastic combinations of john conway’s new solitaire game, life, 1970. Sci. Am.223, 120–123 (1970).
    1. Davis, Q. T. & Bongard, J. Glaberish: generalizing the continuously-valued Lenia framework to arbitrary life-like cellular automata. In: Artificial Life Conference Proceedings 34, 2022, 47 (2022).

LinkOut - more resources