. 2024 Sep 30;14(1):22633.
doi: 10.1038/s41598-024-72265-7.

Aggregation of the amyloid-β peptide (Aβ40) within condensates generated through liquid-liquid phase separation

Affiliations

Aggregation of the amyloid-β peptide (Aβ40) within condensates generated through liquid-liquid phase separation

Owen M Morris et al. Sci Rep. .

Abstract

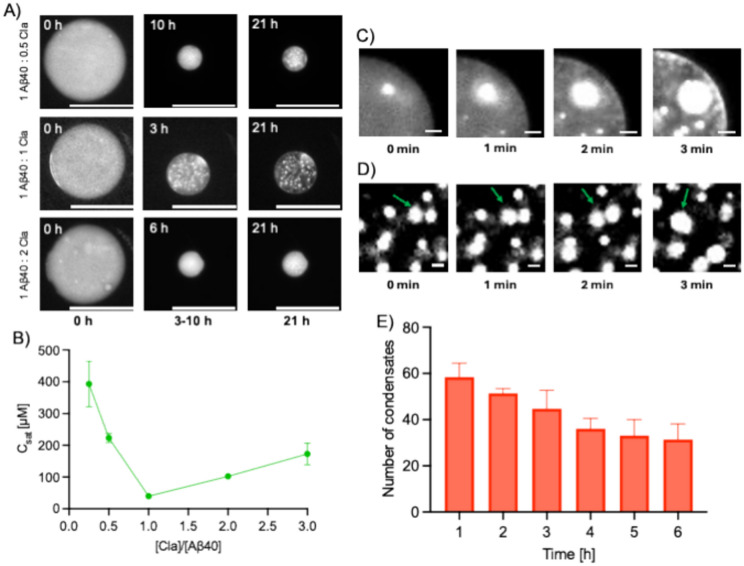
The deposition of the amyloid-β (Aβ) peptide into amyloid fibrils is a hallmark of Alzheimer's disease. Recently, it has been reported that some proteins can aggregate and form amyloids through an intermediate pathway involving a liquid-like condensed phase. These observations prompted us to investigate the phase space of Aβ. We thus explored the ability of Aβ to undergo liquid-liquid phase separation, and the subsequent liquid-to-solid transition that takes place within the resulting condensates. Through the use of microfluidic approaches, we observed that the 40-residue form of Αβ (Αβ40) can undergo liquid-liquid phase separation, and that accessing a liquid-like intermediate state enables Αβ40 to self-assemble and aggregate into amyloid fibrils through this pathway. These results prompt further studies to investigate the possible role of Αβ liquid-liquid phase separation and its subsequent aggregation in the context of Alzheimer's disease and more generally on neurodegenerative processes.


Conflict of interest statement

The authors declare no competing interests.

Figures

Fig. 1
Fig. 1
Schematic of the microfluidic strategy used to monitor liquid–liquid phase separation and subsequent aggregation of Aβ40 within the liquid-like condensates. An aqueous Aβ40 sample (3–5 μL) is initially injected into the microfluidic device. Following this, at the first junction, a solution containing the relevant stoichiometry of claramine was introduced to the Aβ40 sample. Aqueous microdroplets are generated at the second junction, where an oil phase intersects the flow of the aqueous solution containing Aβ40, PEG, and claramine. These microdroplets are subsequently entrapped within the device. Fluorescence microscopy is then utilised to monitor the shrinkage of these microdroplets over time, which in turn induces the liquid–liquid phase separation of Aβ40. Time-lapse images of the microdroplets can then be analysed using Fiji. The liquid–liquid phase separation and subsequent aggregation of Aβ40 can then be characterised. Depiction of the microfluidics device and fluorescence microscope have been adapted using BioRender (BioRender Premium, https://www.biorender.com/).
Fig. 2
Fig. 2
Formation of Aβ40 condensates through liquid–liquid phase separation. (A) Time-lapse fluorescence microscopy images of microdroplets with Aβ40 condensates forming within them as the individual microdroplets shrink. (B) Plot of the critical concentration at which liquid–liquid phase separation was observed (Csat) for Aβ40 as a function of the Aβ40:claramine ratio. Three data points were averaged for each Csat value. Scale bar is 100 μm. (C) Fluorescence microscopy time-lapse images displaying Ostwald ripening of Aβ40 condensates. Scale bar is 10 μm. (D) Fluorescence microscopy time-lapse images displaying coalescence events occurring between Aβ40 condensates. The green arrows show the region at which the condensates coalesce. Scale bar is 5 μm. (E) Bar chart showing the decrease in the total number of condensates over time for a 1:1 ratio of Aβ40 to claramine. Analysed condensates were selected based on those being in-focus within the fluorescence microscopy images. Data are shown as mean ± SD of n = 3.
Fig. 3
Fig. 3
Aggregation of Aβ40 within liquid condensates. (A) Time-lapse fluorescence microscopy images of Aβ40 undergoing aggregation within condensates. Scale bars are 100 μm. (B) Phase diagram of Aβ40 concentration at which phase separation and subsequent aggregation takes place for varying Aβ40:claramine ratios. The green line displays the concentration at which Aβ40 undergoes liquid–liquid phase separation at various Aβ40:claramine stoichiometries. The orange line displays the concentration of Aβ40 at which the initial stages of aggregation are observed within the condensed liquid phase. Data are shown as mean of n = 3.
Fig. 4
Fig. 4
Aggregation kinetics of Aβ40 within liquid condensates. (A) Normalised kinetic traces for Aβ40 aggregation within liquid condensates at various Aβ40:claramine stoichiometries. The solid lines represent the fits to the kinetic data, which was performed using AmyloFit. Data are shown as mean ± SD of n = 3 (AC). The legend indicates the colour code used throughout the figure for the Aβ40:claramine stoichiometry. (B) Bar chart of the half-time of Aβ40 aggregation within liquid condensates for various Aβ40:claramine stoichiometries. (C). Bar chart of the normalised nucleation rate as a function of the Aβ40:claramine stoichiometry.
Fig. 5
Fig. 5
Schematic representation of the condensation and deposition pathways involving the aggregation of Aβ40. The conversion between the native and amyloid states along the condensation pathway takes place through an intermediate condensed state. Along the deposition pathway, the conversion takes place through the formation of disordered oligomers.

References

    1. Prince, M. et al. World Alzheimer report 2015. The global impact of dementia: an analysis of prevalence, incidence, cost and trends. In Alzheimer's Disease International (2015).
    1. Wimo, A. et al. The worldwide costs of dementia in 2019. Alzheim. Dement.19, 7 (2023). - DOI - PMC - PubMed
    1. Selkoe, D. J. & Hardy, J. The amyloid hypothesis of Alzheimer’s disease at 25 years. EMBO Mol. Med.8, 595–608 (2016). - DOI - PMC - PubMed
    1. Hampel, H. et al. The amyloid-β pathway in Alzheimer’s disease. Mol. Psychiatry26, 5481–5503 (2021). - DOI - PMC - PubMed
    1. Knowles, T. P., Vendruscolo, M. & Dobson, C. M. The amyloid state and its association with protein misfolding diseases. Nat. Rev. Mol. Cell Biol.15, 384–396 (2014). - DOI - PubMed

LinkOut - more resources