. 2024 Sep 30;14(1):22634.
doi: 10.1038/s41598-024-71840-2.

Future changes of precipitation types in the Peruvian Andes

Affiliations

Future changes of precipitation types in the Peruvian Andes

Valeria Llactayo et al. Sci Rep. .

Abstract

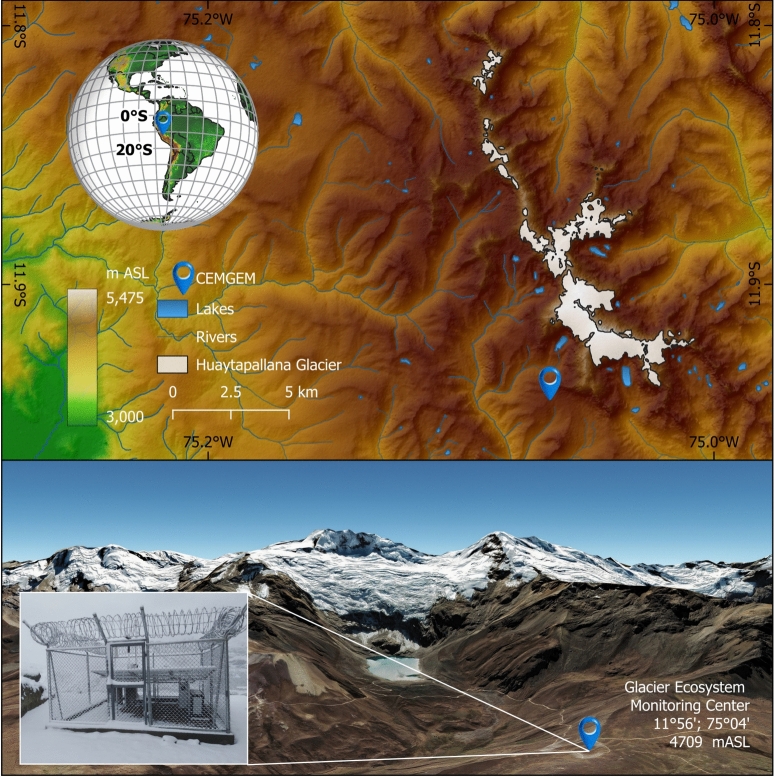
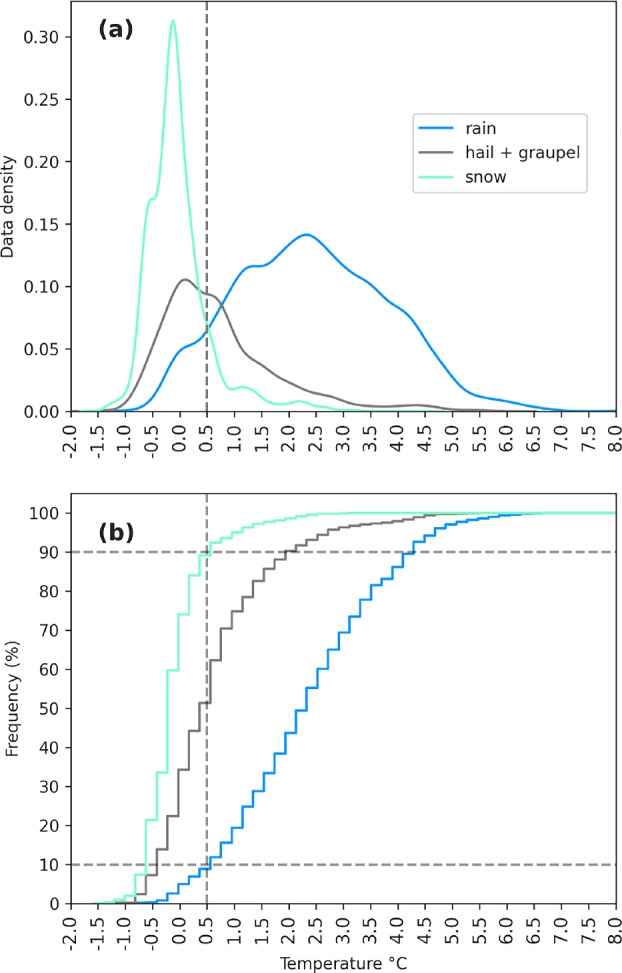
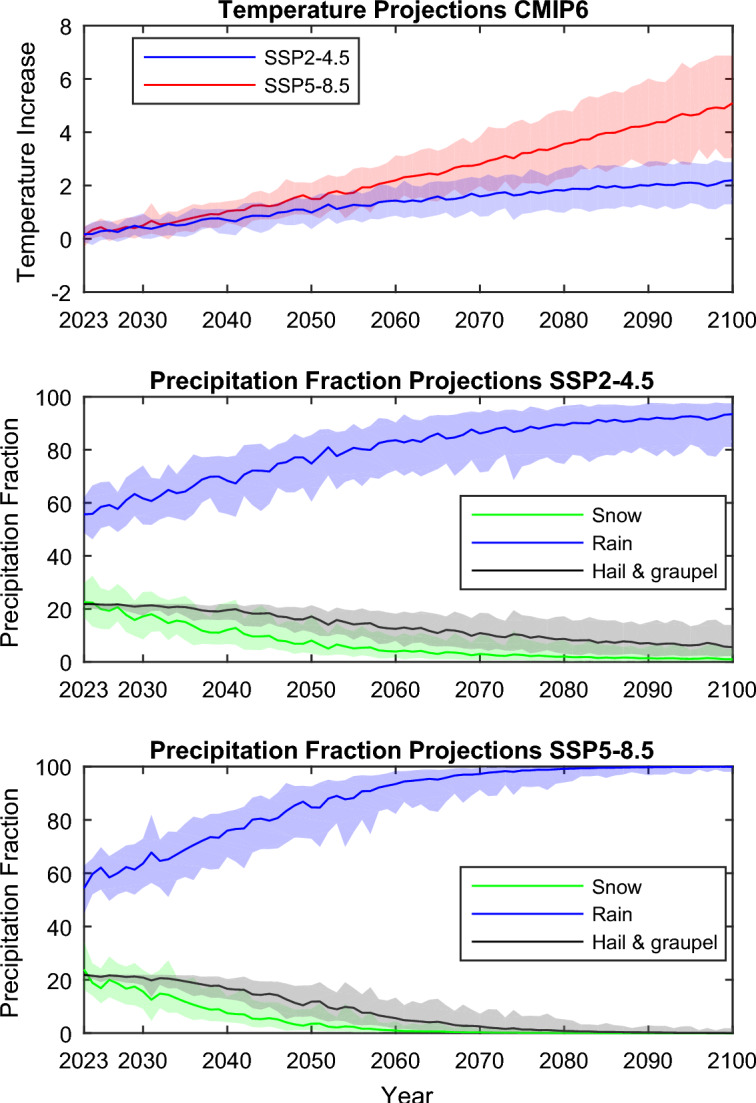
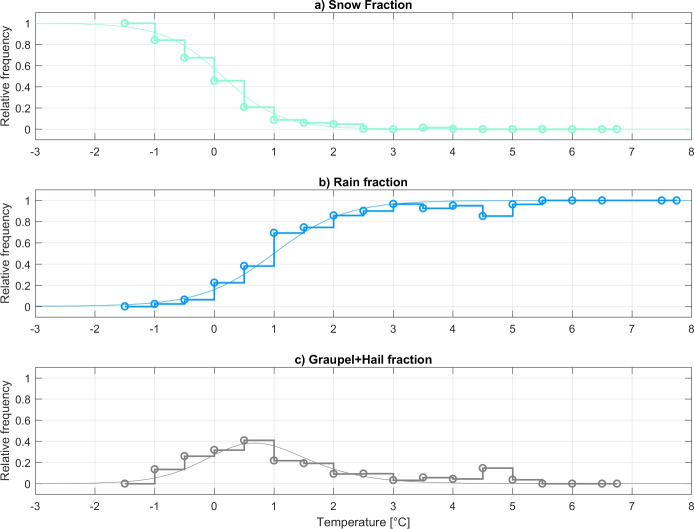
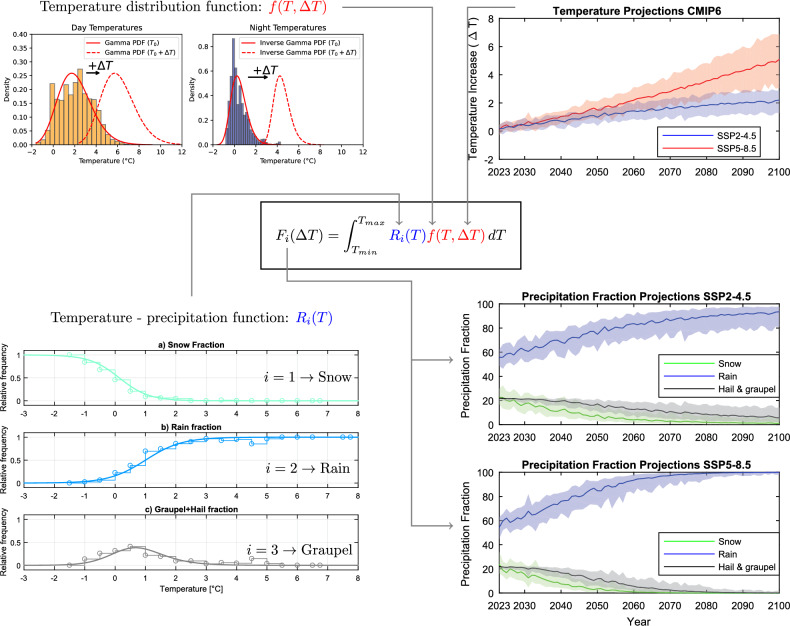
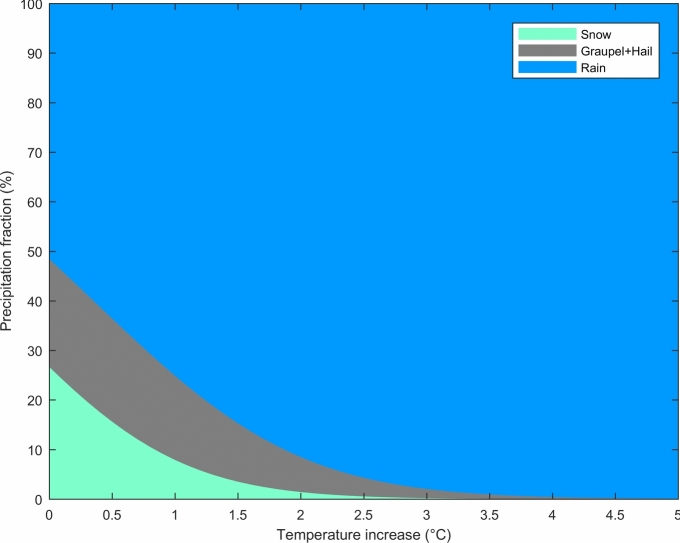
In high-altitude regions, such as the Peruvian Andes, understanding the transformation of precipitation types under climate change is critical to the sustainability of water resources and the survival of glaciers. In this study, we investigate the distribution and types of precipitation on a tropical glacier in the Peruvian Central Andes. We utilized data from an optical-laser disdrometer and compact weather station installed at 4709 m ASL, combined with future climate scenarios from the CMIP6 project, to model potential future changes in precipitation types. Our findings highlight that increasing temperatures could lead to significant reductions in solid-phase precipitation, including snow, graupel and hail, with implications for the mass balance of Andean glaciers. For instance, a 2 °C rise might result in less than 10% of precipitation as solid, in regard to the present day, transforming the hydrological processes of the region. The two future climate scenarios from the CMIP6 project, SSP2-4.5 and SSP5-8.5, offer a broad perspective on potential climate outcomes that could impact precipitation patterns in the Andes. Our study underscores the need to revisit and expand our understanding of high-altitude precipitation in the face of climate change, paving the way for improved water resource management strategies and sustainable glacier preservation efforts in these fragile ecosystems.

Keywords: Climate change scenarios; High-altitude precipitation; Precipitation types.


Conflict of interest statement

The authors declare no competing interests.

Figures

Fig. 1
Fig. 1
A comprehensive view of our high mountain glacier study area in the Tropical Andes. The top-left globe shows the broad South American location, with latitudes 0° and 20° South marked for context. The middle frame provides a detailed view of the study area, precisely the Huaytapallana glacier (Junin - Peru). The bottom frame shows a Google Earth image of the glacier, along with the Glacier and Mountain Ecosystem Monitoring Center (CEMGEM) equipment installed in the area, which is indicated by a blue symbol.
Fig. 2
Fig. 2
(a) Density distribution of snow (light green), hail + graupel (grey), and rain (blue) data according to temperature. The dotted line is located at 0.5 °C, below which 90% of the snow records are located and 90% of rain records are located above the same value. (b) Cumulative frequency graph expressed in percentages for snow, hail, and rainfall records according to temperature values. The horizontal dotted lines mark the location of 90% (upper line) and 10% (lower line). The vertical line marks the 0.5 °C value.
Fig. 3
Fig. 3
Diurnal cycle in LST of the probability frequency for snow (light green), hail + graupel (gray), and rain (blue) calculated using observational data from 89 events from late November 2022 to March 2023.
Fig. 4
Fig. 4
Comparison of Observed (obs) and Modeled (mod) Precipitation Type Fractions. This figure depicts the fractional contributions of different precipitation types (rain, graupel-hail, and snow) to total precipitation, during day and night. The modeled values are averaged over evenly distributed day and night periods (50–50%), based solely on temperature, while the observational values are derived from in-situ Parsivel2 disdrometer data, which accounts for actual precipitation events.
Fig. 5
Fig. 5
Future Projections of Precipitation Types with Error Margins and Temperature Increase (ΔT) under SSP2-4.5 and SSP5-8.5 Scenarios. Top panel: CMIP6 model-based temperature increase projections under SSP2-4.5 (blue) and SSP5-8.5 (red) scenarios, with the shaded areas representing the 10th to 90th percentile range of the projections. Middle panel: Projected changes in the occurrence of three types of precipitation - snow (green), rain (blue), and hail & graupel (gray) - from 2023 to 2100 under the SSP2-4.5 scenario, including error margins. Bottom panel: Similar precipitation fraction projections under the SSP5-8.5 scenario, also including error margins.
Fig. 6
Fig. 6
Relationship between Temperature and Precipitation Types. This figure delineates the probability of occurrence of each precipitation type (rain, graupel-hail, and snow) as a function of temperature. Note that the combined probabilities sum to 1 at any given temperature. The colored curves correspond to the parameterized fit for each precipitation type, providing a graphical representation of their likelihood at different temperatures. The derived equations of these fitted curves are presented in Section "Modelling precipitation fraction". This visualization aids in understanding the inherent relationship between temperature and the distribution of precipitation types.
Fig. 7
Fig. 7
Methodology flow diagram for computing future precipitation types. The diagram includes temperature distribution functions for day and night temperatures, temperature projections under different climate scenarios (SSP2-4.5 and SSP5-8.5), and temperature-precipitation functions for snow, rain, and graupel. By integrating the temperature-dependent precipitation function Ri(T) with the adjusted temperature distribution function f(T,ΔT), we predict the future fractions of different precipitation types under the influence of climate change.
Fig. 8
Fig. 8
This is an Extended Data Figure. Model Predictions of Precipitation Type Changes in Relation to Temperature Changes (Eq. 1). This figure provides a predictive view of the shift in precipitation types in response to increasing temperatures. Starting from a baseline condition where approximately 50% of precipitation is in the solid phase, the model illustrates the dramatic reduction in solid precipitation with rising temperatures.

References

    1. Harpold, A. A. et al. Rain or snow: hydrologic processes, observations, prediction, and research needs. Hydrol. Earth Syst. Sci.21, 1–22 (2017).
    1. Vuille, M. et al. Rapid decline of snow and ice in the tropical Andes - impacts, uncertainties and challenges ahead. Earth Sci. Rev.176, 195–213. 10.1016/j.earscirev.2017.09.019 (2018).
    1. Buytaert, W. et al. Glacial melt content of water use in the tropical Andes. Environ. Res. Lett.12, 114014. 10.1088/1748-9326/aa926c (2017).
    1. Viviroli, D. et al. Climate change and mountain water resources: Overview and recommendations for research, management and policy. Hydrol. Earth Syst. Sci.15, 471–504 (2011).
    1. Veettil, B. K. & Kamp, U. Global disappearance of tropical mountain glaciers: Observations, causes, and challenges. Geosciences9, 196 (2019).

LinkOut - more resources