. 2024 Sep 30;7(1):1226.
doi: 10.1038/s42003-024-06716-2.

Leishmania major-induced alteration of host cellular and systemic copper homeostasis drives the fate of infection

Affiliations

Leishmania major-induced alteration of host cellular and systemic copper homeostasis drives the fate of infection

Rupam Paul et al. Commun Biol. .

Abstract

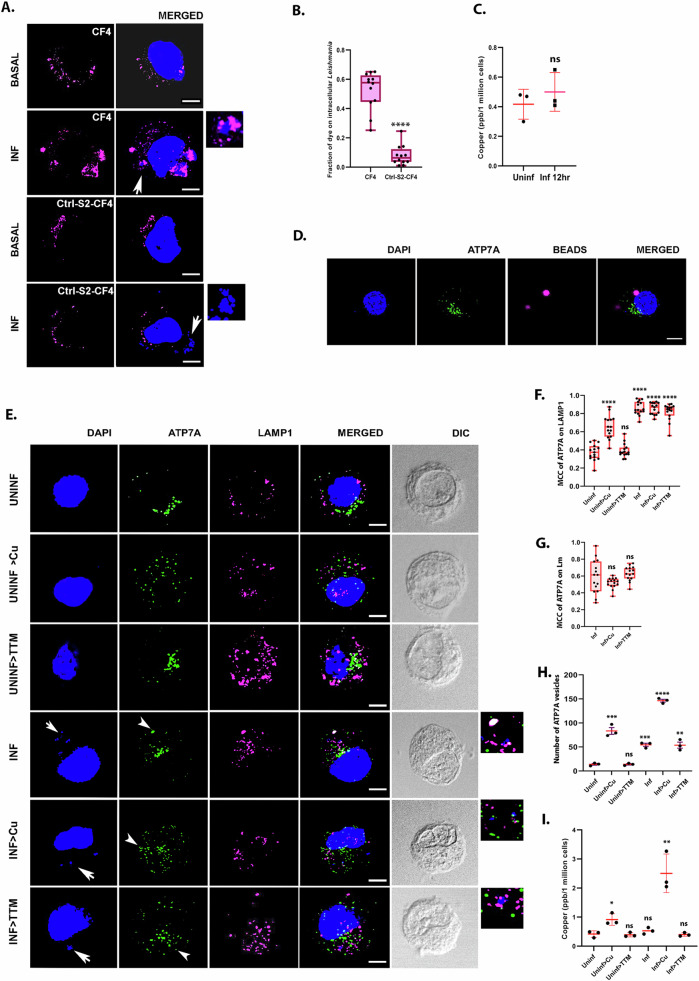
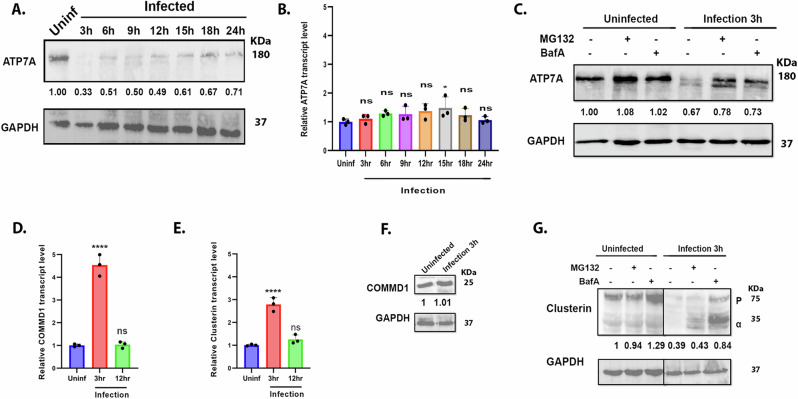
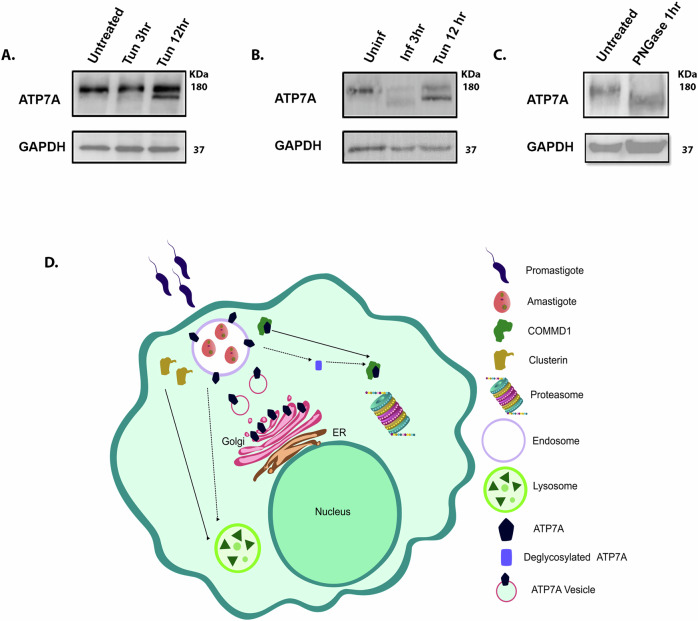
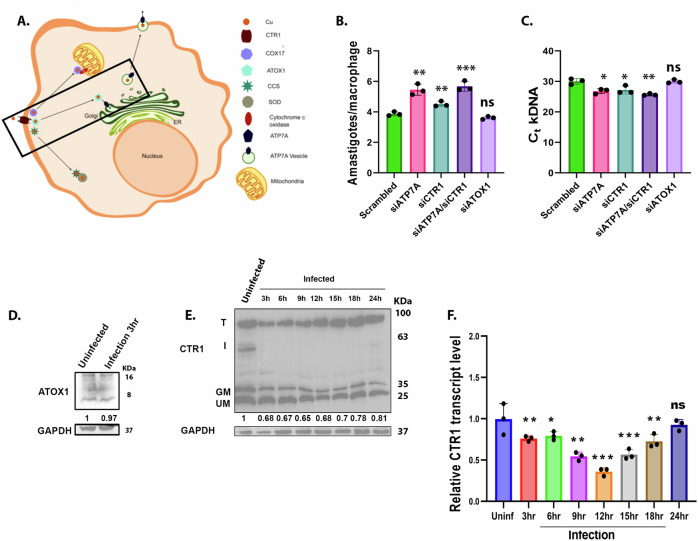
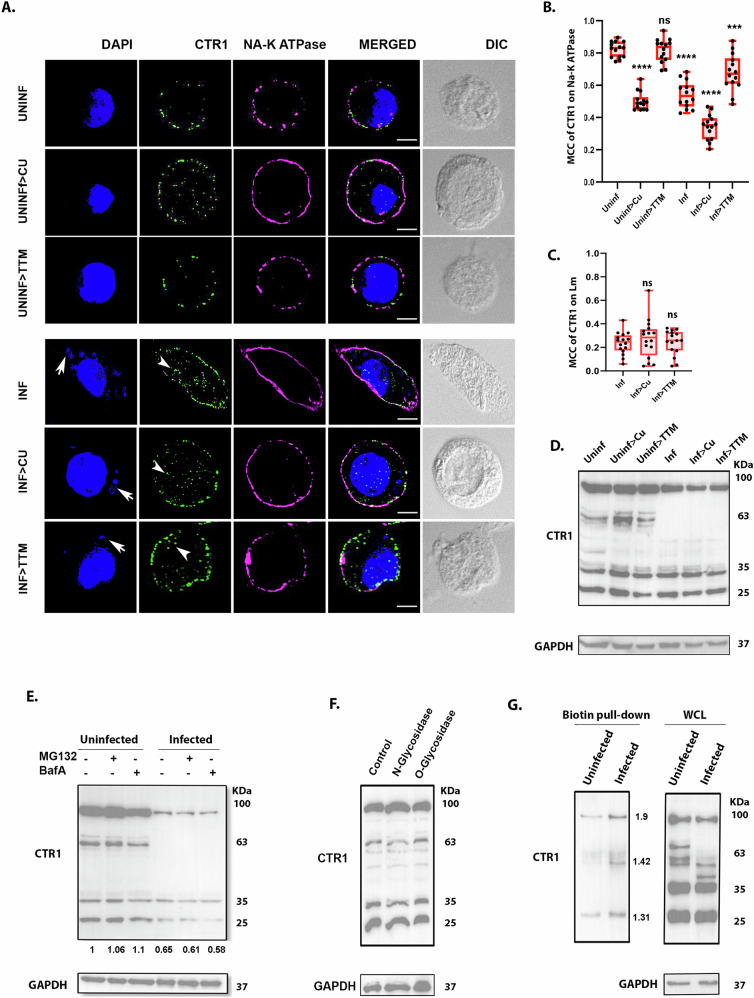
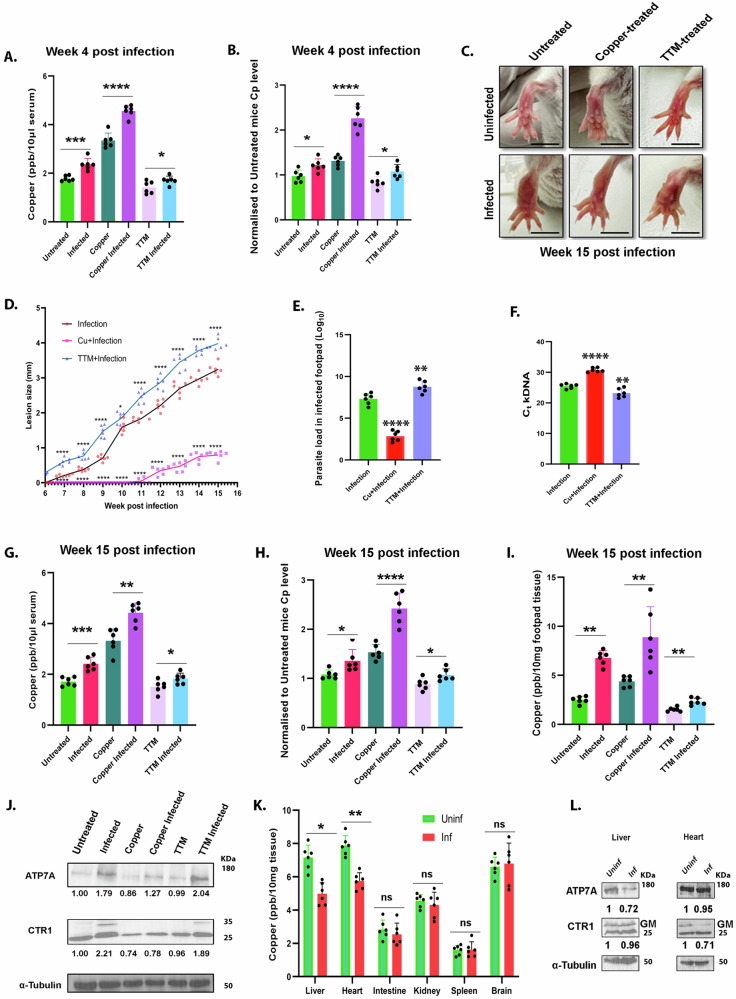
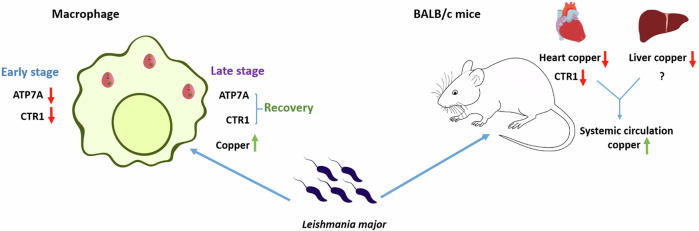
Copper plays a key role in host-pathogen interaction. We find that during Leishmania major infection, the parasite-harboring macrophage regulates its copper homeostasis pathway in a way to facilitate copper-mediated neutralization of the pathogen. Copper-ATPase ATP7A transports copper to amastigote-harboring phagolysosomes to induce stress on parasites. Leishmania in order to evade the copper stress, utilizes a variety of manipulative measures to lower the host-induced copper stress. It induces deglycosylation and degradation of host-ATP7A and downregulation of copper importer, CTR1 by cysteine oxidation. Additionally, Leishmania induces CTR1 endocytosis that arrests copper uptake. In mouse model of infection, we report an increase in systemic bioavailable copper in infected animals. Heart acts as the major organ for diverting its copper reserves to systemic circulation to fight-off infection by downregulating its CTR1. Our study explores reciprocal mechanism of manipulation of host copper homeostasis pathway by macrophage and Leishmania to gain respective advantages in host-pathogen interaction.


Conflict of interest statement

The authors declare no competing interests.

Figures

Fig. 1
Fig. 1. Leishmania infection triggers host ATP7A trafficking and copper accumulation.
A Representative immunofluorescence image of CF4 dye or Ctrl-S2-CF4 dye (magenta) in J774A.1 macrophages with (INF) and without (BASAL) L.major infection (12 h). Both macrophage and Leishmania nuclei were stained with DAPI (blue). The merged images represent colocalization of the dyes with Leishmania nuclei. White arrows indicate intracellular parasites in infected cells (smaller nuclei). The scale bar represents 5 μm. The magnified inset corresponds to the region of the merged image marked by arrows indicating the association of CF4 with Leishmania-positive endosomes. B Fraction of dye colocalized with Leishmania nuclei from the above mentioned conditions demonstrated by a box plot with jitter points. The box represents the 25th to 75th percentiles, and the median in the middle. The whiskers show the data points within the range of 1.5× interquartile range from the first and third quartiles. Asterisks indicate values that are significantly different between CF4 and Ctrl-S2-CF4 treated sample. Sample size of macrophage (n): 12, ∗∗∗∗p ≤ 0.0001 (Wilcoxon rank-sum test). C Measurement of intracellular copper level in J774A.1 macrophages with (Inf 12 h) or without (Uninf) L.major infection using ICP-MS. Error bars represent mean ± SD of values calculated from three independent experiments. ns; (Student’s t test). D Immunofluorescence image of ATP7A (green) in J774A.1 macrophage with FluoSpheres™ Carboxylate-modified Microsphere beads (magenta) confirming absence ATP7A trafficking to those beads due to general phagoscytosis. Macrophage nuclei is stained with DAPI (blue). E Representative immunofluorescence image of ATP7A (green), co-stained with endo-lysosomal marker Lamp1 (magenta), in J774A.1 macrophages with and without L.major infection (12 h) followed by basal, high copper (100 μM Cu) and copper chelated conditions (25 μM TTM) treatment for 2 h. The merged images represent colocalization of ATP7A with Lamp1. Both macrophage and Leishmania nuclei were stained with DAPI (blue). White arrows indicate intracellular parasites in infected cells (smaller nuclei). White arrowheads indicate vesicularised ATP7A. The scale bar represents 5 μm. The magnified inset corresponds to the region of the merged image marked by arrows indicating the association of ATP7A and Lamp1 with Leishmania-positive endosomes. F Fraction of ATP7A colocalization with Lamp1 from the above mentioned conditions demonstrated by a box plot with jitter points. The box represents the 25th to 75th percentiles, and the median in the middle. The whiskers show the data points within the range of 1.5× interquartile range from the first and third quartiles. Asterisks indicate values that are significantly different from Uninf samples. Sample size of macrophage (n): 15. ∗∗∗∗p ≤ 0.0001, ns; (Wilcoxon rank-sum test). G Fraction of ATP7A colocalization with L.major compartments from the above mentioned conditions demonstrated by a box plot with jitter points. The box represents the 25th to 75th percentiles, and the median in the middle. The whiskers show the data points within the range of 1.5× interquartile range from the first and third quartiles. ns indicates values that are not significantly different from Inf samples. Sample size of macrophage (n): 15. ns non significant; (Wilcoxon rank-sum test). H Number of ATP7A vesicles from the above mentioned conditions are plotted. Asterisks indicate values that are significantly different from Uninf samples. I Comparison of copper levels (in ppb/million cells) in Leishmania infective uninfected cells under different treatments. Error bars represent mean ± SD of values calculated from three independent experiments. Asterisks indicate values that are significantly different from Uninf samples. ∗∗p ≤ 0.01, ∗∗∗p ≤ 0.001, ∗∗∗∗p ≤ 0.0001, ns; (Student’s t test).
Fig. 2
Fig. 2. L. major infection causes degradation of host ATP7A by modulating regulatory proteins upstream of it.
A Immunoblot of ATP7A at indicated time points after infecting J774A.1 macrophages with L.major promastigotes. The fold changes of ATP7A abundance normalized against housekeeping control GAPDH have been mentioned. B qRT–PCR shows ATP7A transcript level at indicated time points after infection, normalized against uninfected control and housekeeping control GAPDH mRNA levels. Error bars represent mean ± SD of values calculated from three independent experiments. Asterisks indicate values that are significantly different from Uninf samples.∗p ≤ 0.05, ns; (Student’s t test). C Immunoblot of ATP7A from infected and uninfected J774A.1 macrophages for 3 h with or without co-treatment with MG132 or Bafilomycin A1. The fold changes of ATP7A abundance normalized against housekeeping control GAPDH have been mentioned. D qRT–PCR shows COMMD1 transcript level at 3 h and 12 h time points after infection, normalized against uninfected control and housekeeping control GAPDH mRNA levels. Error bars represent mean ± SD of values calculated from three independent experiments. Asterisks indicate values that are significantly different from Uninf samples. ∗∗∗∗p ≤ 0.0001, ns; (Student’s t test). E qRT–PCR shows Clusterin transcript level at 3 h and 12 h time points after infection, normalized against uninfected control and housekeeping control GAPDH mRNA levels. Error bars represent mean ± SD of values calculated from three independent experiments. Asterisks indicate values that are significantly different from Uninf samples. ∗∗∗∗p ≤ 0.0001, ns; (Student’s t test). F Immunoblot of COMMD1 after 3 h infection. The fold changes of Clusterin abundance normalized against housekeeping control GAPDH have been mentioned. G Immunoblot of Clusterin from infected and uninfected cells with or without pretreatment with MG132 or BafilomycinA1. P denoted Clusterin precursor and α denoted Clusterin alpha chain. The fold changes of Clusterin precursor abundance normalized against housekeeping control GAPDH have been mentioned. The same GAPDH loading control was used for the infected samples in Fig. 2G, F.
Fig. 3
Fig. 3. L. major infection triggers deglycosylation of host ATP7A.
A Immunoblot of ATP7A at 3 h and 12 h time points after 1 μg/ml tunicamycin treatment of J774A.1 macrophages. GAPDH is used as a housekeeping control. B Immunoblot of ATP7A after infecting J774A.1 macrophages with L. major promastigotes for 3 h compared to 12 h of 1 μg/ml tunicamycin treatment. GAPDH is used as loading control. C Immunoblot of ATP7A after treatment with PNGase for 1 h. GAPDH is used as housekeeping protein. D Illustration depicting the proposed modulation of ATP7A via the manipulation of its upstream regulators by the L.major pathogen. Illustration is prepared in Inkscape 1.2.2. Previously created elements include Proteasome- Proteasome by CristofferSevilla is licensed under CC BY 4.0 / modified, Promastigote - Leishmania promastigote form by CristofferSevilla is licensed under CC BY 4.0 /modified, Amastigote - Leishmania amastigote form by CristofferSevilla is licensed under CC BY 4.0 /modified.
Fig. 4
Fig. 4. Knocking down of host ATP7A and CTR1 enhances the infectivity of the Leishmania pathogen.
A Illustration depicting the mammalian copper uptake and utilization pathway. Copper secretory pathway is highlighted. Illustration is prepared in Inkscape 1.2.2. B J774A.1 macrophages, after treatment with scrambled, ATP7A, CTR1 and ATOX1 siRNA, were infected with L. major. After 12 h, amastigote counts inside the macrophage are plotted. At least 100 macrophages were counted from triplicate experiments. Error bars represent mean ± SD of values from three independent experiments. Asterisks indicate values that are significantly different from Scrambled samples. p ≤ 0.05, ∗∗∗∗p ≤ 0.0001; (Student’s t test). C J774A.1 macrophages, after treatment with scrambled, ATP7A, CTR1 and ATOX1 siRNA, were infected with L. major. After 12 h, Ct values of L. major kDNA are plotted. Error bars represent mean ± SD of values from three independent experiments. Asterisks indicate values that are significantly different from Scrambled samples. ∗∗∗∗p ≤ 0.0001, ns; (Student’s t test). D Immunoblot of ATOX1 at 3 h time point after infecting J774A.1 macrophages with L. major promastigotes. The fold change of ATOX1 abundance normalized against housekeeping control GAPDH has been mentioned. E Immunoblot of CTR1 at indicated time points after infecting J774A.1 macrophages with L. major promastigotes. T denotes CTR1 trimer, I denotes Intermediate band, GM denotes glycosylated monomer, UM denotes unglycosylated monomer. The fold changes of CTR1 glycosylated monomer abundance normalized against housekeeping control GAPDH have been mentioned. GAPDH loading control is same for Figs. 2A and 4E where same conditions were used to check the protein levels of ATP7A and CTR1. F qRT–PCR shows CTR1 transcript level at indicated time points after infection, normalized against uninfected control and housekeeping control GAPDH mRNA levels. Error bars represent mean ± SD of values calculated from three independent experiments. Asterisks indicate values that are significantly different from Uninf samples.p ≤ 0.05, ∗∗p ≤ 0.01, ∗∗∗p ≤ 0.001, ns; (Student’s t test).
Fig. 5
Fig. 5. Leishmania manipulates host CTR1 in multiple ways to reduce copper import.
A Representative immunofluorescence image of CTR1 (green), co-stained with plasma membrane marker Na/K-ATPase (magenta), in J774A.1 macrophages with and without L. major infection (12 h) followed by basal, high copper (100 μM Cu) and copper chelated conditions (25 μM TTM) treatment for 2 h. The merged images represent colocalization of CTR1 with Na/K-ATPase. Both macrophage and Leishmania nuclei were stained with DAPI (blue). White arrows indicate intracellular parasites in infected cells (smaller nuclei). White arrowheads indicate endocystosed CTR1. The scale bar represents 5 μm. B Fraction of CTR1 colocalization with Na/K-ATPase from the above mentioned conditions demonstrated by a box plot with jitter points. The box represents the 25th to 75th percentiles, and the median in the middle. The whiskers show the data points within the range of 1.5× interquartile range from the first and third quartiles. Asterisks indicate values that are significantly different from Uninf samples. Sample size of macrophage (n): 14, ∗∗∗p ≤ 0.001,∗∗∗∗p ≤ 0.0001, ns; (Wilcoxon rank-sum test). C Fraction of CTR1 colocalization with L.major compartments from the above mentioned conditions demonstrated by a box plot with jitter points. The box represents the 25th to 75th percentiles, and the median in the middle. The whiskers show the data points within the range of 1.5× interquartile range from the first and third quartiles. ns indicates values that are not significantly different from Inf samples. Sample size of macrophage (n): 14. ns non significant; (Wilcoxon rank-sum test). D Immunoblot of CTR1 of J774A.1 macrophages with or without infection (12 h) followed by indicated copper conditions. GAPDH is used as housekeeping control. E Immunoblot of CTR1 from infected and uninfected J774A.1 macrophages for 3 h with or without co-treatment with MG132 or Bafilomycin A1. The fold changes of CTR1 glycosylated monomer abundance normalized against housekeeping control GAPDH have been mentioned. F Immunoblot of CTR1 of J774A.1 macrophages after N-Glycosidase (PNGase 1 h) or O-glycosidase (O-Glycosidase & Neuraminidase Bundle 1 h) treatment. GAPDH is used as loading control. G Immunoblot of CTR1 from elute of biotin-streptavidin based pulldown of modified cysteine containing proteins from J774A.1 macrophages; and whole cell lystaes, with or without infection for 3 h. Fold changes of CTR1 in infected samples of the elute of the biotin pulldown normalized against uninfected control have been mentioned. GAPDH is used as housekeeping control for whole cell lysate.
Fig. 6
Fig. 6. Increased bioavailable copper dampens Leishmania infection in vivo.
A Measurement of whole serum copper in serum samples of mice from indicated treatment conditions using ICP-MS and (B) Ceruloplasmin (Cp) level from the same samples and normalized to that of the untreated mice at 4 weeks post-infection. Error bars represent mean ± SD of values. Asterisks indicate values that are significantly different from Untreated mice. Sample size (n): 6 for each condition. p ≤ 0.05, ∗∗p ≤ 0.01, ∗∗∗∗p ≤ 0.0001, ns; (Student’s t test). C Represenattive images of lesion development in left footpad of infected and uninfected BALb/c mice at different copper treatments at 15 weeks post-infection. The scale bar represents 0.5 cm. D Line graph with markers representing progression of lesion development and size in footpad of BALB/c mice infected with L. major at different copper treatments. Lesion development was determined by weekly measuring the swelling with a caliper. The data correspond to the mean ± SD of values obtained from three individual mice in each group. Asterisks indicate values that are significantly different from Infection mice. Sample size (n): 6 for each condition. p ≤ 0.05, ∗∗p ≤ 0.01, ∗∗∗p ≤ 0.001,∗∗∗∗p ≤ 0.0001, ns; (Student’s t test). E Parasite load in the infected footpad was determined at week 15 post-infection by limiting dilution assay. Asterisks indicate values that are significantly different from Infection mice. Sample size (n): 6 for each condition from each group, ∗∗∗∗p ≤ 0.0001, ∗∗p ≤ 0.01, (Student’s t test). F Leishmania load in the infected footpad was determined by Ct values of L. major kDNA of infected mice 15 weeks post- infection at different copper conditions. Asterisks indicate values that are significantly different from Infection mice. Sample size (n): 6 for each condition. p ≤ 0.05, ∗∗p ≤ 0.01 (Student’s t test). G Measurement of whole serum copper in serum samples of mice from indicated treatment conditions using ICP-MS and (H) Ceruloplasmin (Cp) level from the same samples and normalized to that of the untreated mice at 15 weeks post-infection. Error bars represent mean ± SD of values. Asterisks indicate values that are significantly different from Untreated mice. Sample size (n): 6 for each condition. p ≤ 0.05, ∗∗p ≤ 0.01, ∗∗∗p ≤ 0.001, ∗∗∗∗p ≤ 0.0001, (Student’s t test). I Measurement of footpad tissue copper of mice from indicated treatment conditions using ICP-MS at 15 weeks post-infection. Error bars represent mean ± SD of values. Asterisks indicate values that are significantly different from Uninfected mice. Sample size (n): 6 for each condition, ∗∗p ≤ 0.01; (Student’s t test). J Immunoblot of ATP7A and CTR1 from left footpads of mice from indicated treatment conditions. The fold changes of ATP7A and CTR1 glycosylated monomer abundance normalized against housekeeping control α-tubulin have been mentioned. K Measurement of copper levels in the liver, intestine, heart, kidney, spleen and brain from infected and uninfected groups of mice using ICP-MS at 15 weeks post-infection. Error bars represent mean ± SD of values. Asterisks indicate values that are significantly different from Uninf mice. Sample size (n): 6 for each condition. Sample size (n): 6 for each condition, p ≤ 0.05, ∗∗p ≤ 0.01, ns non significant (Student’s t test). L Immunoblot of ATP7A and CTR1 from liver and heart tissue of infected and uninfected mice. The fold changes of ATP7A and CTR1 glycosylated monomer abundance normalized against housekeeping control α-tubulin have been mentioned.
Fig. 7
Fig. 7. Proposed model depicting the alteration of copper homeostasis pathway at cellular and systemic level upon Leishmania major infection.
Macrophage ATP7A and CTR1 face early reduction upon Leishmania infection but recover back to exert copper stress on pathogen. In BALB/c mice, infection results in increased systemic copper level, contributed by heart and liver, to fight the pathogen. Illustration is prepared in Inkscape 1.2.2. Previously created elements are listed here include Liver - 201405 liver icon by Database Center for Life Science or DBCLS is licensed under CC BY 4.0 via Wikimedia Commons /modified, Heart - Heart-front icon by Servier https://smart.servier.com/ is licensed under CC-BY 3.0/modified, Promastigote - Leishmania promastigote form by CristofferSevilla is licensed under CC BY 4.0 /modified, Amastigote - Leishmania amastigote form by CristofferSevilla is licensed under CC BY 4.0 /modified, Mice- Vector diagram of laboratory mouse (black and white) by Gwilz is licensed under CC BY-SA 4.0, via Wikimedia Commons /modified.

Similar articles

References

    1. Festa, R. A. & Thiele, D. J. Copper: an essential metal in biology. Curr. Biol.21, R877–R883 (2011). - PMC - PubMed
    1. Hodgkinson, V. & Petris, M. J. Copper homeostasis at the host-pathogen interface. J. Biol. Chem.287, 13549–13555 (2012). - PMC - PubMed
    1. Nevitt, T., Öhrvik & Thiele, H. D.J. Charting the travels of copper in eukaryotes from yeast to mammals. Biochim. Biophys. Acta1823, 1580–1593 (2012). - PMC - PubMed
    1. Kar, S. et al. Copper(II) import and reduction are dependent on His-Met clusters in the extracellular amino terminus of human copper transporter-1. J. Biol. Chem.298, 101631 (2022). - PMC - PubMed
    1. Kuo, Y. M., Zhou, B., Cosco, D. & Gitschier, J. The copper transporter CTR1 provides an essential function in mammalian embryonic development. Proc. Natl. Acad. Sci. USA98, 6836–6841 (2001). - PMC - PubMed