. 2024 Nov;27(11):2115-2129.
doi: 10.1038/s41593-024-01769-2. Epub 2024 Sep 30.

Proinflammatory immune cells disrupt angiogenesis and promote germinal matrix hemorrhage in prenatal human brain

Affiliations

Proinflammatory immune cells disrupt angiogenesis and promote germinal matrix hemorrhage in prenatal human brain

Jiapei Chen et al. Nat Neurosci. 2024 Nov.

Abstract

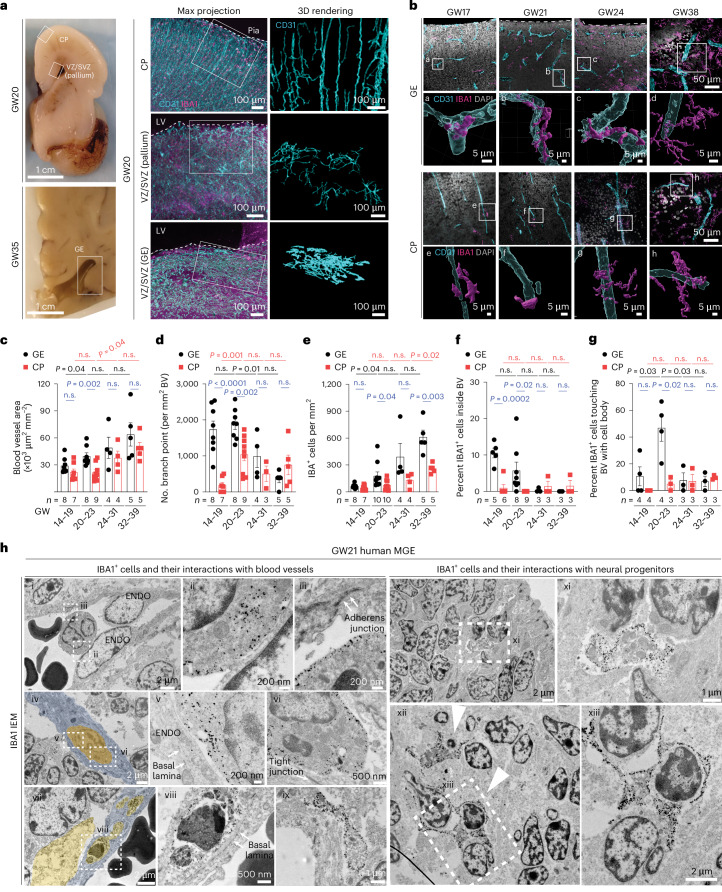
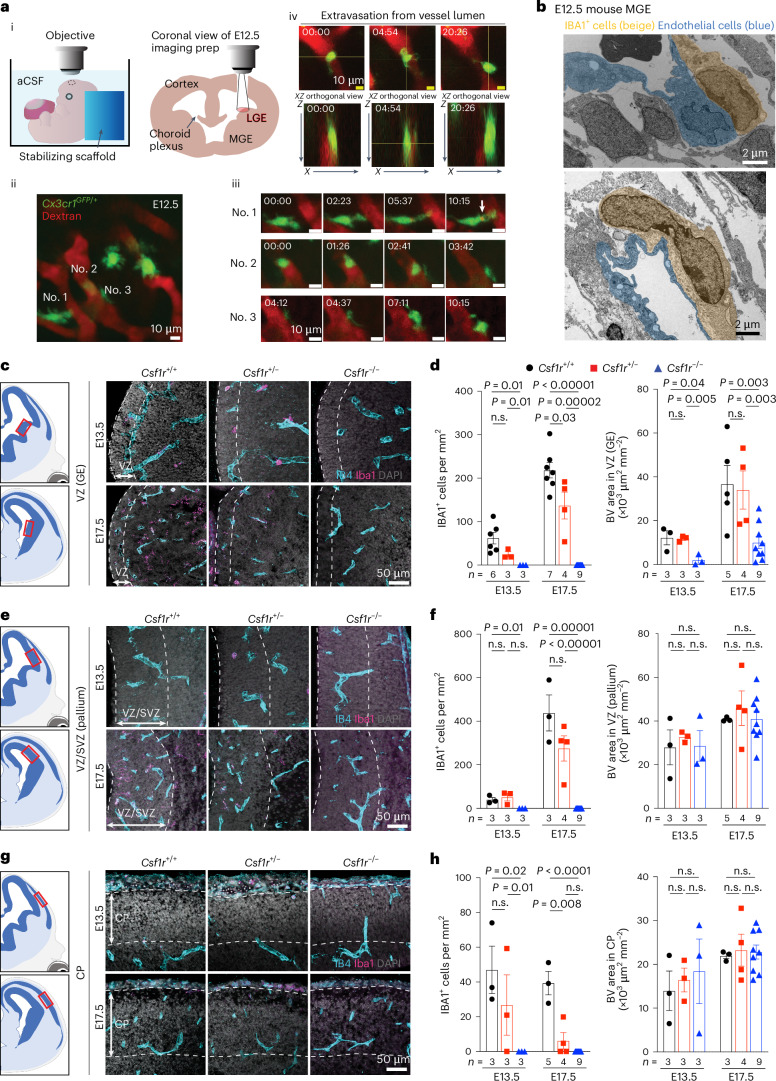
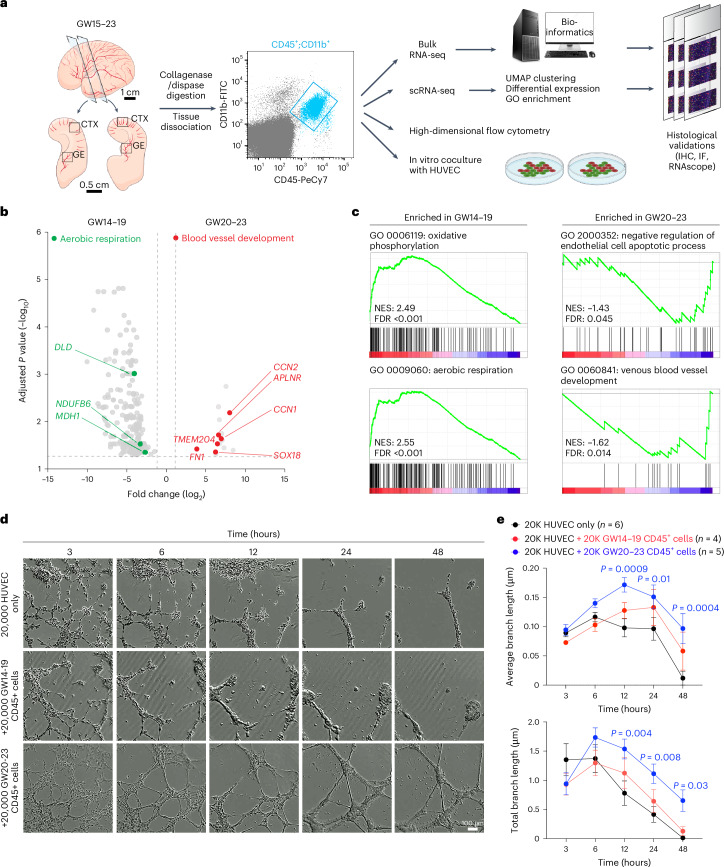
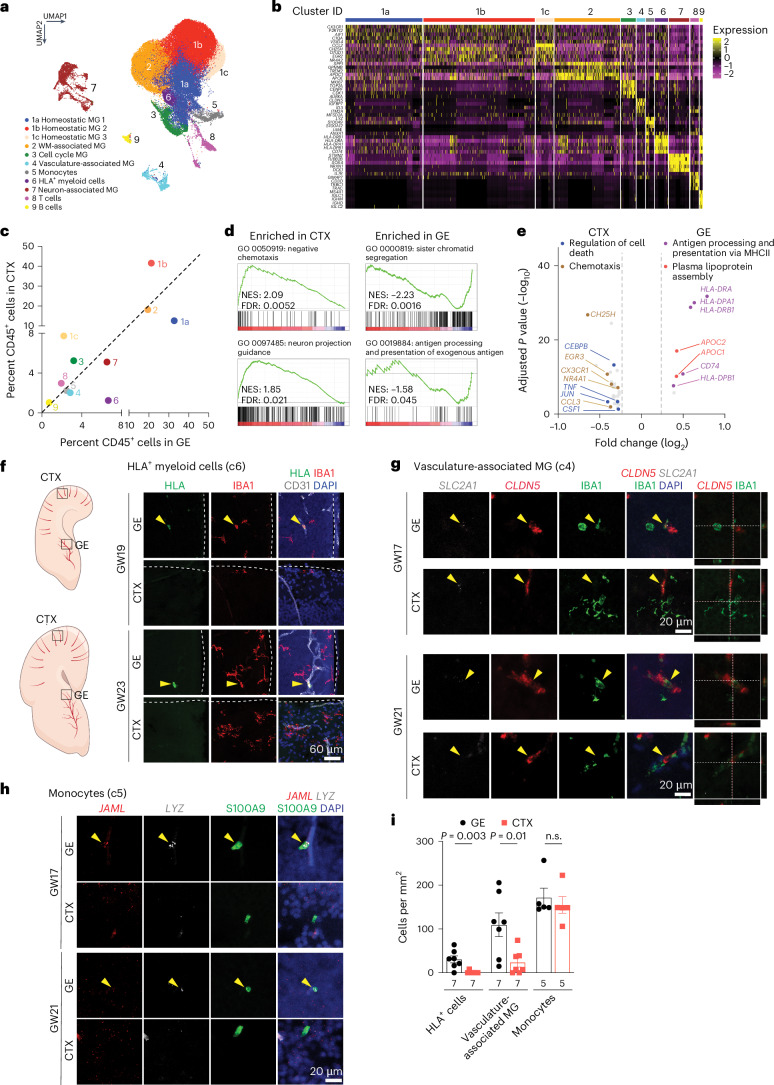
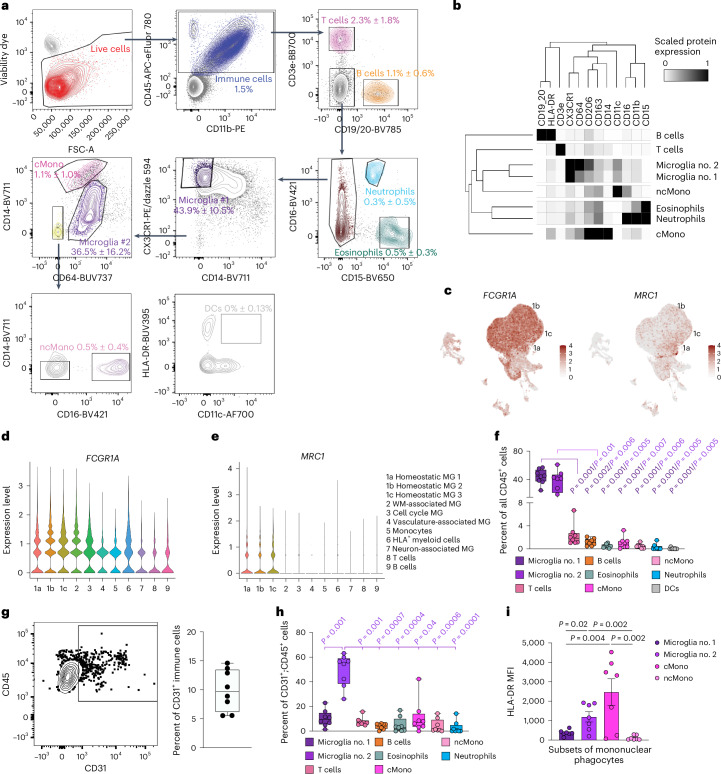
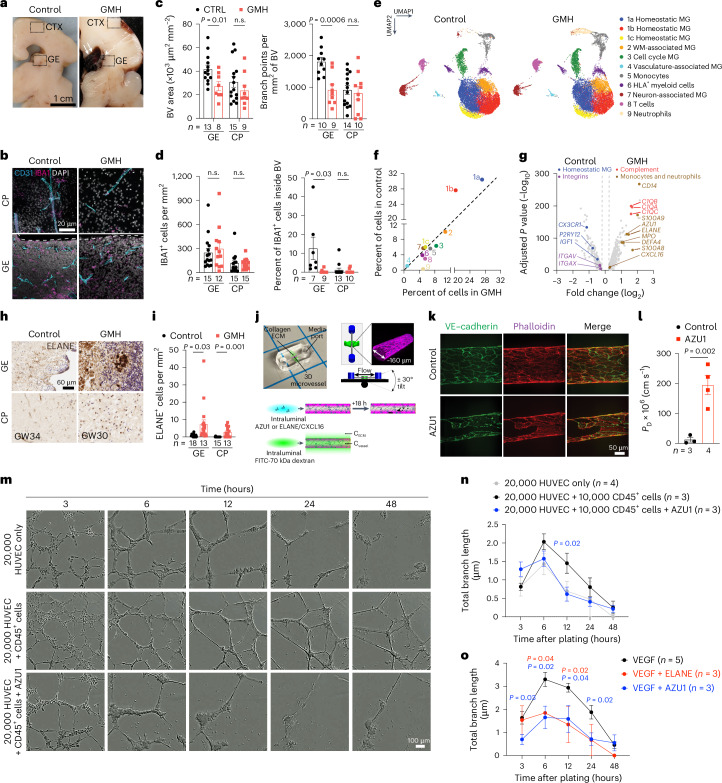
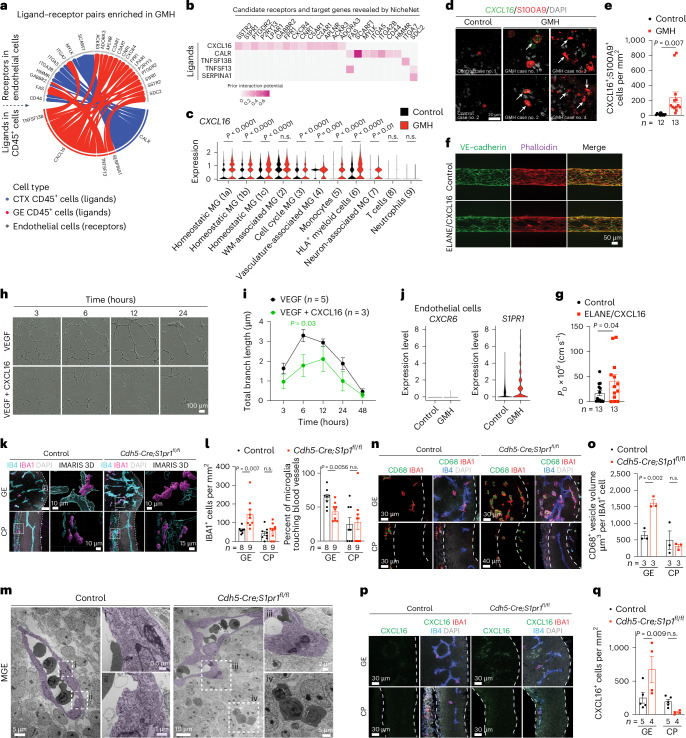
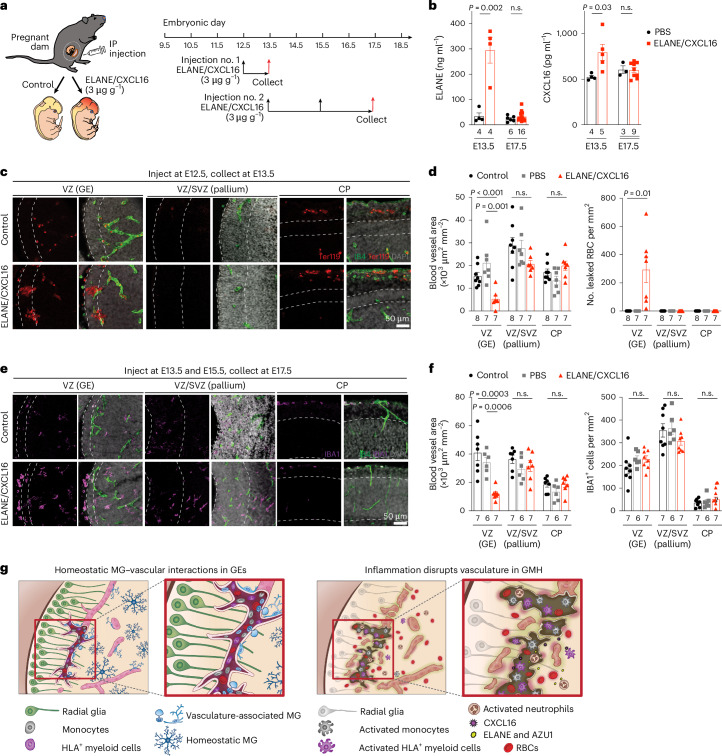
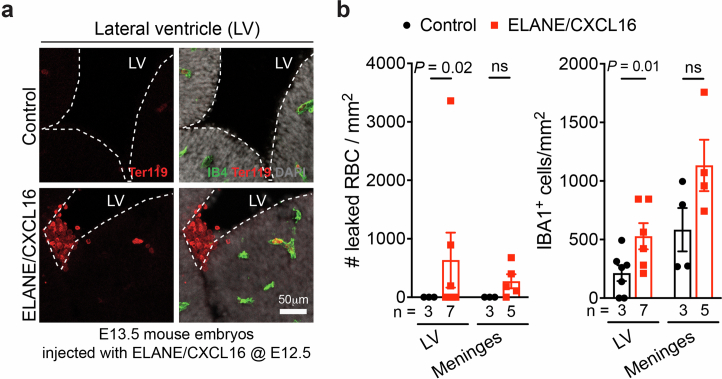
Germinal matrix hemorrhage (GMH) is a devastating neurodevelopmental condition affecting preterm infants, but why blood vessels in this brain region are vulnerable to rupture remains unknown. Here we show that microglia in prenatal mouse and human brain interact with nascent vasculature in an age-dependent manner and that ablation of these cells in mice reduces angiogenesis in the ganglionic eminences, which correspond to the human germinal matrix. Consistent with these findings, single-cell transcriptomics and flow cytometry show that distinct subsets of CD45+ cells from control preterm infants employ diverse signaling mechanisms to promote vascular network formation. In contrast, CD45+ cells from infants with GMH harbor activated neutrophils and monocytes that produce proinflammatory factors, including azurocidin 1, elastase and CXCL16, to disrupt vascular integrity and cause hemorrhage in ganglionic eminences. These results underscore the brain's innate immune cells in region-specific angiogenesis and how aberrant activation of these immune cells promotes GMH in preterm infants.


Conflict of interest statement

The authors declare no competing interests.

Figures

Fig. 1
Fig. 1. Macrophages/microglia interact with nascent vasculature in the second trimester human brain.
a, Left: coronal sections of prenatal human brain at GW20 and GW35, highlighting the GEs, VZ/SVZ of the pallium and cortical plate (CP). Middle: the light-sheet images in optically cleared coronal sections show the intricate interactions between IBA1+ cells and CD31+ endothelial cells in CP, VZ/SVZ of pallium and GEs. Right: IMARIS 3D images reveal the morphology of CD31+ endothelial cells in each brain region. LV, lateral ventricle. b, Confocal images and IMARIS 3D rendering of IBA1+ cells interacting with CD31+ endothelial cells in the GE and CP at GW17, GW21, GW24 and GW38. Images highlighted by white boxes are enlarged and represented in IMARIS 3D images in panels below (white letters a–h). c,d, Quantification of blood vessel and vascular branch point densities in the GE and CP in the prenatal human brain. eg, Quantification of the density of IBA1+ cells, the percentage of IBA1+ cells inside blood vessels and the percentage of extravascular IBA1+ cells touching blood vessels with cell body in the GE and CP. h, IEM using the IBA1 antibody shows macrophages and microglia inside blood vessels with primitive basal lamina and in the perivascular milieu in the MGE of prenatal human brain at GW21. The arrows in (iii) indicate primitive adherens junction in endothelial cells, and the arrowheads in (xii) indicate IBA1+microglia engulfing neuroblasts. The images in h are from one GW21 prenatal human brain. ENDO, endothelial cell. The same experiments were performed in another second trimester case at GW17 with the similar results. Statistics in cg use a two-tailed, unpaired Student’s t-test, and the data represent the mean ± standard error of the mean. n.s., not significant. n indicates the number of independent biological samples used for quantification.
Fig. 2
Fig. 2. Macrophages/microglia are required for angiogenesis in the ventricular zone of the GEs.
a. Live imaging of Cx3cr1+/GFP macrophages/microglia with nascent vasculature in the GEs. (i) Schematic diagrams of imaging setup for E12.5 LGE in Cx3cr1+/GFP mice. The embryo remains attached to placenta while bathed in artificial cerebrospinal fluid (aCSF). (ii) Max projection of an in vivo two-photon image with Cx3cr1+/GFP cells in LGE associated with blood vessels illuminated with Texas Red dextran. (iii) Still frames of timelapse images of three highlighted Cx3cr1+/GFP cells, with no. 1 extending the process into the blood vessel and taking up dextran (white arrow), no. 2 rolling within the blood vessel before releasing into the circulation and no. 3 moving along the surface of a blood vessel. (iv) Extravasation of a Cx3cr1+/GFP cell between the lumen and abluminal side. Orthogonal views show the macrophage against one vessel wall on the luminal side at time 0 min and against the vessel wall on the abluminal side at 20:26 min. b, IEM using IBA1 antibody shows IBA1+ macrophages and microglia directly attached to the endothelial cells in MGE of E12.5 mouse brain. This was performed in three biological replicates. c,e,g, Loss of CSF1R leads to complete ablation of IBA1+ cells in GE (c), VZ/SVZ of the pallium (e) and the cortical plate (CP) (g). The red boxes in the schematic diagrams show the regions captured in confocal images. d,f,h, Quantification of densities of IBA+ cells and IB4+ blood vessels in the VZ of GE (d), the SVZ/VZ of pallium (f) and the CP (h). The dashed lines indicate the regions in which blood vessel quantifications are performed. Statistics in d, f and h use a two-tailed, unpaired Student’s t-test, and the data represent the mean ± standard error of the mean. n.s., not significant. n indicates the number of independent biological samples used for quantification.
Fig. 3
Fig. 3. Stage-dependent role of CD45+ immune cells in promoting vascular morphogenesis.
a, Schematic diagrams showing the strategy to isolate CD45+;CD11b+ immune cells from the CTX and GE of prenatal human brain from GW15–23. These CD45+;CD11b+ cells are subjected to bulk RNA-seq and scRNA-seq, followed by bioinformatics analyses. The transcriptomic data are validated using immunohistochemistry (IHC), immunofluorescence microscopy (IF) and RNAscope-based in situ hybridization. Finally, CD45+;CD11b+ cells are further characterized using high-dimensional flow cytometry and 3D Matrigel HUVEC assays. b, A volcano plot showing the genes enriched in CD45+ cells from GW20–23 (right) and those enriched in cells from GW14–19 (left). Adjusted P values and fold changes were calculated using DESeq2. By default in DESeq2, the P values attained by the Wald test are corrected for multiple testing using the Benjamini–Hochberg method. The genes shown were filtered to be below the adjusted P value of 0.05 and above a fold change of 1.2 between GW14–19 and GW20–23 comparisons (highlighted by the dashed lines). c, GSEA reveals GO terms enriched in CD45+ cells from GW14–19 and GW20–23. The data in b and c are from 21 independent biological samples. NES, normalized enrichment score; FDR, false discovery rate. d, Images taken from InCucyte S3 Live Imaging Device of HUVEC in Matrigel-based branching morphogenesis at 3, 6, 12, 24 and 48 h after plating. The conditions include 20,000 HUVEC alone and 20,000 HUVEC cocultured with 20,000 GW14–19 or GW20–23 CD45+ cells from prenatal human brain. e, Quantification of average and total endothelial branch lengths formed by HUVEC. Statistics use a two-tailed, unpaired Student’s t-test, and the data represent the mean ± standard error of the mean. The P values represent comparisons between HUVEC coincubated with CD45+ cells versus HUVEC only. Not significant comparisons are not shown. n indicates the number of independent biological samples used for quantification. For each biological sample, at least three technical replicates are used.
Fig. 4
Fig. 4. Single-cell transcriptomics reveal subtypes of CD45+ cells and their interactions with endothelial cells in prenatal human brain.
a, UMAP plot highlighting 11 distinct CD45+ cell subtypes. b, A heat map of marker gene expressions that define each subtype of CD45+ cells. MG, microglia; WM, white matter. c, A distribution plot comparing the relative abundance of each CD45+ subtype in GE versus CTX. d, GSEA analysis of the bulk RNA-seq data reveal GO terms defined by genes enriched in GE versus CTX. e, A volcano plot showing DEGs identified by pseudobulked scRNA-seq data in GE versus CTX and the GO terms they define. Adjusted P values and fold changes were calculated using DESeq2. By default in DESeq2, the P values attained by the Wald test are corrected for multiple testing using the Benjamini–Hochberg method. The genes shown were filtered to be below the adjusted P value of 0.05 and above a fold change of 1.2 between CTX and GE comparisons (highlighted by the dashed lines). The data in ac and e are from five independent biological samples at GW17–23. The data in d are from 21 independent biological samples at GW15–23. f, Confocal images from GE and CTX of GW19 and GW23 human brain validating the presence of HLA+ cells in GE (yellow arrowheads) but not in CTX. White lines in ‘GE’ panels indicate the ventricular surface, whereas white lines in ‘Cortex’ panels indicate the pia surface. g, Confocal images of VAM markers SCL2A1 and CLDN5 (RNAscope probes) in IBA1+ cells in GE (yellow arrowheads) but not in CTX of GW17 and GW21 human brains. White lines indicate the section planes for the orthogonal views of CLND5+; IBA1+ vasculature-associated MG (right and bottom panels). h, Confocal images of monocyte markers JAML and LYZ (RNAscope probes) in S100A9+ cells in GE (yellow arrowheads) but not in CTX of GW17 and GW21 human brains. i, Quantification of the density of HLA+ cells, VAM and monocytes in GE and CTX of prenatal human brain. n.s., not significant. Statistics in i use a two-tailed, unpaired Student’s t-test, and the data represent the mean ± standard error of the mean. n indicates the number of independent biological samples used for quantification.
Fig. 5
Fig. 5. High-dimensional flow cytometry characterizes subtypes of CD45+ immune cells in prenatal human brain.
a, Gating strategy used in high-dimensional flow cytometry to distinguish nine different immune cell types, including T cells, B cells, neutrophils, eosinophils, microglia, BAM, classical monocytes (cMono), non-classical monocytes (ncMono) and dendritic cells (DCs). Briefly, within single live CD45+ immune cells, CD3e and CD19/20 positively gate T cells and B cells, respectively. From CD3e;CD19/20 cells, CD15+;CD16+ cells are gated as neutrophils and CD15+;CD16 cells are gated as eosinophils. Among CD15 cells, microglia no. 1 are gated as CX3CR1hi;CD14lo. All the remaining cells that not designated as microglia no. 1 then proceed to the next gating, in which CD64hi;CD14lo cells are gated as microglia no. 2, and CD64lo;CD14hi cells are gated as cMono. Within CD64;CD14 cells, CD16+ cells are gated asn ncMono. CD11c and HLA-DR markers confirm that HLA-DR+ cells are not likely to be DCs. b, A heat map showing expression levels of cell surface markers in each immune cell subtype from high-dimensional flow cytometry. ce, Feature plots (c) and violin plots showing the expression of FCGR1A (CD64) (d) and MRC1 (CD206) (e) transcripts based on scRNA-seq data in Fig. 4a. MG, microglia; WM, white matter. f, Relative abundance of different immune cell subtypes among all CD45+ cells. g,h, Gating strategy for CD45+;CD31+ cells and the relative abundance of CD45+;CD31+ cells among all CD45+ cells. i, Mean fluorescence intensity (MFI) of HLA-DR in microglia no. 1, microglia no. 2, cMono and ncMono. Statistics in i use a one-way analysis of variance with a Mann–Whitney test, and the data represent the mean ± standard error of the mean. For the box and whisker plots in fh, the center lines denote the median values (50th percentile), the boxes contain the 25–75th percentiles of the dataset, and the whiskers mark the minimal and maximal values. The data in b and fi are from eight independent biological samples.
Fig. 6
Fig. 6. Single-cell transcriptomics in CD45+ cells from GMH cases reveal activated neutrophils.
a, Gross images of a control prenatal brain (GW23) and a brain with GMH (GW24). b, IBA1+ cells and their relationship with CD31+ endothelial cells in the GE and cortical plate (CP) of control and GMH human brains. c, Quantification of densities of blood vessels and vascular branch points in the GE and CP of control and GMH cases. d, Quantification of IBA1+ cells and percentage of intravascular IBA1+ cells in the GE and CP of control and GMH cases. e, UMAP comparing CD45+ subtypes from GMH cases and age-matched control. MG, microglia; WM, white matter. f, A distribution plot comparing the relative abundance of CD45+ subtype in control versus GMH cases. g, A volcano plot showing DEGs and GO terms identified by pseudobulked scRNA-seq data in CD45+ cells from GMH versus control cases. The adjusted P values and fold changes were calculated using DESeq2. By default in DESeq2, the P values attained by the Wald test are corrected for multiple testing using the Benjamini–Hochberg method. The dashed lines indicate cutoffs for Pvalue of 0.05 and fold change of 1.2. The data from e, f and g are from two independent biological samples in each condition (control, GMH). hi, Immunohistochemical stain for ELANE show increased number of neutrophils in the GE and CP of GMH cases. j, Experimental setup of in vitro vascular permeeability assay using 3D microfluidic microvessels. k, Fluorescence micrographs of VE–cadherin and actin in control and AZU1-treated microvessels. l, Quantification of vascular permeability in control and AZU1-treated microvessels. m, Images of HUVEC in Matrigel-based branching morphogenesis. n,o, Quantification of average and total endothelial branch lengths formed by HUVEC in Matrigel-based assays, showing neutrophil proteins (AZU1, ELANE) can suppress CD45+ cell-mediated (n) or VEGF-mediated (o) vascular morphogenesis. Statistics in c, d, i, l, n and o use a two-tailed, unpaired Student’s t-test, and the data represent the mean ± standard error of the mean. n.s., not significant. In n, the P values represent comparisons between HUVEC coincubated with CD45+ cells versus HUVEC only. In o, the P values represent comparisons between VEGF-primed HUVEC treated with AZU1 or ELANE versus VEGF-primed HUVEC only.
Fig. 7
Fig. 7. Dysregulated CXCL16S1PR1 signaling disrupts angiogenesis in GE.
a,b, A wheel plot (a) and heat map (b) from NicheNet analysis reveal ligand–receptor pairs between CD45+ immune cells and CD31+ endothelial cells dysregulated in GMH cases. The color intensity in the heat map indicates interaction potential (b). c, Violin plots show upregulated CXCL16 expression in most CD45+ subtypes in GMH cases. The data from ac are from two independent biological samples in control and GMH cases. MG, microglia. WM, white matter. d,e, Images (d) and quantification (e) of Cxcl16+ and S100A9+ cells in GEs of control and GMH cases. Arrows in d indicate CXCL16+ and S100A9+ cells. f,g, Images (f) and quantification (g) of ELANE/CXCL16-treated microvessels show disorganization of VE–cadherin and actin and increased vascular permeability. h,i, Images (h) and quantification (i) of HUVEC branching morphogenesis treated with VEGF or VEGFand CXCL16. j, Violin plots show the expression of CXCR6 and S1PR1 in endothelial cells from control or GMH samples. k, Confocal and IMARIS 3D images of IBA1+ cells interacting with IB4+ vasculature in E12.5 control and Cdh5Cre;S1pr1fl/fl mice. White boxes indicate areas in the confocal images where enlarged IMARIS 3D images are captured. l, IBA1+ cell density and the percentage of IBA1+ cells touching blood vessels in the GE and cortical plate (CP) of E12.5 control and Cdh5Cre;S1pr1fl/fl mice. m, TEM shows myeloid cells inside the vascular lumen and in the brain parenchyma in the MGE of E12.5 control and Cdh5Cre;S1pr1fl/fl mice. The subdivisions (i–iv) show further magnification of TEM images. n,o, Confocal images and quantification show increased volume of CD68+ vesicles in IBA1+ cells in the GE of Cdh5Cre;S1pr1fl/fl mice (n) compared with the age-matched control (o). The dotted white lines define boundaries of the GE and CP where IBA1+ cells are quantified. p,q, Confocal images and quantification show increased density of CXCL16+ cells in the GE of Cdh5Cre;S1pr1fl/fl mice (p) compared with age-matched control (q). Statistics in c, e, g, i, l, o and q use a two-tailed, unpaired Student’s t-test, and the data represent the mean ± standard error of the mean. n.s., not significant. n indicates the number of independent biological samples used for quantification.
Fig. 8
Fig. 8. Proinflammatory factors ELANE and CXCL16 disrupt vasculature in GEs to promote hemorrhage in embryonic mouse brain.
a, Schematic diagram showing two schedules of ELANE and CXCL16 intraperitoneal (IP) injection in pregnant mouse dams for embryonic brain tissue collection at E13.5 and E17.5. b, ELANE and CXCL16 protein concentrations in the plasma of PBS-injected control and ELANE/CXCL16-injected pregnant dams. c, Immunostaining with IB4 and Ter119 show leaked red blood cells in the GE but not in VZ/SVZ of the pallium or cortical plate (CP) of control or ELANE/CXCL16-injected embryos at E13.5. d, Quantifications of densities of blood vessels and leaked red blood cells (RBC) in VZ of the GE, VZ/SVZ of the pallium and CP in control of PBS-injected or ELANE/CXCL16-injected embryos at E13.5. e, Immunostaining with IB4 and IBA1 show reduced vascular density and increased ameboid morphology in IBA1+ cells in VZ of the GE but not in VZ/SVZ of the pallium or CP in ELANE/CXCL16-injected embryos at E17.5. f, Quantifications of densities of blood vessels and IBA1+ cells in VZ of the GE, VZ/SVZ of the pallium and CP in non-injected control of PBS-injected or ELANE/CXCL16-injected embryos at E17.5. Statistics in b, d and f use a two-tailed, unpaired Student’s t-test; n.s., not significant. n indicates the number of independent biological samples used for quantification. g, Left: schematic diagram depicting how subsets of CD45+ immune cells, including monocytes (gray), HLA+ myeloid cells (purple) and VAM (light blue) interact with the nascent vasculature to promote angiogenesis in the germinal matrix during the second trimester in prenatal human brain. Right: activated neutrophils produce bactericidal factors, such as ELANE and AZU1, whereas activated monocytes produce CXCL16 to create a proinflammatory milieu that disrupts nascent vasculature and promotes GMH. MG, microglia.
Extended Data Fig. 1
Extended Data Fig. 1. Vector mapping of the nascent vasculature and ultrastructural analyses of their relationship with IBA1+ cells in the second trimester human brain.
(a) Lateral view and coronal plane of prenatal human brain at gestational week 20 (GW20), highlighting the cortex (CTX) section that was used for tissue clearing (left column). A separate block from the ganglionic eminence (GE) was obtained from GW35 prenatal brain (right column). Tissue clearing process and index matching using SHIELD and iDISCO to render thick tissue sections optically transparent (right column). (b) Vector mapping of the orientations of the nascent vasculature in the ventricular zone and subventricular zone (VZ/SVZ) in GE and in the cortical plate (CP) at GW14-19, GW20-23, GW24-28, and GW33-39. The results are complied based on 3 independent biological samples for each age group. (c) Left panels: Tiled low magnification images of IBA1 immuno-gold stained sections that cover the cortical plate and VZ/SVZ in a GW17 human brain. (Right panels) Higher magnification images of the brain regions in panel c, which highlight the regions of cortical plate (i and ii) and VZ/SVZ (iii and iv) of the pallium. Arrows point to many IBA1+ cells near blood vessels or in the brain parenchyma. (d) IEM images highlighting IBA1+ cells (asterisks) near blood vessels in the cortical plate (i-ii) or their close proximity to neuroblasts in VZ/SVZ in the pallium (iii-iv) at GW17. (e) Left panels: Tiled low magnification images of IBA1 immuno-gold stained sections that cover the cortical plate and VZ/SVZ in a GW22 human brain. (Right panels) Higher magnification images of the brain regions in panel e, which highlight the regions of cortical plate (i and ii) and VZ/SVZ (iii and iv) of the pallium. Arrows point to many IBA1+ cells near blood vessels or in the brain parenchyma. (f) IEM images highlighting IBA1+ cells (asterisks) near blood vessels in the cortical plate (i-ii) or blood vessels in VZ/SVZ in the pallium (iii-iv) at GW22. (g) IEM images of the medial ganglion eminence (MGE) in a GW21 human brain highlighting IBA1+ macrophages or monocytes (panels i-iv), IBA1+ neutrophils (v-viii), and IBA1 immune cells (ix-xi) inside blood vessels.
Extended Data Fig. 2
Extended Data Fig. 2. Macrophages/ microglia cells interact with nascent vasculature in the embryonic mouse brain.
(a) Confocal images and IMARIS 3D rendering of IBA1+ cells interacting with IB4+ vasculature in GE and CP at E13.5, E17.5, and P0 in pre- and perinatal mouse brains. (b, c) Quantification of blood vessel and vascular branch point densities in GE and CP in the mouse brain. (d–g) Quantification of the density of IBA1+ cells, the percentage of IBA1+ cells inside blood vessels, and the percentage of IBA1+ cells touching the external surface of blood vessels with cell body or processes in GE and CP in the mouse brain. The number below each bar represents the number of biological replicates analyzed in each experiment. (h) Still image highlighting the full view of the lateral ganglionic eminence (LGE) in an E12.5 mouse embryo undergoing ex utero live imaging (i). A representative image showing three different behaviors of Cx3cr1+/GFP cells and quantification of these three different cell behaviors from a total of 97 cells from 9 mouse embryoes captured in live imaging. Statistics in panels b-g use two-tailed, unpaired Student’s t-test, data represent mean ± SEM. ns, not significant. n indicates the number of independent biological samples used for quantification.
Extended Data Fig. 3
Extended Data Fig. 3. Macrophage/ microglia promote angiogenesis in the ventricular zone (VZ) of the ganglionic eminences.
(a) Schematic diagram showing three schedules of CSF1R inhibitor PLX5622 injection in pregnant mouse dams. (b, d, f) Transient inhibition of CSF1R leads to significant depletion of IBA1+ cells in the VZ of GE (b), VZ/SVZ of the pallium (d), and the CP (f). (c, e, g) Quantification of densities of IBA+ cells and IB4+ blood vessels in the VZ of GE (c), VZ/SVZ of the pallium (e), and the CP (g). Dashed lines indicate the regions in which quantifications are performed. Statistics in panels c, e, and g use two-tailed, unpaired Student’s t-test, data represent mean ± SEM. ns, not significant. n indicates the number of independent biological samples used for quantification.
Extended Data Fig. 4
Extended Data Fig. 4. Stage-dependent role of human CD45+ immune cells in promoting vascular morphogenesis.
(a) Fluorescence-activated cell sorting (FACS) gating strategy to select for CD45+;CD11b+ cells. (b) Isotype controls used in FACS. (c) Heatmap of critical differentially expressed genes in CD45 and CD45+ cells used in bulk RNA-seq. (d) Volcano plot shows the genes enriched in CD45+ cells (right). Genes shown were filtered to be below adjusted p-value of 0.05 and above fold change of 1.2 between CD45 and CD45+ cells. (e) Gene set enrichment analysis (GSEA) reveals gene ontology (GO) terms enriched in CD45 and CD45+ cells. Data from panels c-e are from 3 independent biological samples of CD45 cells, and 21 independent biological samples of CD45+ cells. (f) Images taken from InCucyte S3 Live Imaging Device of HUVEC and AAV-CMV-GFP transfected CD45+ cells from prenatal human brain samples at 18 and 40 hrs after plating. (g) Images taken from InCucyte S3 Live Imaging Device of HUVEC at 3, 6, 12, 24 and 48 hrs after plating. The conditions include 20,000 HUVEC alone, and 20,000 HUVEC co-cultured with 10,000 GW14-19 or GW20-23 CD45+ cells from prenatal human brain. (h, i) Quantification of average and total endothelial branch lengths formed by HUVEC that are co-cultured with CD45+ cells (h) or CD45 cells (i). Statistics in panels h and i use two-tailed, unpaired Student’s t-test, data represent mean ± SEM. The P values represent comparisons between HUVECs co-incubated with CD45+ cells vs HUVECs only. Not significant comparisons are not shown. n indicates the number of independent biological samples used for quantification.
Extended Data Fig. 5
Extended Data Fig. 5. Single-cell transcriptomics reveal subtypes of CD45+ cells and their regional specificity.
(a-b) Quantifications of the number of genes, RNA molecules, and percentage of mitochondrial genes per cell, as well as predicted doublets from scRNA-seq. Each dot represents one cell. (c) UMAP feature plots of marker gene expressions that define each subtype of CD45+ cells. (d) Confocal images of white matter-associated microglia marker SPP1 (RNAscope probe) in IBA1+ cells in the internal capsule (IC) of GW14 and GW22 human brains. (e) Projection of published scRNA-seq datasets of microglia in prenatal human and mouse brain onto the UMAP plot of our scRNA-seq. (f) UMAP plots show differences in the clustering of CD45+ cell subtypes from the cerebral cortex at GW14-19 and GW20-23 (arrowheads), and the clustering of CD45+ cell subtypes from the ganglionic eminences at GW14-19 and GW20-23 (arrows). Data from panels a-c, e, and f are from 5 independent biological samples. (g) Confocal images of VAM markers IGFBP7 and MFSD2A (RNAscope probes) in IBA1+ cells in GE and cortex of GW17 and GW21 human brains. The experiments in panels d and g were repeated in three independent biological replicates.
Extended Data Fig. 6
Extended Data Fig. 6. Bioinformatic analyses reveal potential signaling mechanisms that regulate the interactions between CD45+ immune cells and different subtypes of endothelial cells.
(a) CellphoneDB analyses reveal stage-dependent communications via ligand-receptor pairs between CD45+ subtypes and CD31+ endothelial subtypes at GW14-19 and GW20-23. (b) NicheNet analyses predict signaling pathways used by homeostatic microglia (c1a), HLA+ myeloid cells, monocytes, and VAM to interact with endothelial subtypes at GW14-19 and GW20-23. Data from panels a and b are from 2 independent biological samples at GW14-19, and 3 independent biological samples at GW20-23. ENDO, endothelial cells. MG, microglia. (c) Quantification of average and total endothelial branch lengths formed by HUVEC in Matrigel-based assays. The conditions include EGM-2 media alone or addition of VEGF or IGF1, which is one of the ligands used by CD45+ cells identified by NicheNet. Statistics use two-tailed, unpaired Student’s t-test, data represent mean ± SEM. The P values represent comparisons between HUVECs treated with VEGF or IGF1 vs no treatment. Not significant comparisons are not shown. n indicates the number of independent biological samples used for quantification.
Extended Data Fig. 7
Extended Data Fig. 7. Single-cell transcriptomics in CD45+ cells from GMH cases reveal activation of proinflammatory transcriptomic profiles in monocytes, HLA+ myeloid cells, vasculature-associated microglia (VAM), neutrophils, and other immune cell types.
(a-b) Quantifications of the number of genes, RNA molecules, and percentage of mitochondrial genes per cell, as well as predicted doublets from scRNA-seq in age-matched CTRL and GMH cases. Each dot represents one cell. (c) UMAP feature plots of marker gene expressions that define each subtype of CD45+ cells. (d) UMAP feature plots of neutrophil transcripts ELANE, AZU1, and DEFA4 in CD45+ cells from CTRL or GMH cases. (e) Confocal images show higher abundance of ELANE+;CD16+ cells in the GE of GMH cases compared to age-matched controls. This experiment was repeated in same number of independent biological replicates for control and GMH cases as in Fig. 5e. (f) Gene burden analyses of the relative abundance of DEGs in all immune cell types. Data are from 2 independent biological samples in each condition (Control, GMH) and represent mean ± SEM. Each data point represents one pairwise comparision between a control and a GMH sample. (g-q) Volcano plots show differentially expressed genes from GMH vs CTRL cases in all CD45+ cell subtypes, including homeostatic microglia (MG), white matter-associated microglia (MG), cell cycle microglia (MG), vasculature-associated microglia (MG), monocytes, HLA+ myeloid cells, neuron-associated microglia (MG), T lymphocytes, and neutrophils. Adjusted P-values and fold changes were calculated from pseudo-bulked scRNA-seq data using DESeq2. By default in DESeq2, P-values attained by the Wald test are corrected for multiple testing using the Benjamini and Hochberg method. Genes shown were filtered to be below adjusted p-value of 0.05 and above fold change of 1.2 between CTRL and GMH comparisons. Vertical dashed lines indicate the boundary of significance in fold change. (s-t) Heatmap of GO terms in CD45+ cell subtypes highly associated with the GE vasculature, including monocytes, vasculature-associated microglia (MG), HLA+ myeloid cells, and neutrophils, which are upregulated (s) or downregulated (t) in GMH cases compared to age-matched controls. Data in all panels except e are from 2 independent biological samples in each condition (Control, GMH).
Extended Data Fig. 8
Extended Data Fig. 8. Dysregulated CXCL16-S1PR1 signaling disrupts angiogenesis in the GE.
(a) Confocal images show expression of tight junction ZO-1 in the GE of E12.5 CTRL and Cdh5Cre;S1pr1fl/fl mice. (b) Confocal images show similar proliferation in IBA1+ cells in the GE and CP of CTRL and Cdh5Cre;S1pr1fl/fl mice. (c–e) Confocal images and quantification show higher abundance of CD16+ cells in the GE of E12.5 Cdh5Cre;S1pr1fl/fl mice (c) and in the GE of GW24-25 human GMH cases (d, e), when compared to age-matched controls. CD68+ vesicle volume in IBA1+ cells remains unchanged between age-matched CTRL and GMH cases. n indicates the number of independent biological samples used for quantification. (f–h) Violin plots show upregulated (f), downregulated (g), and unchanged expressions (h) of key protein transcripts in most CD45+ cell subtypes from GMH cases, when compared to age-matched CTRL cases. Statistics in panel e use two-tailed, unpaired Student’s t-test, data represent mean ± SEM. ns, not significant. Data in panels f-h are from 2 independent biological samples in each condition (Control, GMH).
Extended Data Fig. 9
Extended Data Fig. 9. Exposure to proinflammatory factors ELANE and CXCL16 promotes intraventricular hemorrhage in embryonic mouse brain.
(a) Confocal microscopic images show intraventricular hemorrhage, characterized by the presence of Ter119+ red blood cells (RBCs) in the lateral ventricle adjacent to the medial ganglionic eminence (MGE). LV, lateral ventricle, IB4, isolectin B4, a vascular marker. (b) Quantification shows significantly higher numbers of RBCs and IBA1+ cells in the lateral ventricle, and subtle increases of RBCs and IBA1+ cells in the meninges over the cortical plate. Statistics use two-tailed, unpaired Student’s t-test, data represent mean ± SEM. ns, not significant. n indicates the number of independent biological samples used for quantification.
Extended Data Fig. 10
Extended Data Fig. 10. Confocal imaging, processing and quantifications of neural progenitors in GE and cortical plate.
(a, b) We defined the ventricular zone (VZ) in ganglionic eminences (GE) in E13.5 and E17.5 mouse brain using the expression of Sox2, which delineates an active neurogenic niche with a layer of proliferative neural progenitors. (c) For the pallium, we used phospho-histone 3 (PH3) and BrdU (2 hr injection paradigm) to define the ventricular zone/subventricular zone (VZ/SVZ) and cortical neuron marker Tbr1 to define the cortical plate.

References

    1. Hansen, D. V. et al. Non-epithelial stem cells and cortical interneuron production in the human ganglionic eminences. Nat. Neurosci.16, 1576–1587 (2013). - PMC - PubMed
    1. Ma, T. et al. Subcortical origins of human and monkey neocortical interneurons. Nat. Neurosci.16, 1588–1597 (2013). - PubMed
    1. Paredes, M. F. et al. Nests of dividing neuroblasts sustain interneuron production for the developing human brain. Science375, eabk2346 (2022). - PMC - PubMed
    1. Crouch, E. E. et al. Ensembles of endothelial and mural cells promote angiogenesis in prenatal human brain. Cell185, 3753–3769.e18 (2022). - PMC - PubMed
    1. Crouch, E. E., Joseph, T., Marsan, E. & Huang, E. J. Disentangling brain vasculature in neurogenesis and neurodegeneration using single-cell transcriptomics. Trends Neurosci.46, 551–565 (2023). - PMC - PubMed