. 2024 Sep 30;7(1):1223.
doi: 10.1038/s42003-024-06874-3.

Cpt1a Drives primed-to-naïve pluripotency transition through lipid remodeling

Affiliations

Cpt1a Drives primed-to-naïve pluripotency transition through lipid remodeling

Zhaoyi Ma et al. Commun Biol. .

Abstract

Metabolism has been implicated in cell fate determination, particularly through epigenetic modifications. Similarly, lipid remodeling also plays a role in regulating cell fate. Here, we present comprehensive lipidomics analysis during BMP4-driven primed to naive pluripotency transition or BiPNT and demonstrate that lipid remodeling plays an essential role. We further identify Cpt1a as a rate-limiting factor in BiPNT, driving lipid remodeling and metabolic reprogramming while simultaneously increasing intracellular acetyl-CoA levels and enhancing H3K27ac at chromatin open sites. Perturbation of BiPNT by histone acetylation inhibitors suppresses lipid remodeling and pluripotency transition. Together, our study suggests that lipid remodeling promotes pluripotency transitions and further regulates cell fate decisions, implicating Cpt1a as a critical regulator between primed-naive cell fate control.


Conflict of interest statement

The authors declare no competing interests.

Figures
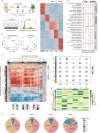
Fig. 1
Fig. 1. Integrative analysis of transcriptomics and lipidomics reveals lipid remodeling in Primed-to-Naive pluripotency transition.
a Schematic overview for transcriptomics, metabolomics, and lipidomics profiling of BMP4 induced Primed-Naïve Transition (BiPNT). LC-MS, Liquid Chromatography Mass Spectrometry. b Principal component analysis of transcriptomics and lipidomics showed the lipid remodeling during the PNT process. c k-means clustering classified approximately 3000 metabolism-associated genes into five clusters. Each cluster corresponding to a distinct timepoint. Distinct colors represent corresponding timepoints. d KEGG pathway analysis of the five stage-specific metabolic gene clusters from c. e Correlation matrix visualizing coordination of lipid species and lipid-related genes. Lipid species (n = 1260 genes) correlate with lipid metabolism genes throughout PNT. Difference colors represent distinct lipid clusters, gene clusters, and lipid classes. f Bubble plot depicting mean expression of each gene cluster in PNT. Different gene clusters were annotated using the corresponding colors indicated in e. g Lipid class and saturation enrichment for six lipid clusters (significance calculated by a hypergeometric test against total lipidome with false discovery rate adjustment). Different lipid clusters and lipid classes were annotated using the corresponding colors found in e. h Pie charts representing the distribution of over-enriched lipid clusters for differentially abundant lipid species in altered samples relative to EpiSC (D0) samples. FA Fatty acids, GL glycerolipids, GP glycerophospholipids, SP sphingolipids, ST sterol lipids, PR prenol lipids. CAR Acly carnitines, Cer ceramide, DG diacylglycerol, FFA free fatty acid, HexCer hexosylceramide, LPE lysophosphatidylcholine, LPC lysophosphatidylethanolamine, PC phosphatidylcholine, PC-O alkyl-ether-linked phosphatidylcholine, PE phosphatidylethanolamine, PE-O alkyl-ether-linked phosphatidylethanolamine, PE-P vinyl-ether-linked phosphatidylethanolamine, SM sphingomyelin, TG triacylglyceride. MUFA monounsaturated fatty acids, PUFA polyunsaturated fatty acids, SFA saturated fatty acids. Source data are provided as Supplementary Data 1.
Fig. 2
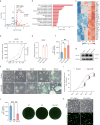
Fig. 2. Expression levels of Cpt1a directly affect BiPNT efficiency.
a The difference of the transcriptional profiles between EpiSCs and rESCs based on Gene cluster 4 (G4). Significantly upregulated genes in rESCs (compared with EpiSCs, log2 fold change (log2 FC > 1.5) are in red, and downregulated (log2 FC < -1.5) ones are in blue. b GO functional enrichment of upregulated genes (from G4) in rESCs. c Expression patterns of fatty acid metabolism genes (from b) in PNT. Distinct colors represent corresponding timepoints. d Comparison of transcriptional profiles between embryonic development (GSE100597) and PNT. e RT–qPCR analysis validating the expression of Cpt1a between Control and Cpt1a-OE. Data are mean ± s.e.m.; n = 3 biological replicates. f Numbers of Oct4-GFP positive colonies for PNT in Control and Cpt1a-OE. Data are mean ± s.e.m. Statistical analysis was performed using one-way ANOVA; n  =  3 biological replicates. Cpt1a-OE1 vs. Control, **P = 0.0076; Cpt1a-OE2 vs. Control, **P = 0.0007. Scale bar, 5 mm. g Immunoblot analysis of the expression of CPT1A on Day 3. h Representative images of PNT between Control and Cpt1a-OE at the indicated days. Scale bars, 250μm. i FACS analysis of GFP+ cells at distinct time points during PNT. Data are mean ± s.e.m. Statistical analysis was performed using two-way ANOVA; n  =  3 biological replicates. ****P < 0.0001. j PNT efficiency for the Cpt1a knockout or rescue experiments. Data are mean ± s.e.m. Statistical analysis was performed using one-way ANOVA; n = 3 biological replicates. WT vs. KO, ****P < 0.0001; KO + OE vs. KO, ***P = 0.0001. Scale bar, 5 mm. k Images of WT and Cpt1a-KO rESCs cultured in 2iL medium. Scale bar, 250μm. The experiments in g, h and k were repeated independently three times with similar results. Source data are provided as Supplementary Data 1.
Fig. 3
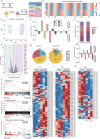
Fig. 3. Cpt1a-driven lipid remodeling.
a Flow chart for multi-omics analysis between Control and Cpt1a-OE at Day 3 of the PNT process. b Average z-score of lipid-related genes (n = 1260) based on Cpt1a status (Day 3) stratified by previously defined gene clusters. c Principal component analysis of lipidomics distinguishing Control and Cpt1a-OE. d Volcano plot highlighting differentially abundant lipids (species % of class) in Cpt1a-OE of Day 3. Upregulated in OE showing purple. Significantly altered lipids are colored by species (P-value < 0.05). e Gene-set enrichment analysis (GSEA) analysis of the lipid metabolism genes, pluripotency genes and triglyceride metabolic process of Cpt1a-OE condition comparison to Control. NES = 1.51 in pluripotency; NES = 1.25 in lipid metabolism; NES = 1.78 in triglyceride metabolism. f Number of lipid species altered with Cpt1a status previously defined lipid clusters. g Pie charts comparing the distribution of lipid classes between Control and Cpt1a-OE among significant lipids. h Top, stacked bar chart showing lipid distribution (% of total) within DG, TG, PC, PE under Control and Cpt1a-OE conditions. Bottom, the number of lipid species altered with Cpt1a status in the top chart. i Heatmap of relative abundance of PC in Control and Cpt1a-OE condition. n = 3 biological replicates. j Heatmap of relative abundance of PE in Control and Cpt1a-OE condition. n = 3 biological replicates. k Heatmap of relative abundance of DG in Control and Cpt1a-OE condition. n = 3 biological replicates. Source data are provided as Supplementary Data 1.
Fig. 4
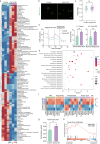
Fig. 4. Cpt1a-driven metabolic reprogramming.
a Heatmap of relative abundance of differential metabolites in Control and Cpt1a-OE condition. n = 3 biological replicates. b Representative confocal images of mitochondria on Day 3 of the BiPNT system, under Control or Cpt1a-OE conditions and subsequently stained with MitoTracker Green. Scale bar, 10μm. c Quantification of mitochondrial length by aspect ratio on Day 3 of the BiPNT system, under Control or Cpt1a-OE conditions as shown in (A). Data are mean ± s.e.m. Statistical analysis was performed using a two-sided unpaired t-test; n = 29 cells from Control and n = 32 cells from OE condition. ns, non-significant. d Oxygen consumption rate (OCR) trace of Control and Cpt1a-OE conditions in Day 3. Data are mean ± s.d. Statistical analysis was performed using a two-sided unpaired t-test; n = 4 technical replicates from one of two independent experiments. Basal respiration **P = 0.0091, Max respiration **P = 0.0025. e KEGG pathway analysis of significantly changed metabolites and genes using MetaboAnalyst. Shape indicates type of omics; Size for counts of features; Color for significance. f Heatmap of the expression difference of representative metabolic genes altered with Cpt1a status. FAO, fatty acid oxidation; OP, oxidative phosphorylation; and other means of metabolic process. Different colors represent corresponding metabolic pathways. g The concentration of acetyl-CoA in Control and Cpt1a-OE conditions was measured by LC-MS. Data are mean ± s.d. n = 3 biological replicates. *P = 0.0151. h GSEA analysis of acetyl-CoA metabolic genes of Cpt1a-OE condition comparison to Control. NES = 1.81. Source data are provided as Supplementary Data 1.
Fig. 5
Fig. 5. Overexpression of Cpt1a augments H3K27 acetylation.
a Global signal of H3K27ac between Control and Cpt1a-OE conditions. Boxplots denote the medians and the interquartile ranges (IQR). P-value from two-sided Student’s t-test. b Heatmap illustrating the density of H3K27ac binding sites on Day 3 under Control or Cpt1a-OE conditions, showing all binding events centered on the peak region within a 5 kb window around the peak. c Pie charts showing the genomic distribution of the peaks identified by H3K27ac in Control, Cpt1a-OE and Overlap. d Bar chart showing the distance from H3K27ac-binding sites to TSSs in Control and Cpt1a-OE. e Average profiles of H3K27ac signals at enhancer and promoter showing the H3K27ac level changes upon Cpt1a-OE at the pluripotent and lipid metabolic genes. f Venn diagram indicating the number of genes up-regulated at both H3K27ac and transcriptional levels in Cpt1a-OE. 53 transcription factors are listed in the bottom box. g RT-qPCR analysis for expression of Naïve pluripotent markers and lipid metabolic genes in Control and Cpt1a-OE conditions at Day 3 of BiPNT. Data are mean ± s.e.m. Statistical analysis was performed using a two-sided unpaired t-test; n = 3 biological replicates. *p < 0.05, **p < 0.01, ***p < 0.001, ****p < 0.0001. h Functional enrichment analysis of the overlapped genes in f. Source data are provided as Supplementary Data 1.
Fig. 6
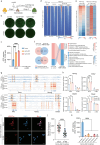
Fig. 6. A-485 disrupts lipid remodeling and pluripotent gene expression, significantly reducing PNT efficiency.
a Schematic of A-485 treated on Day 2 and removed on Day 3 for further analysis. A-485 work concentration = 1 μM. b Whole well fluorescent images of resetting cultures with the protocol in without or with A-485 treatment. Scale bars, 5 mm. The experiments were repeated independently three times with similar results. c Quantification for b. Data are mean ± s.e.m. Statistical analysis was performed using two-way ANOVA; n = 3 biological replicates. Cpt1a-OE1 vs. Control in Mock ****p < 0.0001, Cpt1a-OE2 vs. Control in Mock ****p < 0.0001, ns, non-significant. d Heatmap showing ATAC-seq signals at open chromatin sites on Day 3 of the BiPNT system, alongside corresponding H3K27ac signals at these ATAC-seq peaks, under control conditions and OE conditions treated without or with A-485. e Heatmap showing down-regulated genes after A-485 treatment under OE conditions, along with corresponding H3K27ac signals for these down-regulated genes. f Left, Venn diagrams showing DEGs in both Cpt1a-OE (relative to Control) and A-485 treatment in OE condition (relative to Mock). Right, Sankey plot showing rescued genes in A-485 treatment. GO term and pathway enrichment analyses for upregulated (red) and downregulated DEGs (blue) are displayed on the right. Enrichment levels are presented with different color intensities. g Cut&Tag seq (H3K27ac) and RNA-seq tracks of indicated genes in Day 3 BiPNT cells without or with A-485 treatment. h RT-qPCR analysis for expression of Naïve pluripotent markers and lipid metabolic genes at Day 3 of BiPNT without or with A-485 treatment. Data are mean ± s.e.m. Statistical analysis was performed using two-way ANOVA; n = 3 biological replicates. *p < 0.05, **p < 0.01, ***p < 0.001, ****p < 0.0001. i Immunostaining of H3K27ac in Day 3 BiPNT cells without or with A-485 treatment. Scale bars, 20μm. j Immunostaining quantification of H3K27ac relative intensities in i. Statistical analysis was performed using a two-sided unpaired t-test; n = 60 cells from Mock and n = 60 cells from A485 condition. ****p < 0.0001. k Numbers of Oct4-GFP positive colonies with Scramble and shCBP/P300 in OE conditions. Data are mean ± s.e.m. Statistical analysis was performed using one-way ANOVA; n = 3 biological replicates. ****P  <  0.0001. Source data are provided as Supplementary Data 1.
Fig. 7
Fig. 7. Schematic diagram of lipid remodeling drives BiPNT.
In BiPNT, Cpt1a-driven lipid remodeling and metabolic reprogramming are essential. Glycerides like TG and DG are active in metabolism, some transform into FFAs for Cpt1a-mediated mitochondrial fatty acid oxidation, yielding acetyl-CoA. The rest contribute to glycerophospholipids like PE and PC synthesis for cellular functions. Acetyl-CoA not only contributes to the TCA cycle and metabolic activation but also triggers an increase in histone acetylation. Conversely, the histone acetyltransferase (HAT) inhibitor A-485 impedes histone acetylation, thereby inhibiting lipid remodeling and the BiPNT process. Therefore, Cpt1a drives the BiPNT process by promoting lipid remodeling and enhancing histone acetylation.

Similar articles

Cited by

References

    1. Wu, J., Ocampo, A. & Belmonte, J. C. I. Cellular metabolism and induced pluripotency. Cell166, 1371–1385 (2016). - PubMed
    1. Ryall, J. G., Cliff, T., Dalton, S. & Sartorelli, V. Metabolic reprogramming of stem cell epigenetics. Cell Stem Cell17, 651–662 (2015). - PMC - PubMed
    1. Liu, K., Cao, J., Shi, X., Wang, L. & Zhao, T. Cellular metabolism and homeostasis in pluripotency regulation. Protein Cell11, 630–640 (2020). - PMC - PubMed
    1. Zhang, J. et al. Metabolism in Pluripotent stem cells and early mammalian development. Cell Metab.27, 332–338 (2018). - PubMed
    1. Sperber, H. et al. The metabolome regulates the epigenetic landscape during naive-to-primed human embryonic stem cell transition. Nat. Cell Biol.17, 1523–1535 (2015). - PMC - PubMed

Substances