. 2024 Sep 30;4(1):186.
doi: 10.1038/s43856-024-00610-y.

Developing a Coccidioides posadasii and SARS-CoV-2 Co-infection Model in the K18-hACE2 Transgenic Mouse

Affiliations

Developing a Coccidioides posadasii and SARS-CoV-2 Co-infection Model in the K18-hACE2 Transgenic Mouse

Daniel R Kollath et al. Commun Med (Lond). .

Abstract

Background: Early reports showed that patients with COVID-19 had recrudescence of previously resolved coccidioidomycosis (Valley fever, VF), and there were indications that coinfection had more severe outcomes. We therefore investigated serial infection of Coccidioides posadasii and SARS-CoV-2 in a K18-hACE2 mouse model to assess disease outcomes.

Methods: In our model, we challenged K18-hACE2 mice sequentially with a sub-lethal dose of SARS-CoV-2 and 24 hours later with low virulence strain of Coccidioides posadasii, and vice versa, compared to mice that only received a single infection challenge. We performed survival and pathogenesis mouse studies as well as looked at the systemic immune response differences between treatment groups.

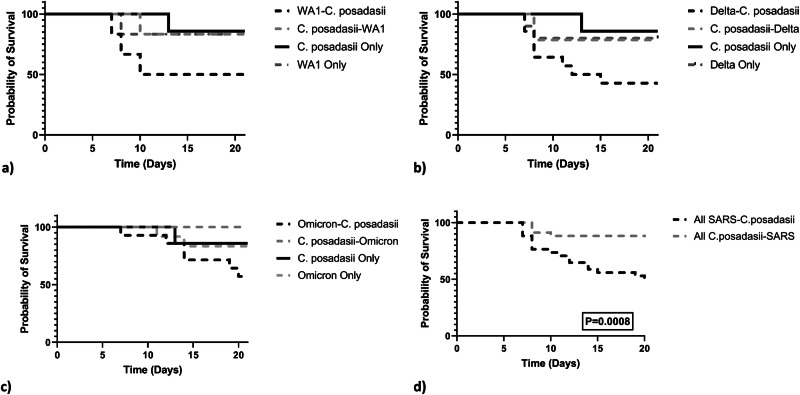
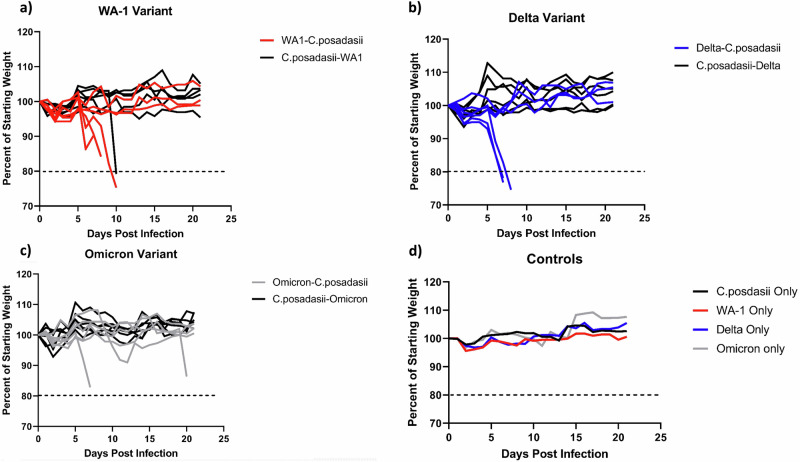
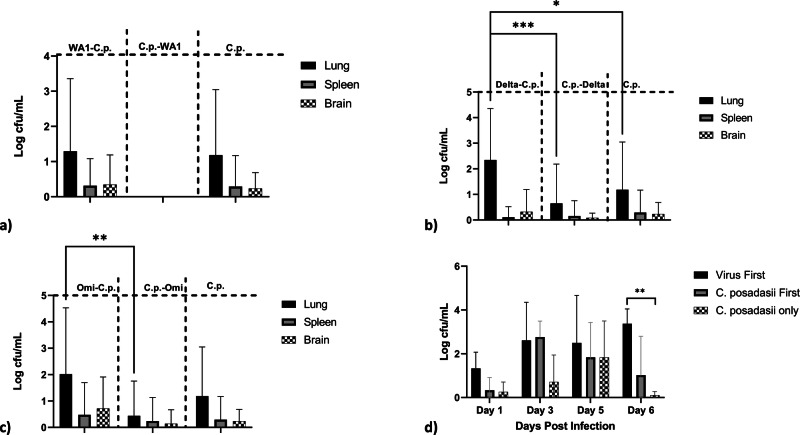
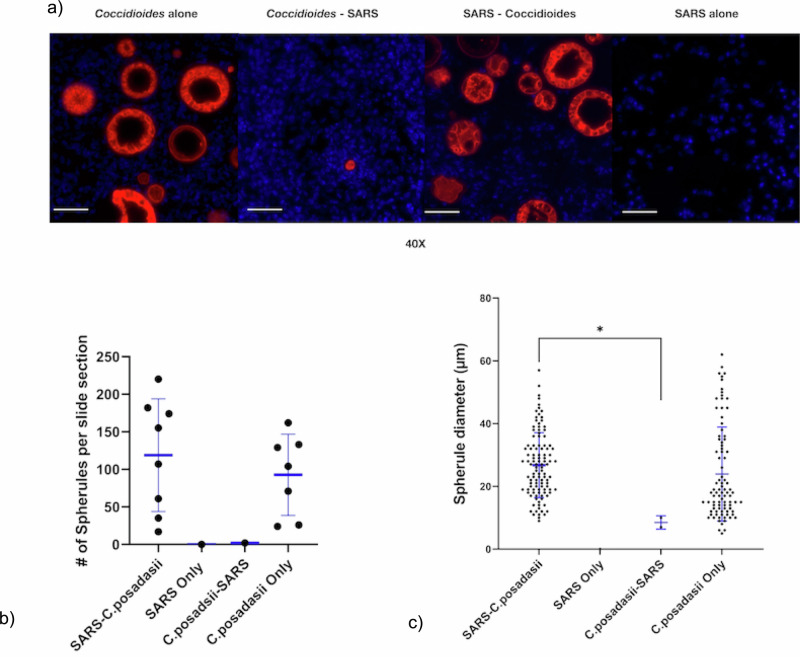
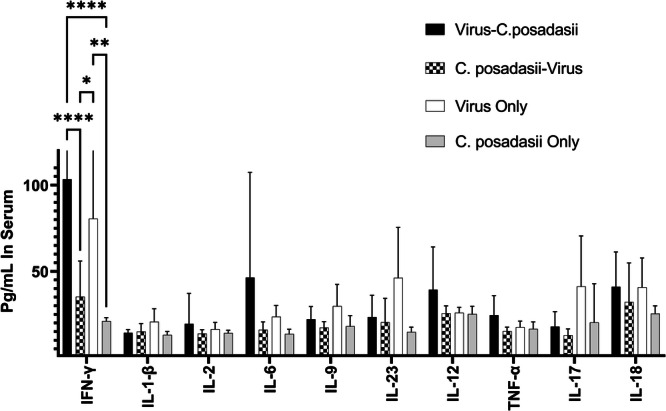
Results: Here we show that co-infected groups have a more severe disease progression as well as a decrease in survival. Importantly, results differ depending on the SARS-CoV-2 variant (WA-1, Delta, or Omicron) and infection timing (SARS-CoV-2 first, C. posadasii second or vice versa). We find that groups that are infected with the virus first had a decrease in survival, increased morbidity and weight loss, increased fungal and viral burdens, differences in immune responses, and the amount and size of fungal spherules. We also find that groups coinfected with C. posadasii first have a decrease fungal burden and inflammatory responses.

Conclusions: This is the first in vivo model investigation of a coinfection of SARS-CoV-2 and Coccidioides. Because of the potential for increased severity of disease in a coinfection, we suggest populations that live in areas of high coccidioidomycosis endemicity may experience higher incidence of complicated disease progression with COVID-19.

Plain language summary

The Covid-19 pandemic presented significant challenges to healthcare systems. One of these was the increase in secondary infections, where a patient had both SARS-Cov2 and another infectious disease. Fungal infections co-occurring with or after a Covid-19 infection are of interest due to treatment challenges and more severe illness in patients. Valley fever is a fungal infection prevalent in the southwestern United States and arid regions of Central and South America. Reports from these regions showed an increase in Valley fever cases coinciding with the rise of Covid-19. We therefore investigated how these two pathogens interacted with each other and the host in laboratory-controlled mouse experiments. We observed increased mortality when mice were exposed to the virus first followed by a fungal infection. Although more investigations are needed, our results should be taken into consideration in a clinical setting.


Conflict of interest statement

The authors declare no competing interests

Figures

Fig. 1
Fig. 1. Viral variant and coinfection influence mortality.
There are significant differences in Kaplan-Meier survival curves between infection groups separated by viral variant. A WA-1 variant B Delta Variant and C) Omicron variant. All virus-C. posadasii groups, except for Omicron, had significant declining survival when compared to C. posadasii-only mice (WA-1 p = 0.04, Delta p = 0.01, Omicron p = 0.11). D Combining virus-C. posadasii and C. posadasii-virus mice, irrespective of viral strain for simplicity, Log-rank Mantel was used for pairwise comparison of each survival curve. The test shows a significant difference between the two treatment groups (p = 0.0008). The y-axis represents the probability of survival and the x-axis is days post infection. Criteria for euthanizing mice were based on weight loss (20% loss of starting body weight) or a poor condition score as described in methods.
Fig. 2
Fig. 2. SARS-CoV2 followed by C. posadasii co-infected mice have increased morbidity.
Morbidity was quantified by weight loss during infection. Weight loss was more severe for SARS-CoV-2 regardless of variant followed by C. posadasii challenge. Weight loss progression differs by viral variant. Weights were monitored daily and are represented as percent of starting body weight depicted as average per group. A WA-1 variant co-infected group n = 12. B Delta Variant n = 24 and C) Omicron n = 24 variant. D Single pathogen controls averaged percent weight loss per group WA-1 only n = 6, Delta only n = 12, Omicron only n = 12, C. posadasii only n = 12.
Fig. 3
Fig. 3. Fungal burden is increased in SARS-CoV-2 followed by C. posadasii coinfected mice.
Fungal burden is represented in log colony forming units (CFUs) per milliliter of tissue homogenate. Fungal burden was assessed in surviving mice at experimental end point (day 21). A WA-1 viral variant B Delta viral variant C Omicron viral variant. D WA-1 viral variant infected mice were used in a pathogenesis study, three male mice were euthanized at days 1, 3, 5, and 6 postinfection and lung tissues were harvested and cultured. Analysis of variance (ANOVA) followed by Tukey’s Multiple comparison test were used to assess differences between treatment groups in both experiments. Asterisks indicate significant relationships (N = 3 mice per day per group).
Fig. 4
Fig. 4. Viral burden is increased in SARS-CoV2-C. posadasii mice at early time points.
Viral burden was assessed in the lungs at days 1, 3, 5, and 6 post infection of the secondary pathogen. Viral variant WA-1 was used for this pathogenesis study. Viral burden is represented in log viral RNA copies per milligram of lung tissue of the different treatment groups. Mice that received a SARS-CoV-2 first followed by a C. posadasii challenge had a higher viral burden in early infection. However, C. posadasii first followed by SARS-CoV-2 challenge mice have a delayed increase in viral burden at day 6. Analysis of variance (ANOVA) followed by Tukey’s Multiple comparison test were used to assess differences between treatment groups. Asterisks indicate significant relationships (N = 3 mice per day per group).
Fig. 5
Fig. 5. Detection of Coccidioides spherules by immunofluorescence in FFPE lung tissues.
Representative images from all viral variants from day 10 post infection were used for detection by immunofluorescence A Immunofluorescence staining to detect Coccidioides spherules/ endospores (red) in FFPE lung tissue from mice infected with one or both pathogens. Nuclei are stained blue (DAPI). Images are captured under a 40x objective and scale bars are 50 µm in all images. B Average numbers of intact spherules per randomized slide images. C We used a two-way ANOVA to determine if there are differences in spherule diameter between the groups (p = 0.02). Diameters of intact spherules in the randomized slide section images, compared with an unpaired t-test the virus first group has significantly larger spherules then the fungus first group (p = 0.014). Asterisks indicate significant relationships. Scale bars are 50 microns.
Fig. 6
Fig. 6. A Coccidioides infection prior to a SARS-CoV-2 infection reduces the inflammatory environment.
Day 5 and 6 sera were subjected to analysis using a commercial cytokine and chemokine panel to examine circulating immune markers between the different treatment groups. There was a more robust immune response in the virus first infected groups dominated by IFN-γ and other pro-inflammatory cytokines. (A two-way ANOVA revealed differences in cytokine concentrations between the infection groups; p < 0.0001, N = 3 mice per day per group).
Fig. 7
Fig. 7. Heat map of differential cytokine/chemokine expression.
Z-scores were computed by subtracting the mean and then dividing by the standard deviation. The computed Z-score was then used to create the heat map. The brighter the green the more upregulated the immune marker and the brighter the blue the more down regulated the immune marker compared to the other treatment groups (N = 3 mice per day per group).

Similar articles

References

    1. Brown, G. D. et al. Hidden killers: human fungal infections. Sci. Transl. Med.4, 165rv13 (2012). - PubMed
    1. Salazar, F. et al. Pathogenesis of respiratory viral and fungal coinfections. Clin. Microbiol. Rev.35, e00094-21 (2022). - PMC - PubMed
    1. Kirkland, T. N. & Fierer, J. Coccidioides immitis and posadasii; A review of their biology, genomics, pathogenesis, and host immunity. Virulence9, 1426–1435 (2018). - PMC - PubMed
    1. Blair, J. E., Ampel, N. M. & Hoover, S. E. Coccidioidomycosis in selected immunosuppressed hosts. Med. Mycol.57, S56–S63 (2019). - PubMed
    1. Rosenstein, N. E. et al. Risk factors for severe pulmonary and disseminated coccidioidomycosis: Kern County, California, 1995–1996. Clin. Infect. Dis.32, 708–714 (2001). - PubMed

LinkOut - more resources