. 2024 Sep 30;14(1):22676.
doi: 10.1038/s41598-024-73825-7.

Activity of the hypothalamic neuropeptide Y increases in adult and decreases in old rats

Affiliations

Activity of the hypothalamic neuropeptide Y increases in adult and decreases in old rats

Szimonetta Eitmann et al. Sci Rep. .

Abstract

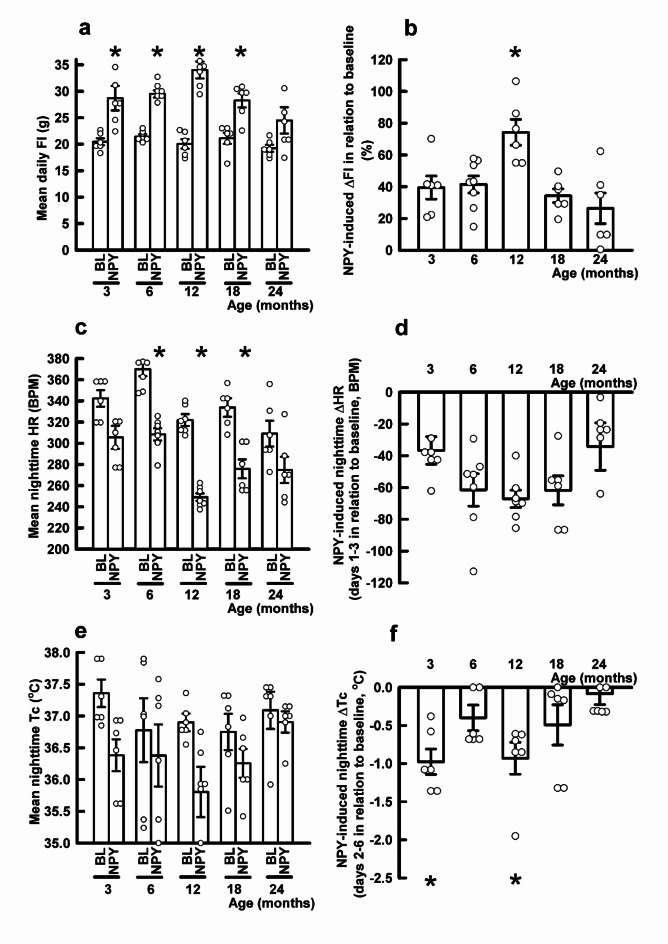
Middle-aged obesity and aging anorexia with muscle loss (sarcopenia) of old people present public health burden. These alterations may appear both in humans and rodents suggesting the role for regulatory alterations. Previously, we demonstrated that biphasic changes in the weight-reducing (catabolic) effects of neuropeptides of the hypothalamus-adipose tissue axis (e.g. leptin) may contribute to both trends. With regard to the anabolic effects of the hypothalamic neuropeptide Y (NPY) inhibited by leptin, we hypothesized non-linear age-related changes with shifts in the opposite directions. We investigated the orexigenic and hypometabolic effects of intracerebroventricularly administered NPY (hyperphagia induced by NPY injection or changes in food intake, body weight, heart rate, body temperature, locomotor activity during a 7-day NPY infusion), the immunoreactivity and gene expression of NPY in the hypothalamic arcuate nucleus of male Wistar rats of five age groups from young to old. The orexigenic/hypometabolic efficacy and the immunoreactivity of NPY increased in middle-aged animals preceding the peak of adiposity observed in aging rats, then decreased preceding anorexia and weight loss in old rats. These shifts may contribute to the development of both age-related obesity and aging anorexia, sarcopenia, and should be considered in future drug development targeting the NPY system.

Keywords: Aging anorexia; Metabolism; Obesity.


Conflict of interest statement

The authors declare no competing interests.

Figures

Fig. 1
Fig. 1
Age-related changes in body weight (BW, a) of male Wistar rats, and their adiposity index (b), muscle index (c), muscle strength (d) and daily food intake (e). All data in bar plots are expressed as mean ± S.E.M. (n = 6–9/group) and were analyzed by one-way ANOVA with Tukey’s post hoc test. (a) * indicates significant differences between the 3-month vs. all other age groups (p < 0.001 in all cases); # indicates significant difference between the 6-month-old vs. 18-month-old group (p = 0.045). (b) # indicates significant difference between the 3-month-old vs. 12- or 18-month-old groups (p = 0.014 or 0.001, respectively), * indicates significant difference between the 24-month-old vs. 18-month-old group (p = 0.015). (c) * indicate significant differences between the 18- or 24-month-old vs. 3-, 6-, 12-month-old groups (p < 0.001 in all cases). (d) * indicates significant difference between the 24-month-old vs. all other age groups (p < 0.001 in all cases). (e) * indicates significant difference between the 24-month-old vs. 3- or 6-month-old groups (p = 0.010 or 0.008, respectively).
Fig. 2
Fig. 2
Age-related changes in orexigenic responsiveness to central injection of NPY of male Wistar rats. Cumulative 1-h FI (food intake) induced by intracerebroventricularly injected NPY or pyrogen-free saline (PFS) expressed in g (a). NPY-induced FI of rats presented as ratio (%, b) to their own spontaneous 24-h FI (shown in Fig. 1e). All data in bar plots are expressed as mean ± S.E.M. (n = 6–9/group) and were analyzed by one-way ANOVA with Tukey’s post hoc test. (a) * indicate significant differences between age-matched NPY- vs. PFS-treated groups (p < 0.001 in 3-, 6-, 12- and 18-month-old rats), § indicates significant differences between the 12 months vs. 6-, 18-, 24-month-old groups (p < 0.001 in all cases), # indicates significant difference between the 24-month-old vs. 3- or 6-month-old group (p < 0.001 or p = 0.047, respectively). (b) * indicates significant differences between the 12 months vs. 3-month-old or all other age groups (p = 0.018 or p < 0.001, respectively), # indicates significant difference between the 24-month-old vs. 3-month-old group (p = 0.006).
Fig. 3
Fig. 3
Effects of a 7-day intracerebroventricular NPY infusion on daily food intake (FI, a and b), nighttime heart rate (HR in beats per minute, BPM, c and d) and nighttime core temperature (Tc, e and f) in different age groups (aged 3, 6, 12, 18 or 24 months) of male Wistar rats. All data in bar plots are expressed as mean ± S.E.M. (n = 6–8/group) and were analyzed by one-way ANOVA with Tukey’s post hoc test. (a) Mean daily FI before (baseline, BL) and during the NPY infusion (from day 1 to day 7). * indicate significant differences between baseline value and NPY-induced raise in 3-, 6-, 12- and 18-month-old age groups (p = 0.006, p = 0.048, p < 0.001, p = 0.029). (b) Rate of increase in mean daily FI induced by NPY infusion expressed in % of their pre-infusion baseline daily FI. * indicates significant differences between the 12 months vs. 3-, 6-, 18- and 24-month-old age groups (p = 0.017, 0.016, 0.005 and p < 0.001, respectively). (c) Mean of nighttime HR (12-h averaging for the active period) before (baseline, BL) and during the NPY infusion (on days 1–3). * indicate significant differences between baseline value and NPY-induced raise in 6-, 12- and 18-month-old age groups (p < 0.001 in all cases). (d) Rate of NPY-induced suppression in mean of nighttime HR compared with their pre-infusion baseline values. (e) Mean of nighttime Tc (12-h averaging for the active period) before (baseline, BL) and during the NPY infusion (on days 2–6). (f) Rate of NPY-induced suppression in mean of nighttime Tc compared with their pre-infusion baseline values. * indicate significant differences between the 3- or 12-month-old vs. 24-month-old groups (p = 0.026, 0.037, respectively).
Fig. 4
Fig. 4
Effects of a 7-day intracerebroventricular NPY infusion on body weight (BW) in different age groups (aged 3, 6, 12, 18 or 24 months) of male Wistar rats. All data in bar plots are expressed as mean ± S.E.M. (n = 6–8/group) and were analyzed by one-way ANOVA with Tukey’s post hoc test. Changes in mean of BW on days 4–6 of the NPY infusion or pyrogen-free saline (PFS) are presented in relation to their baseline BW on day 0. * indicates significant difference between the 12-month-old NPY- vs. PFS-treated group (p < 0.001). Initial BW values in NPY-treated vs. their age-matched PFS-treated controls did not differ.
Fig. 5
Fig. 5
Comparison of Npy mRNA expression and NPY peptide content of the arcuate nucleus (ARC) in 3-, 6-, 12-, 18- and 24-month-old (M) male rats. Representative confocal images show the Npy mRNA expression (red in the left images) by RNAscope in situ hybridization. All data in bar plots are expressed as mean ± S.E.M. (n = 5/group) and were analyzed by one-way ANOVA with Tukey’s post hoc test. Panel (a) illustrates the results of the semiquantitative measurement of Npy mRNA specific signal density (SSD) expressed in arbitrary units (a.u.). * indicates significant difference between the 6-month-old vs. 3-month-old group (p = 0.04). On the right, images show the ARC/NPY SSD in nerve fibers, as visualized by immunofluorescence (white). Panel (b) illustrates the SSD of NPY peptide immunosignal in the course of aging. Blue: 4’,6-diamidino-2-phenylindole (DAPI) nuclear counterstaining. * indicates significant differences between the 12-month-old vs. 6-, 18- or 24-month-old groups (p = 0.028, 0.039 or 0.004, respectively). 3rd: third ventricle. ME: median eminence. Bars: 50 μm.

Similar articles

References

    1. Ding, J. et al. Effects of birth cohort and age on body composition in a sample of community-based elderly. Am. J. Clin. Nutr. 85 (2), 405–410. 10.1093/ajcn/85.2.405 (2007). - PubMed
    1. Kelly, T. L., Wilson, K. E. & Heymsfield, S. B. Dual energy X-Ray absorptiometry body composition reference values from NHANES. PLoS One. 4 (9), e7038. 10.1371/journal.pone.0007038 (2009). - PMC - PubMed
    1. Roubenoff, R., Dallal, G. E. & Wilson, P. W. Predicting body fatness: the body mass index vs estimation by bioelectrical impedance. Am. J. Public. Health. 85 (5), 726–728. 10.2105/ajph.85.5.726 (1995). - PMC - PubMed
    1. Palmer, B. F. & Clegg, D. J. The sexual dimorphism of obesity. Mol. Cell. Endocrinol. 402, 113–119. 10.1016/j.mce.2014.11.029 (2015). - PMC - PubMed
    1. Stenholm, S. et al. Sarcopenic obesity: definition, cause and consequences. Curr. Opin. Clin. Nutr. Metab. Care. 11 (6), 693–700. 10.1097/MCO.0b013e328312c37d (2008). - PMC - PubMed