. 2024 Sep 30;14(1):22619.
doi: 10.1038/s41598-024-73581-8.

A live single-cell reporter system reveals drug-induced plasticity of a cancer stem cell-like population in cholangiocarcinoma

Affiliations

A live single-cell reporter system reveals drug-induced plasticity of a cancer stem cell-like population in cholangiocarcinoma

Krittiyabhorn Kongtanawanich et al. Sci Rep. .

Abstract

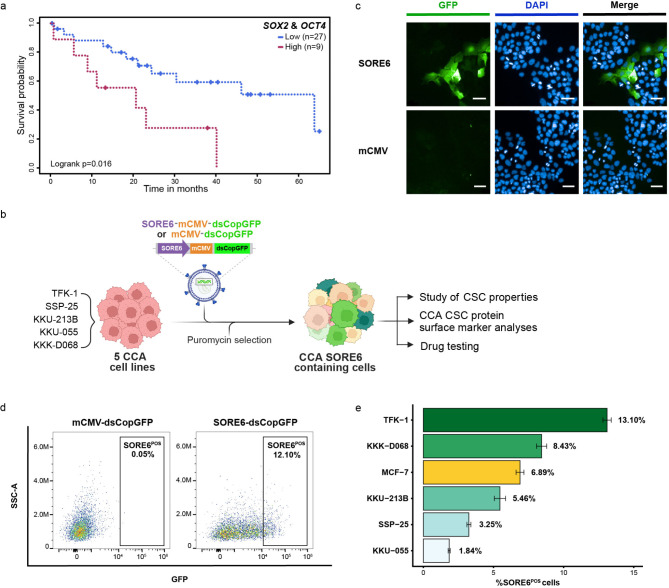
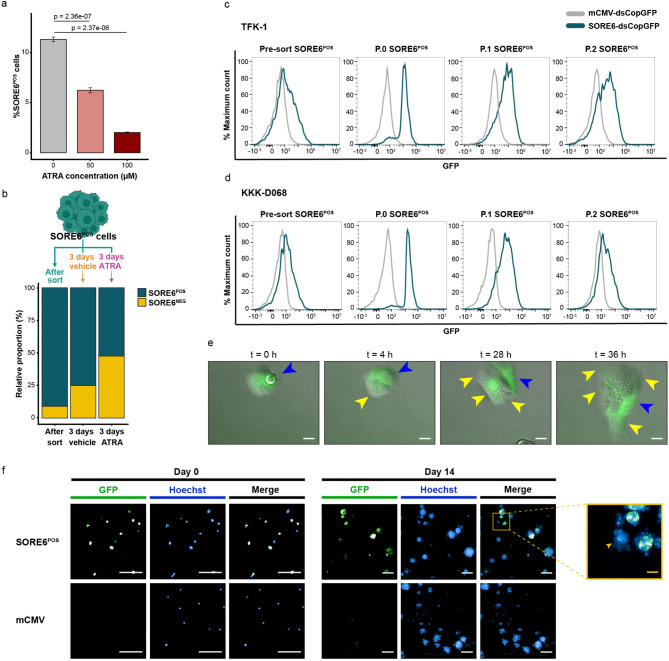
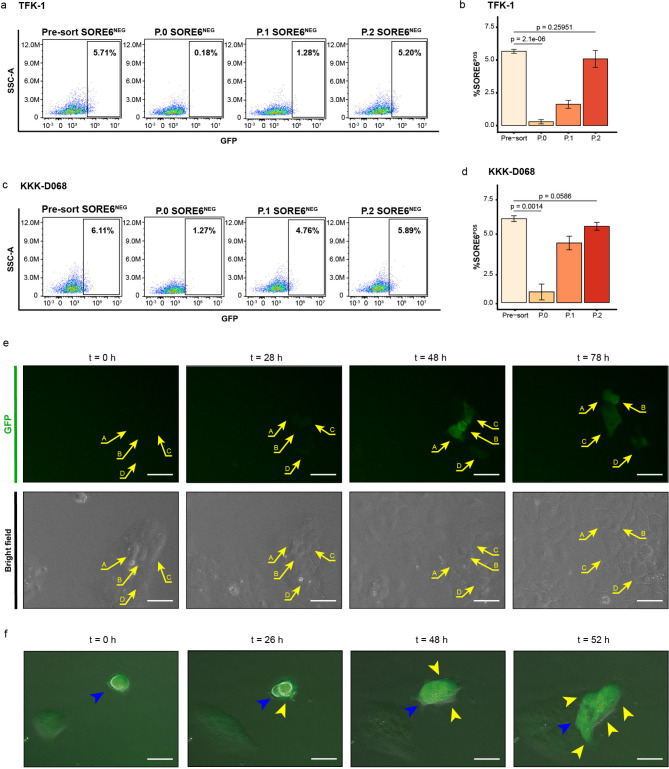
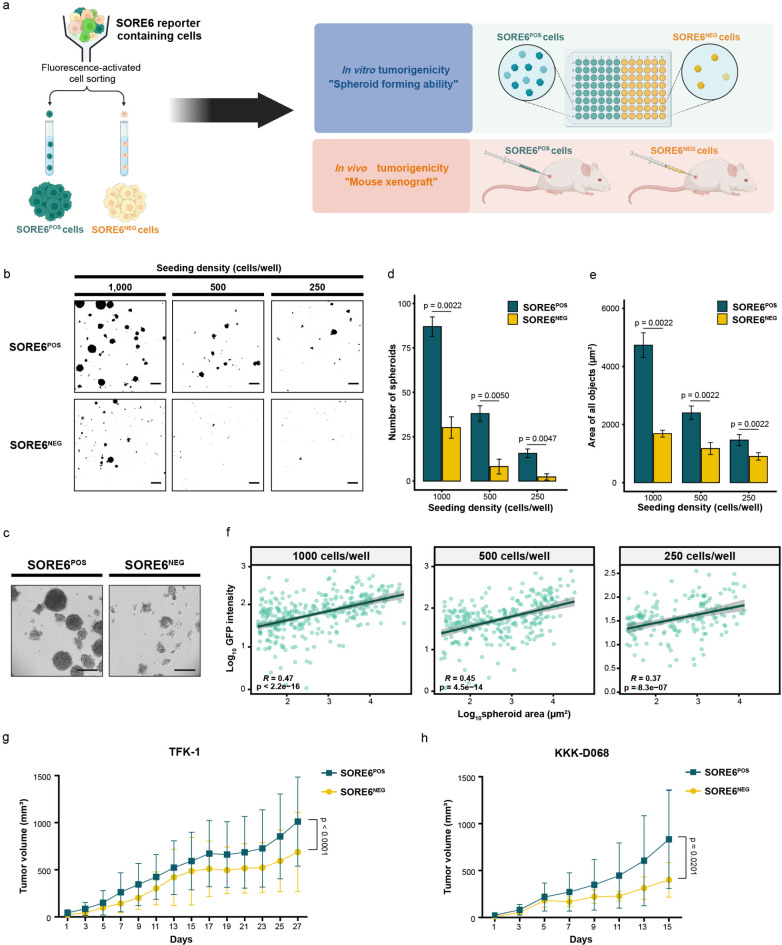
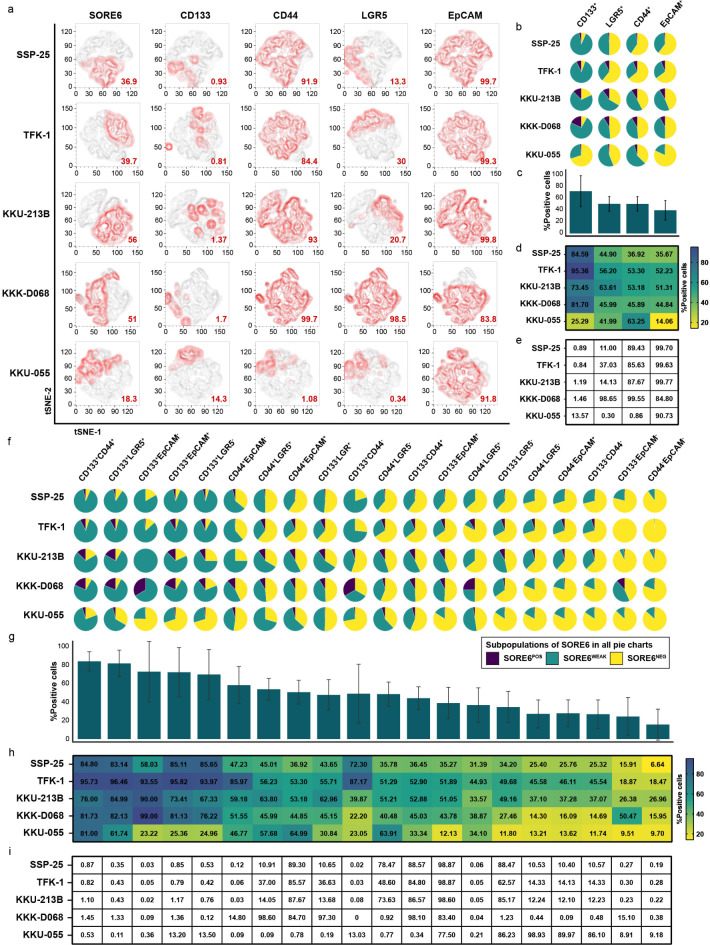
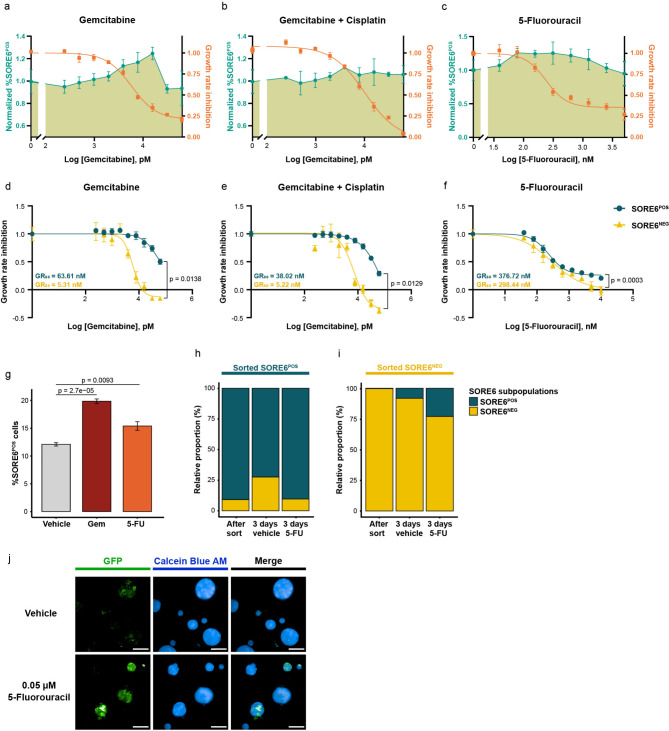
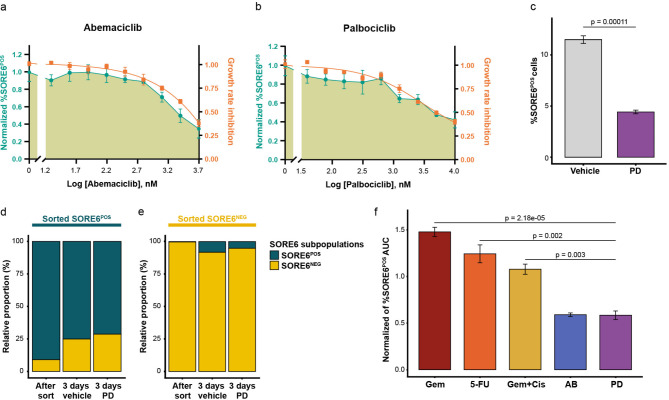
Cancer stem cells (CSC) play an important role in carcinogenesis and are acknowledged to be responsible for chemoresistance in cholangiocarcinoma (CCA). Studying CCA CSC has been challenging, due to lack of consensus CSC markers, and to their plastic nature. Since dual expression of the core pluripotent factors SOX2/OCT4 has been shown to correlate with poor outcome in CCA patients, we selected the SOX2/OCT4 activating short half-life GFP-based live reporter (SORE6-dsCopGFP) to study CSC dynamics at the single-cell level. Transduction of five human CCA cell lines resulted in the expression of 1.8-13.1% GFP-positive (SORE6POS) cells. By live imaging, we found that SORE6POS CCA cells possess self-renewal capacity and that they can be induced to differentiate. Significantly, the SORE6POS cells were highly tumorigenic, both in vitro and in vivo, thus implicating the characteristics of primary CSCs. When we then analyzed for selected CSC-related markers, we found that the majority of both CD133+/CD44+, and CD133+/LGR5+ CCA cells were SORE6POS cells. Exposing transduced cells to standard CCA chemotherapy revealed higher growth rate inhibition at 50% (GR50s) for SORE6POS cells compared to GFP-negative (SORE6NEG) ones indicating that these CSC-like cells were more resistant to the treatment. Moreover, the chemotherapy induced SORE6POS from SORE6NEG cells, while retaining the existing SORE6POS population. Finally, treatment of transduced cells with CDK4/6 inhibitors in vitro for 3 days resulted in a lowered CSC number in the culture. Thus, applying a live reporter system allowed us to elucidate the stem cell diversity and drug-induced plasticity of CCA CSCs. These findings have clear implications for future management of such patients.

Keywords: CDK4/6 inhibitor; Cancer stem cell; Cholangiocarcinoma; Drug resistance; Live reporter.


Conflict of interest statement

The authors declare no competing interests.

Figures

Fig. 1
Fig. 1
SOX2 and OCT4 are relevant drivers for stem cell characteristics in CCA. (a) Kaplan-Meier survival analyses show an overall survival of patients based on combined expression levels (low; blue vs. high; red line) of SOX2 and OCT4 transcripts. (b) Constructions of CCA cell lines containing the GFP-based live reporter (SORE6-dsCopGFP). Created by BioRender.com / Mahidol University. (c) Spatial expressions of GFP in TFK-1 cells containing the SORE6-dsCopGFP (SORE6) under standard culture conditions. TFK-1 cells transduced with mCMV-dsCopGFP (mCMV) reporter were used as controls. Scale bar = 50 μm. The images were taken using a 10x objective lens. (d) Identification of GFP-expressing subpopulation (SORE6POS cells) (right panel) by flow cytometry. The same cell line transduced with mCMV-dsCopGFP (left panel) was used to identify the background. (e) Averaged percentages of the SORE6POS cells in different cell lines were determined by flow cytometry. The data represent mean ± s.d.; n = 3.
Fig. 2
Fig. 2
SOX2/OCT4 activity in SORE6POS cells is transient and is suppressed by ATRA. (a) Suppression of SORE6POS TFK-1 cells following 3-days treatment with ATRA. The data represent mean ± s.d.; n = 3. (b) Percent SORE6POS and SORE6NEG cells of TFK-1 cells after 3-days treatment with 50 µM ATRA or vehicle control (0.5% DMSO) of the FACS sorted SORE6POS cells. A representative of three independent experiments analyzed by flow cytometry is shown. The data represent mean ± s.d.; n = 3. Created by BioRender.com / Mahidol University. (c) Spontaneous differentiation of SORE6POS to SORE6NEG cells. Sorted SORE6POS TFK-1 and (d) KKK-D068 cells were followed over 2 passages. FACS analyses were performed to determine the numbers of SORE6POS cells. P.0, immediately after sorting; P.1, first passage after sorting; P.2, second passage after sorting. (e) Live cell imaging was performed to observe spontaneous differentiation of a SORE6POS TFK-1 cell. Scale bar = 20 μm. Yellow arrowheads indicate daughter cells, and blue arrowheads indicate the mother cell. (f) Emerging of SORE6NEG cells from sorted SORE6POS cells in TFK-1 3D culture after 14 days of culture. White scale bar = 200 μm, yellow scale bar = 50 μm. The images were taken by a 20x air objective lens. ATRA: all-trans retinoic acid.
Fig. 3
Fig. 3
SORE6POS cells emerge from SORE6NEG CCA cells. FACS-sorted SORE6NEG TFK-1 (a,b) and KKK-D068 cells (c,d) were grown as monolayer cultures. Percentages of SORE6POS cell in indicated passages were determined by flow cytometry. The bar graphs represent mean ± s.d.; n = 3 from the independent experiments. P.0, immediately after sorting; P.1, first passage after sorting; P.2, second passage. 2D live cell imaging of TFK-1 cells revealed spontaneous dedifferentiation (e) and self-renewal (f). Scale bar = 50 μm. For (e), A, B, C, and D indicate different cells. For (f), yellow arrowheads indicate daughter cells, and blue arrowheads indicate the mother cell.
Fig. 4
Fig. 4
High tumorigenic potency in SORE6POS cell. (a) Schematic diagram of the in vitro and in vivo tumorigenic assay. Created by BioRender.com / Mahidol University. (b) In vitro tumorigenicity was tested by growing the FACS-sorted SORE6POS or SORE6NEG TFK-1 cells into spheroids. Scale bar = 300 μm. Representative images of the spheroid morphology from initial seeding density 1,000 cells/well shown in (c). Scale bar = 200 μm. Numbers and sizes of the spheroid were quantified by image analysis and shown in the bar graphs (d,e). The data represent mean ± s.d.; n = 6. P-values for in vitro tumorigenicity were analyzed by the Wilcoxon rank sum test. (f) Positive correlations between log10 spheroid area vs. log10 GFP intensity. The regression line (black line) was estimated by linear regression of Pearson correlation with 95% confidence interval (gray band). R = Pearson’s correlation coefficient, p = p-value. The data was acquired from image analysis. (gh) the sorted SORE6POS and SORE6NEG cells were implanted into severe immunocompromised mice. Line graphs indicate growth ± s.d. of the TFK-1 (g) and KKK-D068 (h) tumors. n = 10 for TFK-1 tumors, and n = 8 for KKK-D068. P-values for in vivo data were analyzed by paired t-test.
Fig. 5
Fig. 5
Expression of selected CSC-associated markers on SORE6 cell subsets in five CCA cell lines. (a) t-SNE diagrams of SORE6POS cell immuno-stained for putative surface protein markers as indicated. Red and grey areas represent marker positive or negative, respectively. The red numbers show the percentage of surface marker-positive cells. (b) Pie charts show percentages of SORE6 cell subsets in single surface marker-defined CCA subpopulations, as indicated on the top of the panel. Strong GFP expression (SORE6POS; dark blue), weak GFP expression (SORE6WEAK; green), and no GFP expression (SORE6NEG; yellow). (c) The bar graphs show the percentage of SORE6 cells (strong and weak signals) in single surface marker-defined CCA subpopulations as indicated in (b). (d) Heatmap shows averages of percent SORE6 cells (strong and weak signals) in single surface marker-defined CCA subpopulations as indicated in (b), broken down in detail for each cell line. (e) Percentages of cells in single surface marker-defined subpopulations. (f) Pie charts show percentages of SORE6 cell subsets in double surface marker-defined CCA subpopulations, as indicated at the top of the panel. Strong GFP expression (SORE6POS; dark blue), weak GFP expression (SORE6WEAK; green), and no GFP expression (SORE6NEG; yellow). (g) The bar graphs show the percentage of SORE6 cells (strong and weak signals) in double surface marker-defined CCA subpopulations as indicated in (f). (h) Heatmap shows averages of percent SORE6 cells (strong and weak signals) in double surface marker-defined CCA subpopulations as indicated in (f), broken down in detail for each cell line. (i) Percentages of cells in double surface marker-defined subpopulations. All pie charts were generated from a representative experiment. Each bar in all bar graphs showed average number from 5 CCA cell lines ± s.d. from three biological replicates (n = 15).
Fig. 6
Fig. 6
CSC mediated-drug resistance following chemotherapy. (ac) The normalized percentages of SORE6POS TFK-1 cells treated with increasing doses of drugs (green lines, left y-axis). Dose response of total CCA cell numbers are shown in orange lines (right y-axis). The data represent mean ± s.d.; n = 3. (df) Dose-response curves for sorted SORE6POS and sorted SORE6NEG TFK-1 cells following chemotherapy. GR50s of each line is shown in the graph. The data represent mean ± s.d.; n = 3. The data was acquired from image analysis. (g) Percent SORE6POS cells after 3 days of 0.063 µM gemcitabine or 0.313 µM 5-FU. The data represent mean ± s.d.; n = 3. Percent subpopulations of sorted SORE6POS (h) and SORE6NEG cells (i) treated with 0.313 µM 5-FU for 3 days, then quantified by flow cytometry. The data represent mean ± s.d.; n = 3. (j) TFK-1 multi-spheroids under 0.05 µM 5-FU for 3 days. Scale bar = 100 μm. The data in (af) were acquired from image analysis, while (gi) were from flow cytometry. 5-FU: 5-fluorouracil, Gem: gemcitabine.
Fig. 7
Fig. 7
Effect of CDK4/6 inhibitors on the SORE6POS population. (a,b) The normalized percentages of SORE6POS TFK-1 cells treated with increasing doses of AB and PD (green lines, left y-axis). Total CCA cell numbers (orange graphs, right y-axis). The data represent mean ± s.d.; n = 3. (c) Percent SORE6POS cells following 3 days of 5 µM PD treatment. Data represent mean ± s.d.; n = 3. Percent subpopulations of sorted SORE6POS (d) and SORE6NEG (e) cells treated with 5 µM PD for 3 days, then quantified by flow cytometric analysis. The data represented mean ± s.d.; n = 3. (f) Inductions and suppressions of SORE6POS cells by chemotherapy and CDK4/6 inhibitors. Normalized AUC of percent SORE6POS TFK-1 cells following indicated treatments. The data represent mean ± s.d.; n = 3. The data in (a,b,f) were acquired from image analysis, while (ce) were from flow cytometry. 5-FU: 5-fluorouracil, AB: abemaciclib, Gem: gemcitabine, Gem + Cis: gemcitabine and cisplatin, PD: palbociclib.

Similar articles

References

    1. Brown, Z. J., Ruff, S. M. & Pawlik, T. M. Developments in FGFR and IDH inhibitors for cholangiocarcinoma therapy. Expert Rev. Anticancer Ther.23, 257–264. 10.1080/14737140.2023.2176846 (2023). - PubMed
    1. Zheng, Q., Zhang, B., Li, C. & Zhang, X. Overcome Drug Resistance in Cholangiocarcinoma: New Insight into mechanisms and Refining the preclinical experiment models. Front. Oncol.12, 850732. 10.3389/fonc.2022.850732 (2022). - PMC - PubMed
    1. Batlle, E. & Clevers, H. Cancer stem cells revisited. Nat. Med.23, 1124–1134. 10.1038/nm.4409 (2017). - PubMed
    1. Phan, T. G. & Croucher, P. I. The dormant cancer cell life cycle. Nat. Rev. Cancer. 20, 398–411. 10.1038/s41568-020-0263-0 (2020). - PubMed
    1. Phi, L. T. H. et al. Cancer Stem Cells (CSCs) in Drug Resistance and their Therapeutic Implications in Cancer Treatment. Stem Cells Int. 5416923. (2018). 10.1155/2018/5416923 (2018). - PMC - PubMed

MeSH terms