. 2024 Nov;25(11):4846-4875.
doi: 10.1038/s44319-024-00270-y. Epub 2024 Sep 30.

Aspartyl proteases target host actin nucleator complex protein to limit epithelial innate immunity

Affiliations

Aspartyl proteases target host actin nucleator complex protein to limit epithelial innate immunity

Sandip Patra et al. EMBO Rep. 2024 Nov.

Abstract

Epithelial-immune cell communication is pivotal to control microbial infections. We show that glycosylphosphatidylinositol-linked aspartyl proteases (Yapsins) of the human opportunistic pathogenic yeast Candida glabrata (Cg) thwart epithelial cell (EC)-neutrophil signalling by targeting the EC protein, Arpc1B (actin nucleator Arp2/3 complex subunit), which leads to actin disassembly and impeded IL-8 secretion by ECs. Further, the diminished IL-8 secretion inhibits neutrophil migration, and protects Cg from the neutrophil-mediated killing. CgYapsin-dependent Arpc1B degradation requires Arginine-142 in Arpc1B, and leads to reduced Arpc1B-p38 MAPK interaction and downregulated p38 signalling. Consistently, Arpc1B or p38 deletion promotes survival of the Cg aspartyl protease-deficient mutant in ECs. Importantly, kidneys of the protease-deficient mutant-infected mice display elevated immune cell infiltration and cytokine secretion, implicating CgYapsins in immune response suppression in vivo. Besides delineating Cg-EC interplay, our results uncover a novel target, Arpc1B, that pathogens attack to constrain the host signalling networks, and link Arpc1B mechanistically with p38 activation.

Keywords: Candida glabrata; Arp2/3 Complex; Epa1 Adhesin; Epithelial Cells; p38 MAPK.


Conflict of interest statement

The authors declare no competing interests.

Figures
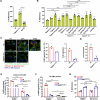
Figure 1
Figure 1. CgYapsins govern Cg-epithelial cell interaction.
(A) Adherence of indicated, S35-labelled Cg strains to live A-498 (human kidney epithelial) cells after 2 h co-incubation, as determined by CFU (colony-forming unit)-based assay. Black asterisks denote adherence differences, as compared to wt-infected A-498 cells. n = 4 biological replicates. (B) Adherence of indicated, S35-labelled Cg strains to fixed A-498 (cells after 2 h co-incubation. Black, green, purple and blue asterisks indicate A-498 adherence differences in indicated strains, as compared to wt, Cgyps1∆, Cgyps7∆ and Cgyps1-11∆ strains, respectively. n = 3 biological replicates. (C) Representative confocal micrographs showing association/internalization of mCherry-expressing wt and Cgyps1-11∆ by A-498 at 4 and 24 h post-infection (hpi). Infected A-498 cells were stained with concanavalin A (ConA)-FITC to distinguish intracellular and extracellular Cg. Representative z-stack images with a step size of 1 µm per slice were captured using Leica SP8 with 63X/1.44 NA objective lens. Yellow and white arrows mark A-498-associated (ConA-FITC-stained) and A-498-internalized (ConA-FITC-unstained) Cg, respectively. A minimum of 200 Cg cells were counted for each strain at 4 and 24 hpi. Data (mean; n = 2 biological replicates) represent the number of A-498-ingested (ConA-FITC-unstained) Cg cells. Fold-replication for each strain was determined by dividing the number of intracellular Cg at 24 h by that at 4 h. DAPI stains the cell nuclei. (D) CFU-based intracellular survival analysis. At 4 and 24 hpi, wt- and Cgyps1-11∆-infected A-498 cells were lysed in water, followed by lysate plating on YPD medium. Fold-replication was determined by dividing Cg CFUs at 24 h by that at 4 h. n = 3 biological replicates. (E, F) Cg adherence and internalization analysis. A-498 cells, pre-treated with DMSO (solvent control) or dynasore (50 µM) were infected with Cg that were either left untreated (E) or blocked with 10 mM lactose (F), prior to A-498 infection. At 4 hpi, A-498 cells were washed, and A-498-associated/ingested Cg cell numbers were determined by plating A-498 lysates on YPD medium. % association and/or ingestion was calculated by dividing 4 h CFUs by 0 h CFUs (Number of Cg cells infected to A-498), and multiplying the number by 100. n = 3 biological replicates in (E, F). (G) Adherence of wt and Cgyps1-11∆ to DMSO or dynasore (50 µM)-pre-treated, fixed A-498 cells, after 2 h co-incubation, as determined by CFU-based assay. n = 4 biological replicates. Data information: In (A, B, D, E, F, G), data are presented as mean ± SEM. *P  <  0.05; **P  <  0.01; ***P  <  0.001; ****P  <  0.0001; n.s. not significant. Unpaired two-tailed Student’s t test in (A, B, D, E, F, G). P  =  0.00009466 (Cgyps1-11Δ vs. wt), P  =  0.00003650 (epa1Δ vs. wt), P  = 0.0000113 (Cgyps1-11Δ vs. epa1Δ) in (A). P  = 0.0089 (Cgyps2ΔCΔ vs. wt), P  = 0.0077 (Cgyps7Δ vs. wt), P  =  0.0005 (Cgyps1Δ vs. wt), P  = 0.0016 (Cgyps1-11Δ vs. wt), P  = 0.0133 (Cgyps1∆/CgYPS1D91A vs. wt), P  = 0.0004 (Cgyps1∆/CgYPS1D378A vs. wt), P  = 0.0047 (Cgyps1-11∆/CgYPS1D91A vs. wt), P  = 0.0089 (Cgyps1-11∆/CgYPS1D378A vs. wt), P  = 0.0014 (Cgyps1Δ/CgYPS1 vs. Cgyps1∆), P  = 0.0197 (Cgyps7Δ/CgYPS7 vs. Cgyps7∆), P  = 0.0008 (Cgyps1-11Δ/CgYPS1 vs. Cgyps1-11∆), P  = 0.0006 (Cgyps1-11Δ/CgYPS7 vs. Cgyps1-11∆) in (B). P  = 0.0025 (Cgyps1-11Δ vs. wt) in (D). P  = 0.0001 (Cgyps1-11Δ-DMSO vs. wt-DMSO), P  = 0.0357 (Cgyps1-11Δ-Dynasore vs. wt-Dynasore), P  = 0.000074 (wt-Dynasore vs. wt-DMSO), P  = 0.0002 (Cgyps1-11Δ- Dynasore vs. Cgyps1-11Δ- DMSO) in (E). P  = 0.0027 (Cgyps1-11Δ-DMSO vs. wt-DMSO), P  = 0.0000760 (Cgyps1-11Δ-Dynasore vs. wt-Dynasore), P  = 0.0026 (wt-Dynasore vs. wt-DMSO), P  = 0.0243 (Cgyps1-11Δ-Dynasore vs. Cgyps1-11Δ- DMSO) in (F). P  = 0.00004431 (Cgyps1-11Δ-DMSO vs. wt-DMSO), P  = 0.0076 (Cgyps1-11Δ-Dynasore vs. wt-Dynasore) in (G). Scale bar = 10 μm in (C). Source data are available online for this figure.
Figure 2
Figure 2. CgYapsin loss leads to increased IL-6 and IL-8 secretion in A-498 cells.
(AD) Secreted IL-6 (A, C) and IL-8 (B, D) cytokine levels in uninfected, wt- and Cgyps1-11∆-infected A-498 cells after 24 h incubation. Infection was carried out at 1:1 MoI (multiplicity of infection). Cg was killed either by heating (10 min incubation at 95 °C) or UV irradiation (four repeated exposures to 100 kJ/m2 UV radiation). Purple, green and black asterisks indicate statistically-significant differences in cytokine secretion, as compared to Cgyps1-11∆-infected, wt-infected and uninfected A-498 cells, respectively. V, empty vector. Strains carrying empty vector were used as control strains under indicated conditions. n = 4 biological replicates in (A, B, D), and n = 3 biological replicates in (C). Data information: In (AD), data are presented as mean ± SEM. *P  <  0.05; **P  <  0.01; ***P  <  0.001; ****P  <  0.0001; n.s. not significant. Unpaired two-tailed Student’s t test in (AD). P  = 0.0000001 (Cgyps1-11Δ vs. wt), P  = 0.00004554 (wt vs. uninfected), P  =  0.00000267 (Cgyps1-11Δ vs. uninfected), P  = 0.0027 (wt-Heat-killed vs. wt-live), P  =  0.0004 (wt-UV-killed vs. wt-live), P  = 0.00000216 (Cgyps1-11Δ-Heat-killed vs. Cgyps1-11Δ -live), P  = 0.00000169 (Cgyps1-11Δ-UV-killed vs. Cgyps1-11Δ-live) in (A). P  = 0.000000013 (Cgyps1-11Δ vs. wt), P  = 0.0002 (wt vs. uninfected), P  =  0.0002 (Cgyps1-11Δ vs. uninfected), P  = 0.0000336 (wt-Heat-killed vs. wt-live), P  =  0.0009 (wt-UV-killed vs. wt-live), P  = 0.0000041 (Cgyps1-11Δ-Heat-killed vs. Cgyps1-11Δ-live), P  = 0.0000083 (Cgyps1-11Δ UV-killed vs. Cgyps1-11Δ live) in (B). P  = 0.00005725 (Cgyps1-11Δ/V vs. wt/V), P  = 0.0011 (wt/V vs. uninfected), P  =  0.002 (Cgyps1-11Δ/V vs. uninfected), P  = 0.0005 (Cgyps1-11Δ/CgYPS1 vs. uninfected), P  =  0.0014 (Cgyps1-11Δ/CgYPS7 vs. uninfected), P  = 0.00003838 (Cgyps1-11Δ/CgYPS1 vs. Cgyps1-11Δ/V), P  = 0.0002 (Cgyps1-11Δ/CgYPS7 vs. Cgyps1-11Δ/V), P  = 0.00009518 (Cgyps1-11Δ/CgYPS1D91A vs. wt/V), P  = 0.0285 (Cgyps1-11Δ/CgYPS1D378A vs. wt/V) in (C). P  = 0.000013 (Cgyps1-11Δ/V vs. wt/V), P  = 0.0005 (wt/V vs. uninfected), P  =  0.0002 (Cgyps1-11Δ/V vs. uninfected), P  = 0.00000028 (Cgyps1-11Δ/CgYPS1 vs. uninfected), P  =  0.00000469 (Cgyps1-11Δ/CgYPS7 vs. uninfected), P = 0.0056 (Cgyps1-11Δ/CgYPS1D91A vs. uninfected) P  = 0.0096 (Cgyps1-11Δ/CgYPS1D378A vs. uninfected), P  = 0.0000003 (Cgyps1-11Δ/CgYPS1 vs. Cgyps1-11Δ/V), P  = 0.0000047 (Cgyps1-11Δ/CgYPS7 vs. Cgyps1-11Δ/V), P  = 0.0001 (Cgyps1-11Δ/CgYPS1D91A vs. wt/V), P  = 0.0002 (Cgyps1-11Δ/CgYPS1D378A vs. wt/V) in (D). Source data are available online for this figure.
Figure 3
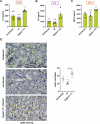
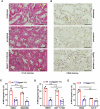
Figure 3. CgYapsin loss results in increased infiltration of neutrophils.
(AC) IL-6 (A), KC (B) and MIP-2 (C) levels in kidney homogenates of Cg-infected BALB/c mice after 4 days of infection. n = 6 mice/group in (A) and n = 4 mice/group in (B, C). Green and black asterisks denote cytokine differences, as compared to wt-infected and uninfected mice, respectively. (D) Representative images of Ly6G-stained kidney sections of uninfected, wt-infected, and Cgyps1-11Δ–infected female BALB/c mice at day 1 post-infection. n = 5 mice for uninfected group, and n = 6 mice for wt- and Cgyps1-11Δ–infected groups. For quantification, a minimum of 100 Ly6G-positive (Ly6G + ) cells, in 6–8 different fields of each mouse kidney section, were counted for each group. The yellow arrowheads mark representative Ly6G+ polymorphonuclear neutrophils. Data represent the average number of Ly6G positive cells per field for each group. Black asterisks denote Ly6G+ cell number differences, compared to uninfected mouse kidney sections. Images were taken at ×40 magnification. Data information: In (AD), data are presented as mean ± SEM. *P < 0.05; **P <0.01; ****P < 0.0001; n.s. not significant. Unpaired two-tailed Student’s t test in (AD). P = 0.00000007 (Cgyps1-11Δ vs. wt), P = 0.0104 (Cgyps1-11Δ vs. uninfected) in (A). P = 0.0199 (Cgyps1-11Δ vs. wt), P = 0.044 (Cgyps1-11Δ vs. uninfected) in (B). P = 0.0074 (Cgyps1-11Δ vs. wt), P = 0.0076 (Cgyps1-11Δ vs. uninfected) in (C). P = 0.0083 (wt vs. uninfected), P = 0.0084 (Cgyps1-11Δ vs. uninfected), P = 0.0000077 (Cgyps1-11Δ vs. wt) in (D). Scale bar = 20 μm in (D). Source data are available online for this figure.
Figure 4
Figure 4. CgYapsin loss activates A-498 cells.
(A, B) Representative immunoblots illustrating elevated phospho-p38 (A) and phospho-p65 (B) levels in Cgyps1-11∆-infected A-498 cells. At 6 hpi, indicated epithelial cell lysates (120 μg) were resolved on 12% SDS-PAGE gel. The p38 and p65 protein bands correspond to 38 and 65 kDa, respectively. For quantification, the signal intensity in each lane was measured using the ImageJ software, and p38 (A) and p65 (B) intensity values were normalized against the corresponding GAPDH signal values. Fold-change in phosphorylated-p38 and phosphorylated-p65 levels was determined by normalizing against the GAPDH-normalized p38 (A) and p65 (B) signals, respectively. n = 3 biological replicates. Data represent fold-change in phosphorylated-p38 protein and phosphorylated-p65 protein levels in Cg-infected A-498, compared to uninfected A-498 cells (considered as 1.0), and are plotted on the right side of the blots. Purple, green and black asterisks mark statistically-significant differences, as compared to Cgyps1-11∆-infected, wt-infected and uninfected A-498 cells, respectively. V, empty vector. (C, D) Secreted IL-6 (C) and IL-8 (D) levels in SB203580 (10 µM)-treated, indicated A-498 cells. Infection was carried out at 1:1 MoI. n = 3 biological replicates. (E). Intracellular Cg survival analysis in SB203580 (10 µM)-treated, indicated A-498 cells. Fold replication represents the ratio of 24 h CFUs to 4 h CFUs. n = 4 biological replicates. (F) Intracellular Cg survival analysis in BAY11-7082 (10 µM)-treated, indicated A-498 cells. Fold replication represents the ratio of 24 h CFUs to 4 h CFUs. n = 4 biological replicates. (G, H) Secreted IL-6 (G) and IL-8 (H) levels in BAY11-7082 (10 µM)-treated, indicated A-498 cells. Infection was carried out at 1:1 MoI. n = 4 biological replicates in (G), and n = 3 biological replicates in (H). Data information: In (AH), data are presented as mean ± SEM. *P  <  0.05; **P  <  0.01; ***P  <  0.001; ****P  <  0.0001; n.s. not significant. Unpaired or paired two-tailed Student’s t test in (AH). P  =  0.001 (wt/V vs. uninfected), P  =  0.0224 (Cgyps1-11Δ/V vs. uninfected), P  =  0.001 (Cgyps1-11Δ/V vs. wt/V), P  = 0.0086 (Cgyps1-11Δ/CgYPS1 vs. Cgyps1-11Δ/V), P  = 0.0027 (Cgyps1-11Δ/CgYPS7 vs. Cgyps1-11Δ/V) in (A). P  =  0.0415 (wt/V vs. uninfected), P  =  0.0163 (Cgyps1-11Δ/V vs. uninfected), P  =  0.0086 (Cgyps1-11Δ/V vs. wt/V), P  = 0.0233 (Cgyps1-11Δ/CgYPS1 vs. Cgyps1-11Δ/V), P  = 0.0124 (Cgyps1-11Δ/CgYPS7 vs. Cgyps1-11Δ/V) in (B). P  =  0.0169 (wt vs. uninfected), P  =  0.0024 (Cgyps1-11Δ vs. uninfected), P  =  0.0005 (Cgyps1-11Δ vs. wt), P  =  0.0003 (Cgyps1-11Δ-SB203580 vs. Cgyps1-11Δ-DMSO) in (C). P  =  0.00004918 (wt vs. uninfected), P  =  0.0001 (Cgyps1-11Δ vs. uninfected), P  =  0.00002468 (Cgyps1-11Δ vs. wt), P  =  0.00005211 (Cgyps1-11Δ-SB203580 vs. Cgyps1-11Δ-DMSO) in (D). P  = 0.00002787 (Cgyps1-11Δ-DMSO vs. wt-DMSO), P  = 0.0225 (Cgyps1-11Δ-SB203580 vs. wt-SB203580), P  = 0.0034 (Cgyps1-11Δ-SB203580 vs. Cgyps1-11Δ-DMSO) in (E). P  =  0.00001648 (Cgyps1-11Δ-DMSO vs. wt-DMSO), P  = 0.0006 (Cgyps1-11Δ-BAY 11-7082 vs. wt-BAY 11-7082), P  = 0.0096 (Cgyps1-11Δ-BAY 11-7082 vs. Cgyps1-11Δ-DMSO) in (F). P  =  0.0006 (wt vs. uninfected), P  =  0.0038 (Cgyps1-11Δ vs. uninfected), P  =  0.00008 (Cgyps1-11Δ vs. wt), P  =  0.0044 (uninfected, BAY11-7082-treated vs. uninfected, DMSO-treated), P  =  0.0002 (Cgyps1-11Δ-BAY11-7082 vs. Cgyps1-11Δ-DMSO) in (G). P  =  0.0029 (wt vs. uninfected), P  =  0.0022 (Cgyps1-11Δ vs. uninfected), P  =  0.0000200 (Cgyps1-11Δ vs. wt), P  =  0.0055 (uninfected, BAY11-7082-treated vs. uninfected, DMSO-treated), P  =  0.00002712 (Cgyps1-11Δ-BAY11-7082 vs. Cgyps1-11Δ-DMSO) in (H). Source data are available online for this figure.
Figure 5
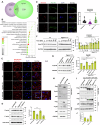
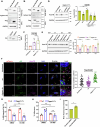
Figure 5. Cg infection reduces Arpc1B levels in A-498 cells.
(A) Venn diagram illustrating overlap between A-498 protein interactors of CgYps1 and CgYps7. (B) Bubble plot showing enriched gene ontology (GO) terms for Biological Processes in the common host epithelial A-498 cell interactome of CgYps1 and CgYps7, as determined using the DAVID tool. (C) Representative confocal micrographs illustrating rhodamine-phalloidin-stained actin structures in indicated A-498 cells, at 6 hpi with FITC-labelled Cg or C. albicans. Representative z-stack images were obtained using the confocal microscope (Leica SP8) with 63X/1.44 NA objective lens. Yellow and white arrows mark actin fibres and aggregates, respectively. DAPI stains A-498 nuclei. Since FITC signal was poor in the hyphal form of C. albicans, the GFP signal intensity in images was increased to detect the hyphal form, and C. albicans hyphae are shown in the inset. n = 2 biological replicates. (D) Representative immunoblots illustrating total actin-normalized globular (G)-actin and filamentous (F)-actin levels in indicated A-498 cells at 6 hpi. Green and black asterisks mark F/G actin ratio differences, as compared to Cg wt-infected and uninfected (taken as 1.0) A-498 cells, respectively. n = 3 biological replicates. (E) Representative confocal micrographs depicting immunofluorescence analysis of Arpc1B cellular localization. A-498 cells were transfected with Arpc1B-SFB-expressing plasmid and infected with mCherry-expressing Cg strains for 6 h, followed by staining with anti-FLAG antibody, and imaging using the confocal microscope (Leica SP8) with 63X/1.44 NA objective lens in the z-stack mode. The fluorescent Arpc1B-SFB signal was quantified, using the ImageJ software, in a minimum of 44 cells, and shown as a scatter plot on the right side of the micrographs. Green and black asterisks indicate statistically significant differences, as compared to wt-infected and uninfected A-498 cells, respectively. n = 3 biological replicates. (F) Representative immunoblots illustrating Arpc1B levels in wt- and Cgyps1-11∆-infected A-498 cells at indicated time points post-infection. Data represent fold-change in Arpc1B levels, as compared to 0 h time point (taken as 1.0). n = 3 biological replicates. (G) Representative immunoblots illustrating Arpc1B protein levels in A-498 cells that were left uninfected or infected for 6 h with indicated Cg strains expressing either active CgYps1 or catalytically-dead CgYps1 enzymes, CgYps1D91A and CgYps1D378A. Data are plotted on the right side of the blots. Purple, green and black asterisks indicate Arpc1B level differences, as compared to Cgyps1-11Δ/V-infected, wt/V-infected and uninfected A-498 cells, respectively. V denotes empty plasmid. n = 3 biological replicates. (H) Representative immunoblots (n = 2 biological replicates) validating Arpc1B-SFB and p38 MAPK interaction. Lysates (1.5 mg) of Arpc1B-SFB or GFP-SFB-expressing A-498 cells were incubated with streptavidin beads for 2 h at 4 °C, and resolved on 12% SDS-PAGE. (I, J) Representative immunoblots (n = 4 biological replicates) illustrating reduced Arpc1B-p38 interaction in wt-infected A-498 at 6 hpi (I). Lysates of Cg-infected, Arpc1B-SFB or GFP-SFB-expressing A-498 cells were incubated with streptavidin beads, followed by sample resolution on 12% SDS-PAGE. Red asterisk denotes non-specific bands. Arpc1B-p38 interaction was determined by normalizing against the GAPDH (loading control)-normalized p38 signal, and quantified using the ImageJ software. Data represent fold-change in Arpc1B-p38 (J; n = 4 biological replicates) interaction, as compared to uninfected A-498 cells (taken as 1.0). Green and black asterisks indicate statistically significant differences, as compared to wt-infected and uninfected A-498 cells, respectively. Data information: In (DG, J), data are presented as mean ± SEM. *P  <  0.05; **P  <  0.01; ****P  <  0.0001; n.s., not significant. Benjamini test in (B). Unpaired or paired two-tailed Student’s t test in (DG, J). P  =  0.0045 (wt vs. uninfected), P  =  0.0171 (C. albicans vs. uninfected), P  =  0.014 (Cgyps1-11Δ vs. wt) in (D). P  =  0.00000002 (wt vs. uninfected), P  =  0.00000000002 (Cgyps1-11Δ vs. wt) in (E). P  =  0.0051 (wt-30 min vs. wt-0 min), P  =  0.003 (wt-60-min vs. wt-0 min), P  =  0.0408 (Cgyps1-11Δ-60 min vs. wt-60 min), P  =  0.0352 (Cgyps1-11Δ-240 min vs. wt-240 min) in (F). P  =  0.0143 (wt/V vs. uninfected), P  =  0.0123 (Cgyps1-11Δ/CgYPS1 vs. uninfected), P  =  0.0014 (Cgyps1-11Δ/V vs. wt/V), P  = 0.0017 (Cgyps1-11Δ/CgYPS1 vs. Cgyps1-11Δ/V), P  = 0.0053 (Cgyps1-11Δ/CgYPS1D91A vs. wt/V), P = 0.0279 (Cgyps1-11Δ/CgYPS1D378A vs. wt/V) in (G). P = 0.0279 (wt vs. uninfected), P = 0.04 (Cgyps1-11Δ vs. uninfected) P = 0.0024 (Cgyps1-11Δ vs. wt) in (J). Scale bar = 20 μm in (C). Scale bar = 10 μm in (E). Source data are available online for this figure.
Figure 6
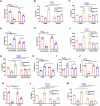
Figure 6. Arpc1B or p38 loss reverses elevated cytokine secretion in Cgyps1-11∆-infected A-498 cells.
(A) Intracellular Cg survival analysis in CK-666 (1 µM)-treated, indicated A-498 cells. n = 4 biological replicates. (B, C) Secreted IL-6 (B) and IL-8 (C) levels in CK-666 (1 µM)-treated, indicated A-498 cells. Infection was carried out at 1:1 MoI. n = 3 biological replicates. (D) Adherence of indicated, S35-labelled Cg strains to control-siRNA- or Arpc1B-siRNA-transfected, fixed A-498 cells after 2 h co-incubation. n = 3 biological replicates. (E) Intracellular Cg survival analysis in control-siRNA or Arpc1B-siRNA-transfected A-498 cells. n = 4 biological replicates. (F, G) Secreted IL-6 (F) and IL-8 (G) levels in control-siRNA or Arpc1B-siRNA-transfected, Cg-infected A-498 cells. Infection was carried out at 1:1 MoI. n = 3 biological replicates in (F), and n = 4 biological replicates in (G). (H) Adherence of indicated, S35-labelled Cg strains to fixed, p38/− and NTC (non-targeting control; cells transfected with the non-targeting control guide RNA)-HEK293T cells after 2 h co-incubation. Black asterisks mark adherence differences, as compared to wt-infected, NTC-HEK293T cells. n = 3 biological replicates. (I) Adherence of indicated Cg strains to fixed Arpc1B/− and NTC-HEK293T cells, after 2 h co-incubation, as determined by CFU-based assay. Black asterisks mark adherence differences, as compared to wt-infected, NTC-HEK293T cells. n = 4 biological replicates. (J, K) Intracellular Cg survival analysis in p38/ (J) and Arpc1B−/− (K) HEK293T epithelial cells. n = 4 biological replicates. (L, M) Secreted IL-8 levels in Cg-infected, p38/− (L) or Arpc1B−/− (M) HEK293T cells. Infection was carried out at 1:1 MoI. Green and black asterisks indicate differences, as compared to wt-infected and uninfected, NTC-HEK293T cells, respectively. n = 3 biological replicates in (L), and n = 4 biological replicates (M). Data information: In (AM), data are presented as mean ± SEM. *P  <  0.05; **P  <  0.01; ***P  <  0.001; ****P  <  0.0001; n.s. not significant. Unpaired two-tailed Student’s t test in (AM). P  =  0.00000956 (Cgyps1-11Δ-DMSO vs. wt-DMSO), P  = 0.0009 (Cgyps1-11Δ-CK-666 vs. wt-CK-666), P  = 0.00002031 (Cgyps1-11Δ-CK-666 vs. Cgyps1-11Δ-DMSO) in (A). P  =  0.045 (wt vs. uninfected), P  =  0.0012 (Cgyps1-11Δ vs. uninfected), P  =  0.00009810 (Cgyps1-11Δ vs. wt), P  =  0.0071 (wt-CK-666-treated vs. uninfected, CK-666-treated), P  =  0.01 (Cgyps1-11Δ-CK-666-treated vs. uninfected, CK-666-treated), P  =  0.0075 (wt-CK-666 vs. wt-DMSO), P  =  0.0026 (Cgyps1-11Δ-CK-666 vs. Cgyps1-11Δ-DMSO) in (B). P  =  0.0006 (wt vs. uninfected), P  =  0.00005649 (Cgyps1-11Δ vs. uninfected), P  =  0.00001361 (Cgyps1-11Δ vs. wt), P  =  0.0029 (wt-CK-666 vs. wt-DMSO), P  =  0.0002 (Cgyps1-11Δ-CK-666 vs. Cgyps1-11Δ-DMSO) in (C). P  =  0.003 (Cgyps1-11Δ-Control siRNA vs. wt-Control siRNA), P  =  0.0137 (Cgyps1-11Δ-Arpc1B siRNA vs. Cgyps1-11Δ-Control siRNA) in (D). P  =  0.00000296 (Cgyps1-11Δ-Control siRNA vs. wt-Control siRNA), P  =  0.0003 (Cgyps1-11Δ-Arpc1B siRNA vs. Cgyps1-11Δ-Control siRNA), P  =  0.00006937 (Cgyps1-11Δ-Arpc1B siRNA vs. wt-Arpc1B siRNA) in (E). P  =  0.0338 (wt-Control siRNA vs. uninfected-Control siRNA), P  =  0.0348 (Cgyps1-11Δ-Control siRNA vs. uninfected-Control siRNA), P  =  0.0012 (Cgyps1-11Δ-Control siRNA vs. wt-Control siRNA), P  =  0.001 (Cgyps1-11Δ-Arpc1B siRNA vs. Cgyps1-11Δ-Control siRNA) in (F). P  =  0.00004706 (wt-Control siRNA vs. uninfected-Control siRNA), P  =  0.0036 (Cgyps1-11Δ-Control siRNA vs. uninfected-Control siRNA), P  =  0.00001276 (Cgyps1-11Δ-Control siRNA vs. wt-Control siRNA), P  =  0.0013 (uninfected-Arpc1B siRNA vs. uninfected-Control siRNA), P  =  0.0004 (wt-Arpc1B siRNA vs. wt-Control siRNA), P  =  0.0018 (Cgyps1-11Δ-Arpc1B siRNA vs. Cgyps1-11Δ-Control siRNA) in (G). P  =  0.0008 (Cgyps1-11Δ-NTC vs. wt-NTC), P  =  0.0007 (wt-p38−/ vs. wt-NTC), P  =  0.014 (Cgyps1-11Δ-p38/− vs. Cgyps1-11Δ-NTC) in (H). P  =  0.0017 (Cgyps1-11Δ-NTC vs. wt-NTC), P  =  0.0063 (Cgyps1-11Δ-Arpc1B/− vs. Cgyps1-11Δ-NTC) in (I). P  =  0.00000702 (Cgyps1-11Δ-NTC vs. wt-NTC), P  =  0.0105 (Cgyps1-11Δ-p38/− vs. wt-p38−/−), P  =  0.00000981 (Cgyps1-11Δ-p38−/− vs. Cgyps1-11Δ-NTC) in (J). P  =  0.00000009 (Cgyps1-11Δ-NTC vs. wt-NTC), P  =  0.0009 (Cgyps1-11Δ-Arpc1B/ vs. wt-Arpc1B/−), P  =  0.0003 (Cgyps1-11Δ-Arpc1B−/− vs. Cgyps1-11Δ-NTC) in (K). P  =  0.000005318 (wt-NTC vs. uninfected-NTC), P  =  0.022 (Cgyps1-11Δ-NTC vs. uninfected-NTC), P  =  0.0003 (Cgyps1-11Δ-NTC vs. wt-NTC), P  =  0.001 (uninfected-p38−/ vs. uninfected-NTC), P  =  0.0056 (Cgyps1-11Δ-p38/− vs. Cgyps1-11Δ-NTC), P  =  0.0035 (wt-p38−/− vs. uninfected-p38−/), P  =  0.0298 (Cgyps1-11Δ-p38/− vs. wt-p38/−) in (L). P  =  0.0000055 (wt-NTC vs. uninfected-NTC), P  =  0.0005 (Cgyps1-11Δ-NTC vs. uninfected-NTC), P  =  0.00000241 (Cgyps1-11Δ-NTC vs. wt-NTC), P  =  0.0011 (uninfected-Arpc1B/− vs. uninfected-NTC), P  =  0.00000292 (Cgyps1-11Δ-Arpc1B/ vs. Cgyps1-11Δ-NTC), P  =  0.004 (wt-Arpc1B−/− vs. uninfected-Arpc1B−/−), P  =  0.0095 (Cgyps1-11Δ-Arpc1B/− vs. uninfected-Arpc1B/−) in (M). Source data are available online for this figure.
Figure 7
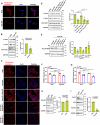
Figure 7. Arpc1B loss inhibits F-actin assembly and p38 activation.
(A) Representative confocal micrographs illustrating rhodamine-phalloidin-stained actin structures in Arpc1B/ and NTC (Arpc1B+/+)-HEK293T cells. Representative z-stack images were obtained using the confocal microscope (Leica SP8) with 63X/1.44 NA objective lens. (B) Representative immunoblots illustrating GAPDH-normalized globular (G)-actin and filamentous (F)-actin levels in Arpc1B/− and NTC-HEK293T cells. The asterisks mark F/G actin ratio differences, as compared to NTC-HEK293T cells (taken as 1.0). n = 3 biological replicates. (C) Representative confocal micrographs illustrating rhodamine-phalloidin-stained actin structures in HEK293T-NTC (Arpc1B+/+) and Arpc1B−/− cells expressing wild-type Arpc1B-SFB or mutant Arpc1B-SFB (Arpc1BR74A and Arpc1BR142A) proteins. (D) Representative immunoblots illustrating Gapdh-normalized G-actin and F-actin levels in indicated HEK293T cells. Black asterisks indicate F/G actin ratio differences, as compared to NTC-HEK293T cells (taken as 1.0). n = 3 biological replicates. (E) Representative immunoblots illustrating Gapdh-normalized Arpc1B-SFB levels in uninfected or wt-infected indicated HEK293T cells at 6 hpi. Black asterisks denote Arpc1B level differences, as compared to the corresponding uninfected HEK293T cells (taken as 1.0). n = 3 biological replicates. (F, G) CFU-based internalization analysis of wt and Cgyps1-11∆ strains in Arpc1B−/ HEK293T (F) and p38/− HEK293T cells (G), after 4 h co-incubation. Asterisks mark ingestion differences, as compared to wt-infected cells. n = 4 biological replicates in (F, G). (H) Representative immunoblots illustrating Arpc1B levels in p38−/− and NTC-HEK293T cells. n = 3 biological replicates. (I) Representative immunoblots illustrating diminished phospho-p38 levels in Arpc1B/−HEK293T cells. Data represent fold-change in phosphorylated-p38 protein levels in Arpc1B−/− cells, compared to NTC-HEK293T cells (considered as 1.0). n = 3 biological replicates. Data information: In (B, DI), data are presented as mean ± SEM. *P  <  0.05; **P  <  0.01; ***P  <  0.001; ****P  <  0.0001; n.s. not significant. Unpaired or paired two-tailed Student’s t test in (B, DI). P  =  0.0049 (Arpc1B−/ vs. NTC) in (B). P  =  0.0016 (Arpc1B/− vs. NTC), P  =  0.0442 (Arpc1B−/−/Arpc1BR74A vs. NTC), P  =  0.002 (Arpc1B−/−/Arpc1BR142A vs. NTC), P  =  0.008 (Arpc1B−/−/Arpc1B vs. Arpc1B−/−), P  =  0.04 (Arpc1B−/−/Arpc1BR74A vs. Arpc1B−/−/Arpc1B), P  =  0.005 (Arpc1B−/−/Arpc1BR142A vs. Arpc1B−/−/Arpc1B) in (D). P  =  0.0215 (wt-Arpc1B−/−/Arpc1B vs. uninfected-Arpc1B−/−/Arpc1B), P  =  0.0188 (wt-Arpc1B−/−/Arpc1BR74A vs. uninfected-Arpc1B−/−/Arpc1BR74A) in (E). P  =  0.022 (Cgyps1-11Δ-NTC vs. wt-NTC), P  =  0.019 (Cgyps1-11Δ-Arpc1B−/ vs. wt-Arpc1B−/−) in (F). P  =  0.0088 (Cgyps1-11Δ-NTC vs. wt-NTC), P  =  0.0003 (Cgyps1-11Δ-p38−/− vs. wt-p38/), P  =  0.0232 (Cgyps1-11Δ-p38−/− vs. Cgyps1-11Δ-NTC) in (G). P  =  0.0002 (Arpc1B−/− vs. NTC) in (I). Scale bar = 20 μm in (A, C). Source data are available online for this figure.
Figure 8
Figure 8. Cg infection of A-498 cells inhibits neutrophil migration.
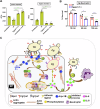
(A) Neutrophil migration assay. The migration of FITC-conjugated anti-CD66b-labelled human neutrophils towards Cg-infected A-498 cells was measured by recording the fluorescence of the cells present in the upper and the lower chamber of the transwell filter after 2 h co-culture. Uninfected, Cg wt/Cgyps1-11∆-infected or IL-8 (3 ng)-treated A-498 cells were incubated for 24 h in the lower chamber, prior to co-culturing with neutrophils. Data are expressed as Arbitrary Fluorescent Units (AFUs). Black asterisks indicate differences in neutrophil movement in indicated conditions, as compared to uninfected A-498 cells. n = 3 biological replicates. (B) Neutrophil-mediated Cg killing. Data represent wt- and Cgyps1-11∆ CFUs after incubation with neutrophils at indicated time points. Black and green asterisks indicate a decrease in viable cells, as compared to 30 min CFUs of wt and Cgyps1-11∆ strains, respectively. n = 4 biological replicates. (C) A schematic summarizing key findings of the study. Candida glabrata (Cg) adheres to epithelial cells (EC) via Epa1 adhesin, and is internalized by ECs. Putative cell surface-associated aspartyl proteases, CgYps1 and CgYps7, interact with Arpc1B, leading to its degradation and filamentous actin disassembly. Cg internalization reduces p38 MAPK phosphorylation, decreases p38-Arpc1B interaction, and impedes IL-6 and IL-8 secretion. Diminished IL-8 levels inhibit neutrophil movement towards Cg, that protects Cg from neutrophil-mediated killing. Of note, CgYapsins cleave Epa1 adhesin off the Cg cell wall in laboratory growth conditions, degrade IL-8 in vitro and are pivotal determinants of Cg-EC interaction in the cell culture model, as their deletion deregulated the above-mentioned EC response, and led to elevated Cg killing by neutrophils. Data information: In (A, B), data are presented as mean ± SEM. *P  <  0.05; **P  <  0.01; ***P  <  0.001; ****P  <  0.0001; n.s. not significant. Unpaired two-tailed Student’s t test in (A, B). P  =  0.0006 (wt vs. uninfected), P  =  0.0019 (Cgyps1-11Δ vs. uninfected), P  =  0.0015 (uninfected, IL-8-treated vs. uninfected, untreated), P  =  0.00004960 (Cgyps1-11Δ vs. wt), P  =  0.0002 (wt vs. uninfected, IL-8-treated) in lower chamber in (A). P  =  0.0007 (wt vs. uninfected), P  =  0.0034 (Cgyps1-11Δ vs. uninfected), P  =  0.0049 (uninfected, IL-8-treated vs. uninfected, untreated), P  =  0.00007254 (Cgyps1-11Δ vs. wt), P  =  0.00009010 (wt vs. uninfected, IL-8 treated) in upper chamber in (A). P  =  0.0157 (wt-60 min vs. wt-30 min), P  =  0.0003 (wt-120 min vs. wt-30 min), P  =  0.0000038 (Cgyps1-11Δ-60 min vs. Cgyps1-11Δ-30 min), P  =  0.00000001 (Cgyps1-11Δ-120 min vs. Cgyps1-11Δ-30 min), P  =  0.0109 (Cgyps1-11Δ- 60 min vs. wt-60 min), P  =  0.0007 (Cgyps1-11Δ -120 min vs. wt-120 min) in (B). Source data are available online for this figure.
Figure EV1
Figure EV1. Cgyps1-11∆ displays increased adherence to AGS cells.
(A) Adherence of indicated, S35-labelled Cg strains to fixed A-498 (human kidney epithelial) cells after 2 h co-incubation. Black asterisks denote statistically-significant adherence differences in indicated strains, compared to wild-type (wt)-infected A-498. n = 3 biological replicates. (B) Adherence of indicated, S35-labelled Cg strains to fixed AGS (human stomach epithelial) cells after 2 h co-incubation. Black asterisks denote statistically-significant adherence differences in indicated strain-infected, as compared to wild-type (wt)-infected AGS cells. n = 3 biological replicates. (C) Super resolution micrographs showing interaction of mCherry-expressing wt, Cgyps1-11∆ and epa1∆ strains with A-498 cells after 2 h co-culture. Infected epithelial cells were stained with concanavalin A (ConA)-FITC to differentiate between intracellular (ConA-non-stained) and extracellular (ConA-stained) Cg. DAPI was used to stain the host epithelial cell nuclei. Representative images were obtained from three biological experiments using Elyra 7 with 63X/1.44 NA objective lens. (D) Secreted GM-CSF (granulocyte-macrophage colony-stimulating factor) measurement in uninfected and Cg-infected A-498 cells after 24 h incubation. n = 4 biological replicates. (E, F) Secreted IL-6 (E) and IL-8 (F) levels in uninfected and Cg-infected A-498 cells. Infection was carried out at a MoI (multiplicity of infection) of 10:1. n = 3 biological replicates in (E), and n = 4 biological replicates in (F). (G, H) Secreted IL-6 (G) and IL-8 (H) levels in DMSO or dynasore (50 µM)-treated, Cg-infected, A-498 cells. Infection was carried out at 1:1 MoI. n = 3 biological replicates. Data information: In (A, B, DH), data are presented as mean ± SEM. *P  <  0.05; **P  <  0.01; ***P  <  0.001; ****P  <  0.0001; n.s., not significant. Unpaired two-tailed Student’s t test in (A, B, DH). P  =  0.0016 (Cgyps1-11Δ vs. wt), P  =  0.000072 (epa1Δ vs. wt), P  = 0.0178 (Cgyps1-11Δepa1Δ vs. wt), P  =  0.00002 (epa1Δ6Δ7Δ vs. wt) in (A). P  =  0.0106 (Cgyps1-11Δ vs. wt), P  =  0.0036 (epa1Δ vs. wt), P  =  0.035 (epa1Δ6Δ7Δ vs. wt) in (B). P  =  0.0031 (wt vs. uninfected), P  =  0.0042 (Cgyps1-11Δ vs. uninfected), P  = 0.002 (Cgyps1-11Δ vs. wt) in (E). P  =  0.0016 (wt vs. uninfected), P  =  0.0002 (Cgyps1-11Δ vs. uninfected), P  = 0.00004128 (Cgyps1-11Δ vs. wt) in (F). P  =  0.0306 (wt vs. uninfected), P  =  0.0048 (Cgyps1-11Δ vs. uninfected), P  = 0.0027 (Cgyps1-11Δ vs. wt) P  =  0.0004 (Cgyps1-11Δ-Dynasore vs. Cgyps1-11Δ-DMSO) in (G). P  =  0.00004918 (wt vs. uninfected), P  =  0.0001 (Cgyps1-11Δ vs. uninfected), P  = 0.00002526 (Cgyps1-11Δ vs. wt), P  =  0.0004 (Cgyps1-11Δ-Dynasore vs. Cgyps1-11Δ-DMSO) in (H). Scale bar = 10 μm in (C).
Figure EV2
Figure EV2. p38 MAPK inhibition has no effect on Cg internalization.
(A, B) Micrographs of hematoxylin-eosin (H&E)-stained (A) and anti-CD45 antibody-stained (B) kidney tissue sections (40×) of uninfected, and wt- or Cgyps1-11∆-infected mice at day 1 post-infection. n = 3 mice/group. Yellow arrowheads mark representative polymorphonuclear neutrophils infiltrated into the tissue. (C, D) CFU-based internalization analysis of wt and Cgyps1-11∆ strains in DMSO, SB203580 (10 µM; C) or BAY 11-7082 (10 µM; D) pre-treated A-498 cells, after 4 h co-incubation. The internalization percentage was calculated by dividing Cg CFUs recovered at 4 h by 0 h-CFUs (Cg cell number used for A-498 infection), and multiplying the number by 100. Asterisks mark differences between wt and Cgyps1-11∆ ingestion. n = 4 biological replicates. (E) CFU-based internalization analysis of wt and Cgyps1-11∆ strains in DMSO or cytochalasin D (Cyto D; 5 µM) pre-treated A-498 cells, after 4 h co-incubation. Black asterisks mark differences between wt and Cgyps1-11∆ ingestion. n = 4 biological replicates. Data information: In (CE), data are presented as mean ± SEM. *P  <  0.05; **P  <  0.01; ***P  <  0.001; ****P  <  0.0001; n.s., not significant. Unpaired two-tailed Student’s t test in (CE). P  =  0.0007 (Cgyps1-11Δ-DMSO vs. wt-DMSO), P  =  0.0006 (Cgyps1-11Δ-SB203580 vs. wt-SB203580) in (C). P  =  0.000031 (Cgyps1-11Δ-DMSO vs. wt-DMSO), P  =  0.0009 (Cgyps1-11Δ-BAY 11-7082 vs. wt-BAY 11-7082) in (D). P  =  0.0000458 (Cgyps1-11Δ-DMSO vs. wt-DMSO), P  =  0.0000942 (Cgyps1-11Δ-CytoD vs. wt-CytoD), P  =  0.0000295 (wt-CytoD vs. wt-DMSO) in (E). Scale bar = 20 µm in (A, B).
Figure EV3
Figure EV3. CgYps1 and CgYps7 interact with the epithelial cell protein Arpc1B.
(A, B) Representative immunoblots (n = 2 biological replicates) illustrating Arpc1B interaction with CgYps1 (A) and CgYps7 (B). Lysates (800 μg) of Arpc1B-SFB- or GFP-SFB-expressing A-498 cells were incubated with streptavidin beads, followed by incubation with 50-100 μg of E. coli-purified, 6X-histidine-tagged CgYps1 or CgYps7 protein. Input samples (E. coli-purified proteins; 30 μg) for CgYps1 (A) and CgYps7 (B) are shown underneath the blots of the panel (A). (C) qRT-PCR-based Arpc1B gene expression analysis in indicated A-498 cells after 6 h of Cg infection. Arpc1B gene expression was normalized against GAPDH mRNA control, and represent fold-change in Arpc1B transcript levels in Cg-infected, compared to uninfected A-498 cells (taken as 1.0). n = 3 biological replicates. (D, E) Representative immunoblots illustrating Arpc1B protein levels in A-498 cells that were left uninfected or infected for 6 h at 1:1 MoI with wt expressing empty plasmid (V) or Cgyps1-11Δ expressing V, CgYPS1 or CgYPS7 (D) or infected with wt and Cgyps1-11Δ strains at indicated MoI (E). The signal intensity in each lane was quantified using the ImageJ software, and Arpc1B levels were normalized against the corresponding GAPDH levels. Data are plotted on the right side of the blots. Purple, green and black asterisks indicate Arpc1B level differences, as compared to Cgyps1-11Δ/V-infected, wt/V-infected and uninfected A-498 cells, respectively. n = 3 biological replicates in (D), and n = 4 biological replicates in (E). (F) Representative confocal micrographs illustrating co-localization of Arpc1B and p38 MAPK in A-498 cells. A-498 cells were left uninfected or infected with mCherry-expressing wt and Cgyps1-11Δ-strains for 6 h, followed by labelling with anti-Arpc1B and anti-p38 antibodies. Cells from two biological infection experiments were imaged using the confocal microscope (Leica SP8) with 63X/1.44 NA objective lens in z-stack mode. Arpc1B and p38 signal intensities were measured for 50 foci in a minimum of 15 cells, using the LASX software, and their co-localization was determined via the Pearson correlation coefficient (PCC). Co-localization data are plotted on the right side of the micrographs. Arpc1B and p38 co-localization is indicated by red arrows in the Inset. Green and black asterisks indicate statistically-significant differences, compared to wt-infected and uninfected A-498 cells, respectively. (G) CFU-based internalization analysis of wt and Cgyps1-11∆ strains in DMSO or CK-666 (1 µM) pre-treated A-498 cells, after 4 h co-incubation. Asterisks mark differences between wt and Cgyps1-11∆ ingestion. n = 4 biological replicates. (H) CFU-based adherence analysis of wt and Cgyps1-11∆ strains in DMSO or CK-666 (1 µM) pre-treated A-498 cells, after 2 h co-incubation. n = 4 biological replicates. (I) Flow cytometry-based analysis of Annexin V staining in indicated A-498 cells. n = 4 biological replicates. Data information: In (CI), data are presented as mean ± SEM. *P  <  0.05; **P  <  0.01; ***P  <  0.001; ****P  <  0.0001; n.s., not significant. Unpaired or paired two-tailed Student’s t test in (CI). P  =  0.0482 (wt/V vs. uninfected), P  =  0.0375 (Cgyps1-11Δ/V vs. wt/V), P  =  0.0056 (Cgyps1-11∆/CgYPS1 vs. uninfected), P  =  0.0349 (Cgyps1-11∆/CgYPS7 vs. uninfected), P  =  0.0073 (Cgyps1-11∆/CgYPS1 vs. Cgyps1-11∆/V), P  =  0.0145 (Cgyps1-11∆/CgYPS7 vs. Cgyps1-11∆/V) in (D). P  =  0.0025 (wt at 1:1 MoI vs. uninfected), P  =  0.0129 (Cgyps1-11Δ vs. wt at 1:1 MoI), P  =  0.004 (wt at 5:1 MoI vs. uninfected), P  =  0.0026 (Cgyps1-11Δ vs. wt at 5:1 MoI), P  =  0.0023 (wt at 10:1 MoI vs. uninfected), P  =  0.0013 (Cgyps1-11Δ vs. wt at 10:1 MoI) in (E). P  =  0.0178 (wt vs. uninfected), P  =  0.00000004 (Cgyps1-11∆ vs. uninfected), P  =  0.00000000000000001 (Cgyps1-11Δ vs. wt) in (F). P  =  0.0002 (Cgyps1-11Δ-DMSO vs. wt-DMSO), P  =  0.0013 (Cgyps1-11Δ-CK-666 vs. wt-CK-666) in (G). P  =  0.0003 (Cgyps1-11Δ-DMSO vs. wt-DMSO), P  =  0.0015 (Cgyps1-11Δ-CK-666 vs. Cgyps1-11Δ-DMSO) in (H). P  =  0.0038 (Arpc1B-siRNA vs. Control siRNA) in (I). Scale bar = 20 µm in (F).
Figure EV4
Figure EV4. Arpc1B inhibition decreases p65 nuclear localization in Cgyps1-11Δ-infected A-498 cells.
(A) Confocal micrographs illustrating p65 cellular localization in control-siRNA or Arpc1B-siRNA treated A-498 cells, after 6 h of infection with mCherry-expressing wt or Cgyps1-11Δ cells. Immunofluorescence analysis of A-498 cells was performed with anti-p65 antibody, and images were captured using the confocal microscope (Leica SP8) with 63X/1.44 NA objective lens in z-stack mode. Overlay images show cytoplasmic and nuclear p65 distribution, with the anti-rabbit Alexa Flour-488 antibody in green, the mCherry-tagged Cg in red and the host cell nuclei in blue color. For quantification, fluorescence signal intensities in the cytoplasm and the nucleus were measured in a minimum of 40 cells in two biological experiments, using the ImageJ software. Data are plotted, as the ratio of nuclear to cytoplasm abundance, on the right side of micrographs. Green and black asterisks indicate statistically-significant differences, as compared to wt-infected and uninfected A-498 cells, respectively. (B) Representative immunoblots showing reduction in Arpc1B protein levels in A-498 cells that were transfected with Arpc1B-siRNA (10 µm), as compared to scrambled-siRNA (10 µm)-transfected A-498 cells. GAPDH was used as loading control. n = 3 biological replicates. (C, D) Confocal micrographs illustrating p65 cellular localization in DMSO or CK-666 (1 µM)-treated (C), and DMSO or SB203580 (10 µM)-treated (D) A-498 cells, after 6 h of infection with mCherry-expressing wt or Cgyps1-11Δ cells. Immunofluorescence analysis of A-498 cells was performed with anti-p65 antibody, and images were captured using the confocal microscope (Leica SP8) with 63X/1.44 NA objective lens in z-stack mode. Overlay images show cytoplasmic and nuclear p65 distribution, with the anti-rabbit Alexa Flour-488 antibody in green, the mCherry-tagged Cg in red and the host cell nuclei in blue color. For quantification, fluorescence signal intensities in the cytoplasm and the nucleus were measured in a minimum of 40 cells in two biological experiments, using the ImageJ software. Data are plotted, as the ratio of nuclear to cytoplasm abundance, on the right side of micrographs. Green and black asterisks indicate statistically-significant differences, as compared to wt-infected and uninfected A-498 cells, respectively. Data information: In (A, C, D), data are presented as mean ± SEM. **P  <  0.01; ***P  <  0.001; ****P  <  0.0001; n.s. not significant. Unpaired two-tailed Student’s t test in (A, C, D). P  =  0.0000000005 (wt-Control siRNA vs. uninfected-Control siRNA), P  =  0.000000000001577 (Cgyps1-11Δ-Control siRNA vs. uninfected-Control siRNA), P  =  0.0000234 (Cgyps1-11Δ-Control siRNA vs. wt-Control siRNA), P  =  0.0000002043 (wt-Arpc1B siRNA vs. wt-Control siRNA), P  =  0.0000000002 (Cgyps1-11Δ-Arpc1B siRNA vs. Cgyps1-11Δ-Control siRNA) in (A). P  =  0.000143 (wt-DMSO vs. uninfected-DMSO), P  =  0.000000000002 (Cgyps1-11Δ-DMSO vs. uninfected-DMSO), P  =  0.0018 (Cgyps1-11Δ-DMSO vs. wt-DMSO), P  =  0.00001608 (wt-CK-666 vs. wt-DMSO), P  =  0.0000000000004 (Cgyps1-11Δ-CK-666 vs. Cgyps1-11Δ-DMSO) in (B). P  =  0.00000104 (wt-DMSO vs. uninfected-DMSO), P  =  0.000000000000023 (Cgyps1-11Δ-DMSO vs. uninfected-DMSO), P  =  0.00000029 (Cgyps1-11Δ-DMSO vs. wt-DMSO), P  =  0.0014 (wt-SB203580 vs. wt-DMSO), P  =  0.000000000001 (Cgyps1-11Δ-SB203580 vs. Cgyps1-11Δ-DMSO) in (D). Scale bar = 20 μm in (A, C, D).
Figure EV5
Figure EV5. rCgYps1 reduces Arpc1B levels.
(A) Adherence of indicated Cg strains to fixed Caco-2 (human intestinal epithelial) cells after 2 h co-incubation, as determined by CFU-based assay. Black asterisks mark adherence differences, as compared to wt-coincubated A-498 cells. n = 4 biological replicates. (B) Representative immunoblots illustrating Arpc1B levels in A-498 cells that were either left untreated or incubated for 6 h with P. pastoris-partially purified rCgYps1 (100 µg), rCgYps1D91A (100 µg), partially-purified proteins (100 µg) from uninduced supernatants of P. pastoris cells or citrate buffer (pH 6.0). rCgYps1 and rCgYps1D91A protein expression in P. pastoris cells was induced by adding (2%) methanol. The signal intensity in each lane was measured using the ImageJ software, and Arpc1B levels were normalized against GAPDH levels. Data represent fold-change in Arpc1B levels in indicated conditions, as compared to untreated A-498 cells (considered as 1.0), and are plotted on the right side of the blots. n = 4 biological replicates. (C) Secreted IL-6 and IL-8 cytokine levels in uninfected, wt- and Cgyps1-11∆-infected A-498 cells at indicated time points post-infection. Infection was carried at 5:1 MoI. Green and black asterisks indicate statistically-significant differences in cytokine secretion, as compared to wt-infected and uninfected A-498 cells, respectively. n = 4 biological replicates. (D) P. pastoris-partially-purified rCgYps1 and rCgYps1D91A proteins (100 μg) were incubated with the human recombinant IL-8 cytokine (200 pg; MEM medium) for 4 h at 37 °C, and IL-8 levels were measured using the human IL-8 BD OptEIA ELISA kit. IL-8 incubated in MEM medium was used as control. n = 3 biological replicates. (E) Human recombinant IL-8 (100 pg) was incubated with overnight YPD-grown wt and Cgyps1-11Δ cells (1.0 O.D600; MEM medium), pepsin (100 ng) or MEM medium for 6 h at 37 °C. Samples were centrifuged to remove Cg cells, and IL-8 levels in supernatants were measured using the human IL-8 BD OptEIA ELISA kit. The Pepsin enzyme was used as control. Black asterisks denote statistically-significant differences, as compared to IL-8 incubated in MEM medium. n = 3 biological replicates. Data information: In (AE), data are presented as mean ± SEM. *P  <  0.05; **P  <  0.01; ***P  <  0.001; ****P  <  0.0001; n.s., not significant. Unpaired or paired two-tailed Student’s t test in (AE). P  =  0.0002 (epa1Δ vs. wt), P  =  0.0024 (Cgyps1-11Δ vs. wt), P  =  0.00000603 (Cgyps1-11∆ vs. epa1Δ) in (A). P  =  0.003 (Induced rCgYps1 vs. untreated), P  =  0.005 (Induced rCgYps1 vs. buffer control), P  =  0.0008 (Induced rCgYps1 vs. uninduced rCgYps1), P  =  0.009 (Induced rCgYps1D91A vs. induced rCgYps1) in (B). P  =  0.0058 (Cgyps1-11∆-4h vs. wt-4h), P  =  0.0063 (Cgyps1-11∆-4h vs. uninfected-4h), P  =  0.0013 (wt-6h vs. uninfected-6h), P  =  0.0475 (Cgyps1-11∆-6h vs. uninfected-6h), P  =  0.0008 (Cgyps1-11∆-6h vs. wt-6h), P  =  0.0109 (wt-8h vs. uninfected-8h), P  =  0.0037 (Cgyps1-11∆-8h vs. uninfected-8h), P  =  0.0003 (Cgyps1-11∆-8h vs. wt-8h) in IL-6 section of (C). P  =  0.0168 (Cgyps1-11∆-4h vs. wt-4h), P  =  0.0047 (wt-6h vs. uninfected-6h), P  =  0.0153 (Cgyps1-11∆-6h vs. uninfected-6h), P  =  0.0011 (Cgyps1-11∆-6h vs. wt-6h), P  =  0.00000886 (wt-8h vs. uninfected-8h), P  =  0.00002363 (Cgyps1-11∆-8h vs. uninfected-8h), P  =  0.00000019 (Cgyps1-11∆-8h vs. wt-8h) in IL-8 section of (C). P  =  0.0061 (Induced rCgYps1 vs. uninduced rCgYps1), P  =  0.0006 (Induced rCgYps1D91A vs. induced rCgYps1) in (D). P  =  0.0079 (wt vs. MEM + IL-8), P  =  0.0061 (Pepsin vs. MEM + IL-8), P  =  0.0021 (Cgyps1-11∆ vs. wt) in (E).

Similar articles

References

    1. Abella JVG, Galloni C, Pernier J, Barry DJ, Kjær S, Carlier MF, Way M (2016) Isoform diversity in the Arp2/3 complex determines actin filament dynamics. Nat Cell Biol 18:76–86 - PubMed
    1. Askari F, Rasheed M, Kaur R (2022) The yapsin family of aspartyl proteases regulate glucose homeostasis in Candida glabrata. J Biol Chem 298:101593 - PMC - PubMed
    1. Battu A, Purushotham R, Dey P, Vamshi SS, Kaur R (2021) An aspartyl protease-mediated cleavage regulates structure and function of a flavodoxin-like protein and aids oxidative stress survival. PLoS Pathog 17:e1009355 - PMC - PubMed
    1. Bolger-Munro M, Choi K, Scurll JM, Abraham L, Chappell RS, Sheen D, Dang-Lawson M, Wu X, Priatel JJ, Coombs D et al (2019) Arp2/3 complex-driven spatial patterning of the BCR enhances immune synapse formation, BCR signaling and b cell activation. eLife 8:1–40 - PMC - PubMed
    1. Brigida I, Zoccolillo M, Cicalese MP, Pfajfer L, Barzaghi F, Scala S, Oleaga-Quintas C, Álvarez-Álvarez JA, Sereni L, Giannelli S et al (2018) T-cell defects in patients with ARPC1B germline mutations account for combined immunodeficiency. Blood 132:2362–2374 - PMC - PubMed

MeSH terms

LinkOut - more resources