. 2024 Nov;56(11):2380-2391.
doi: 10.1038/s41588-024-01933-1. Epub 2024 Sep 30.

Multivariate genomic analysis of 5 million people elucidates the genetic architecture of shared components of the metabolic syndrome

Affiliations

Multivariate genomic analysis of 5 million people elucidates the genetic architecture of shared components of the metabolic syndrome

Sanghyeon Park et al. Nat Genet. 2024 Nov.

Abstract

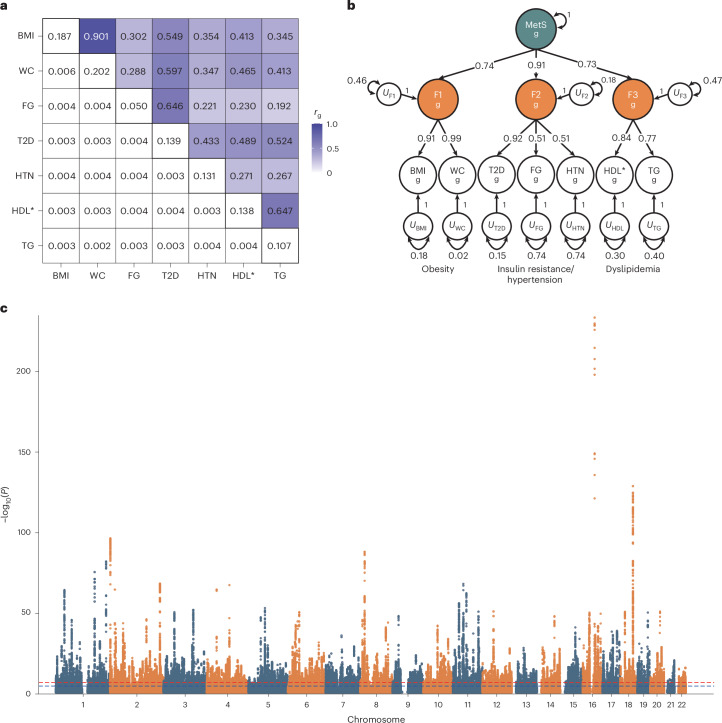
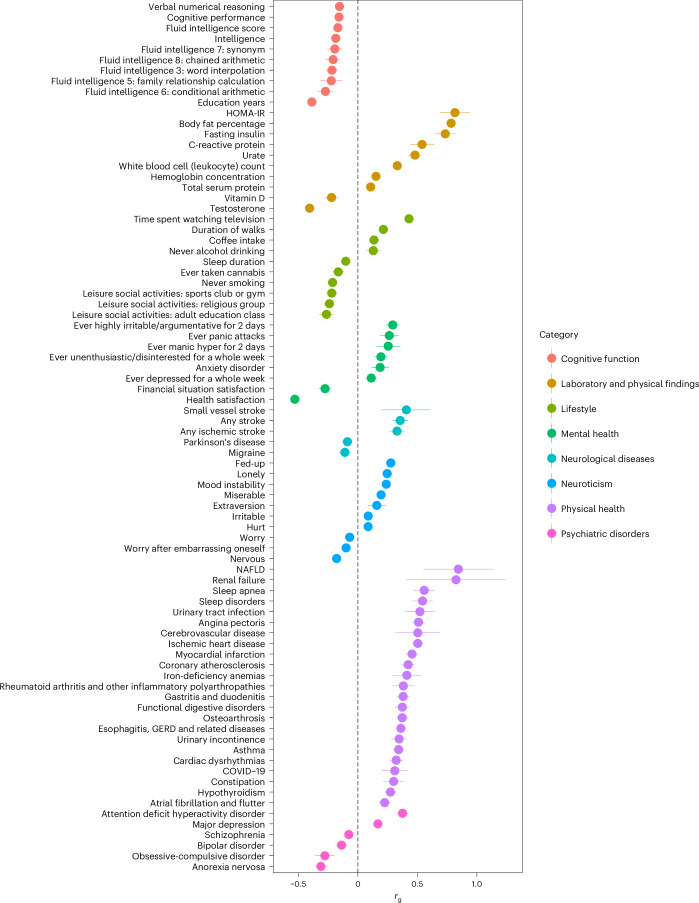
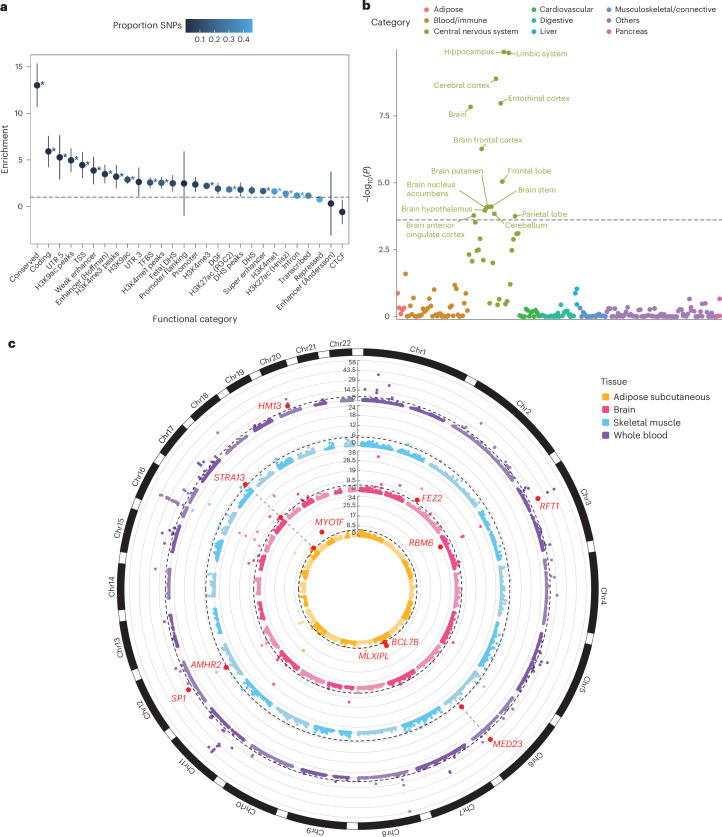
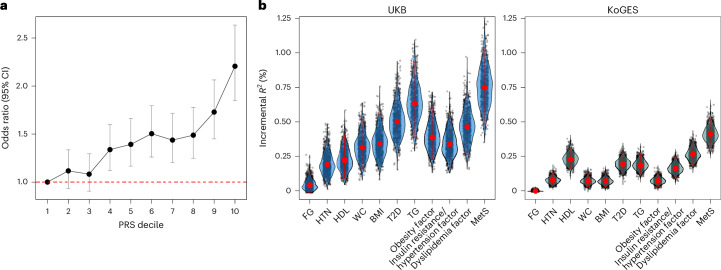
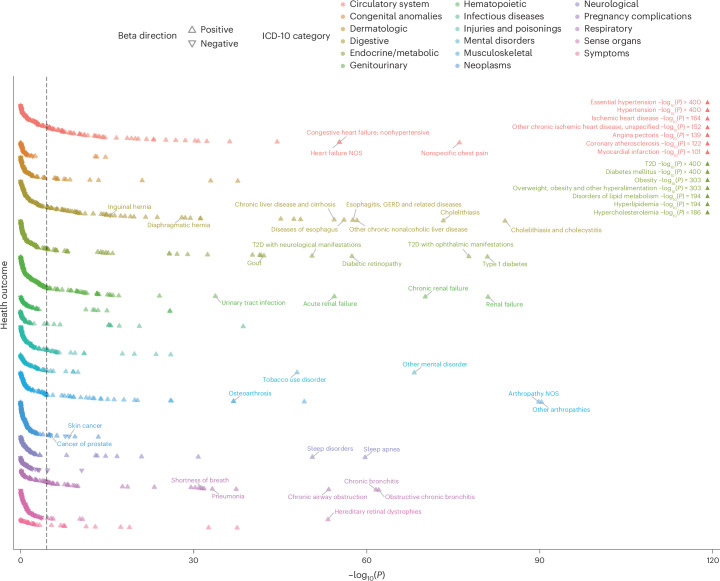
Metabolic syndrome (MetS) is a complex hereditary condition comprising various metabolic traits as risk factors. Although the genetics of individual MetS components have been investigated actively through large-scale genome-wide association studies, the conjoint genetic architecture has not been fully elucidated. Here, we performed the largest multivariate genome-wide association study of MetS in Europe (nobserved = 4,947,860) by leveraging genetic correlation between MetS components. We identified 1,307 genetic loci associated with MetS that were enriched primarily in brain tissues. Using transcriptomic data, we identified 11 genes associated strongly with MetS. Our phenome-wide association and Mendelian randomization analyses highlighted associations of MetS with diverse diseases beyond cardiometabolic diseases. Polygenic risk score analysis demonstrated better discrimination of MetS and predictive power in European and East Asian populations. Altogether, our findings will guide future studies aimed at elucidating the genetic architecture of MetS.


Conflict of interest statement

A.C.F. is cofounder of Goodpath. P.T.E. reports personal fees from Bayer AG, Novartis and MyoKardia. P.N. reports personal fees from Allelica, Apple, AstraZeneca, Blackstone Life Sciences, Creative Education Concepts, CRISPR Therapeutics, Eli Lilly & Co., Foresite Labs, Genentech/Roche, GV, HeartFlow, Magnet Biomedicine, Merck and Novartis; scientific advisory board membership at Esperion Therapeutics, Preciseli and TenSixteen Bio; scientific cofounder status at TenSixteen Bio; equity in MyOme, Preciseli and TenSixteen Bio; and spousal employment at Vertex Pharmaceuticals, all unrelated to the present work. W.-Y.P. was employed by the commercial company GENINUS. A.T. declares he is a cofounder and equity shareholder of GeneXwell Inc. A.T. is an advisor to InsideTracker. The other authors declare no competing interests.

Figures

Fig. 1
Fig. 1. Genetic correlations, multivariate genetic factor model and multivariate GWAS of MetS.
a, SNP-based heritability and pairwise genetic correlations for the seven MetS components were estimated using LD score regression. The off-diagonal upper, lower and diagonal triangles represent the pairwise genetic correlation, the standard error of the genetic correlation and SNP-based heritability, respectively. b, Path diagram with standardized factor loadings in the hierarchical model estimated using Genomic SEM. The U represents the residual variance that is not explained by the latent factor. The subscript g indicates that the model was built based on genetic covariances between the MetS components. c, Manhattan plot of Genomic SEM-based GWAS associations. The x axis represents the chromosomal position, and the y axis represents the uncorrected −log10(P) from two-sided z tests for SNP associations with MetS. *Reverse-coded.
Fig. 2
Fig. 2. Genetic correlation between MetS and external traits.
Among the 119 external traits, 82 Bonferroni significant rg values are illustrated (Supplementary Tables 19 and 18 report all rg values with 119 traits and corresponding sample size, respectively). Error bars represent 95% CIs for rg, calculated as rg ± 1.96 × s.e. The black dashed line indicates an rg of 0. HOMA-IR, homeostatic model assessment of insulin resistance.
Fig. 3
Fig. 3. Post-GWAS analyses of MetS GWAS.
a, Heritability enrichment for functional SNP categories. The x axis represents functional categories, and the y axis represents enrichment. Error bars represent the 95% CIs, calculated as enrichment ± 1.96 × s.e. Asterisks represent significant enrichment after Bonferroni correction (uncorrected P from two-sided enrichment test <9.43 × 10−4), and exact P is available in Supplementary Table 21. b, Tissue-specific enrichment analysis using LDSC-SEG. The x axis represents tissue categories, and the y axis represents the uncorrected −log10(P) from one-sided z test for enrichment in specific tissues. The black dashed line represents the Bonferroni significance threshold of P = 1.02 × 10⁻⁴. c, Circos plot for gene prioritization using SMR in four tissues. The y axis represents the uncorrected −log10(P) from two-sided χ²-test with 1 degree of freedom for the gene association. Red dots with annotations show replicated genes. The dashed black line represents the Bonferroni significance threshold for the corresponding tissue. Chr, chromosome; CTCF, CCCTC-binding factor; DGF, digital genomic footprint; DHS, DNase I hypersensitivity site; TFBS, transcription factor binding site; TSS, transcription start site; UTR, untranslated region.
Fig. 4
Fig. 4. MetS PRS analysis in European and East Asian populations.
a, Line plot representing the change in OR across deciles of the MetS PRS in 11,139 UKB individuals; error bars indicate 95% CIs, calculated as OR ± 1.96 × s.e. The red dashed line represents an OR of 1. b, Violin plot illustrating the incremental proportion of variance explained (ΔR2) by the PRS of seven MetS components and four latent factors for predicting MetS in UKB and KoGES cohorts. Each dot represents ΔR2 from a single iteration of bootstrapping. Red dots represent ΔR2 obtained with all individuals and error bars indicate 95% CIs estimated using the percentile bootstrapping method with 1,000 iterations.
Fig. 5
Fig. 5. Phenome-wide association study using the MetS PRS.
Scatterplot illustrating the association between the genome-wide MetS PRS and 1,621 health outcomes in the UKB. The x axis represents uncorrected −log10(P) from the two-sided z test for beta (that is, the log of the OR), and the y axis represents health outcomes. Health outcomes are color-coded by category; triangles indicate the direction of beta. Associations with high significance are labeled independently in the upper-right corner of the plot. The black dashed line represents the Bonferroni-corrected significance threshold of P < 3.08 × 10−5. NOS, nitric oxide synthase; GERD, gastroesophageal reflux disease.

Similar articles

Cited by

References

    1. Alberti, K. G. et al. Harmonizing the metabolic syndrome: a joint interim statement of the international diabetes federation task force on epidemiology and prevention; National Heart, Lung, And Blood Institute; American Heart Association; World Heart Federation; International Atherosclerosis Society; and International Association for the Study of Obesity. Circulation120, 1640–1645 (2009). - PubMed
    1. Poulsen, P., Ohm Kyvik, K., Vaag, A. & Beck-Nielsen, H. Heritability of type II (non-insulin-dependent) diabetes mellitus and abnormal glucose tolerance—a population-based twin study. Diabetologia42, 139–145 (1999). - PubMed
    1. Kupper, N. et al. Heritability of daytime ambulatory blood pressure in an extended twin design. Hypertension45, 80–85 (2005). - PubMed
    1. Musani, S. K. et al. Heritability of the severity of the metabolic syndrome in whites and Blacks in 3 large cohorts. Circ. Cardiovasc. Genet.10, e001621 (2017). - PMC - PubMed
    1. Graham, S. E. et al. The power of genetic diversity in genome-wide association studies of lipids. Nature600, 675–679 (2021). - PMC - PubMed

LinkOut - more resources