. 2024 Nov;56(11):2361-2369.
doi: 10.1038/s41588-024-01934-0. Epub 2024 Sep 30.

Valid inference for machine learning-assisted genome-wide association studies

Affiliations

Valid inference for machine learning-assisted genome-wide association studies

Jiacheng Miao et al. Nat Genet. 2024 Nov.

Abstract

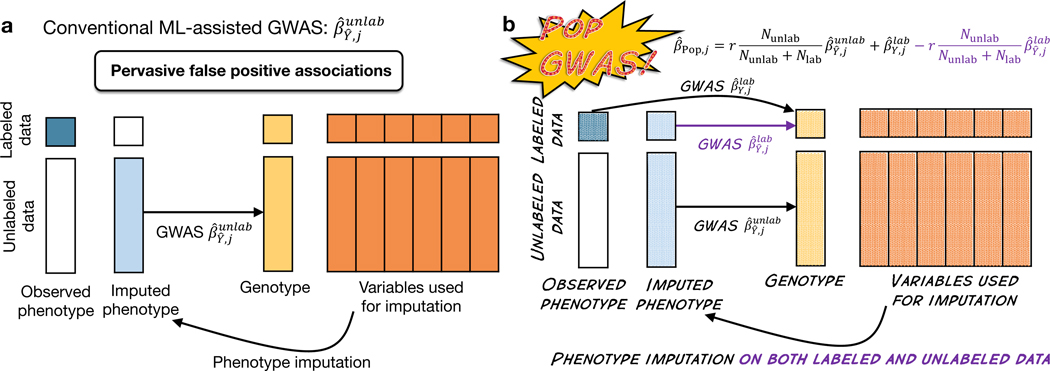
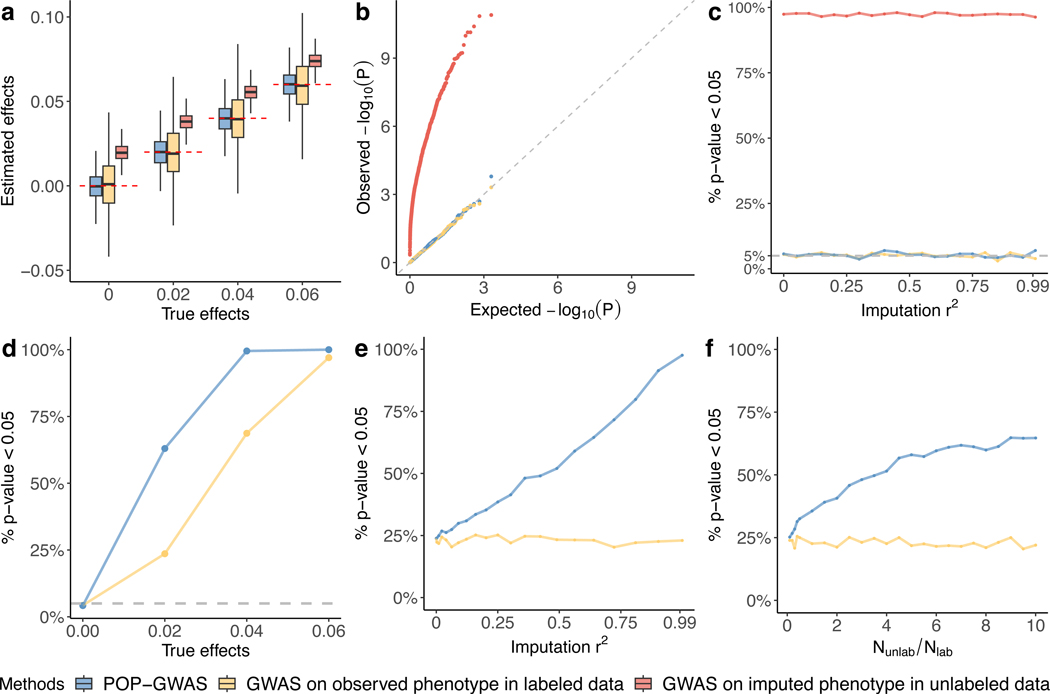
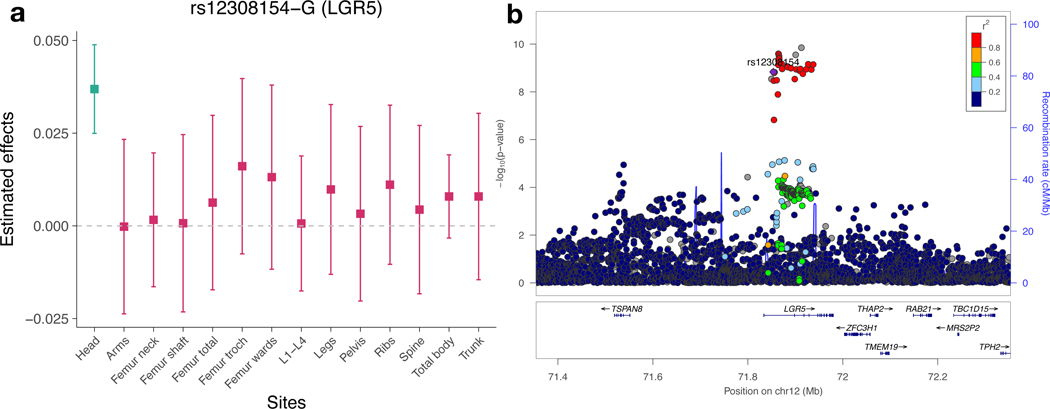
Machine learning (ML) has become increasingly popular in almost all scientific disciplines, including human genetics. Owing to challenges related to sample collection and precise phenotyping, ML-assisted genome-wide association study (GWAS), which uses sophisticated ML techniques to impute phenotypes and then performs GWAS on the imputed outcomes, have become increasingly common in complex trait genetics research. However, the validity of ML-assisted GWAS associations has not been carefully evaluated. Here, we report pervasive risks for false-positive associations in ML-assisted GWAS and introduce Post-Prediction GWAS (POP-GWAS), a statistical framework that redesigns GWAS on ML-imputed outcomes. POP-GWAS ensures valid and powerful statistical inference irrespective of imputation quality and choice of algorithm, requiring only GWAS summary statistics as input. We employed POP-GWAS to perform a GWAS of bone mineral density derived from dual-energy X-ray absorptiometry imaging at 14 skeletal sites, identifying 89 new loci and revealing skeletal site-specific genetic architecture. Our framework offers a robust analytic solution for future ML-assisted GWAS.


Conflict of interest statement

Competing interests

The authors declare no competing interests.

Figures

Fig. 1
Fig. 1. Pervasive false positive associations in the GWAS on imputed T2D.
(a) Venn diagram comparing the number of independent loci (P < 5e-8) identified by GWAS of imputed and ground truth T2D (b) The chart displays an example for how a false positive SNP in the GWAS on imputed T2D may be involved in glycemic and erythrocytic pathways which lead to T2D and HbA1c associations. SNPs can have false positive associations with imputed T2D due to their effects on HbA1c through erythrocytic pathways. (c) Estimated effects of four SNPs on T2D, HbA1c, glycemic traits, and erythrocytic traits. The vertical dashed line at 0 serves as a reference for no effect. Error bars show the 95% confidence intervals (CI) of the estimated GWAS effect, with the sample size ranges from 45,268 to 898,130. The DIAMENTE-T2D is the largest T2D case-control GWAS to date. Abbreviations: 2hGlu (2-h glucose after an oral glucose challenge), HC (haemoglobin concentration), MCH (mean corpuscular haemoglobin), MCHC (mean corpuscular haemoglobin concentration), MCV (mean corpuscular volume), PCV (haematocrit percentage), RBC (red blood cell count).
Fig. 2
Fig. 2. Comparison of POP-GWAS and a conventional design for ML-assisted GWAS
(a) A conventional design performs GWAS on the imputed phenotype using unlabeled samples. (b) POP-GWAS imputes the phenotype in both labeled and unlabeled samples, and performs three GWAS: GWAS of the observed and imputed phenotype in labeled samples, and GWAS on the imputed phenotype in unlabeled samples. Then, summary statistics of these three GWAS are used to obtain POP-GWAS estimates.
Fig. 3
Fig. 3. Simulation results.
This figure compares POP-GWAS, GWAS of the observed phenotype in labeled data, and GWAS of the imputed phenotype in unlabeled data. (a) Point estimation for SNP effects. The red dashed line represents the true effect sizes. The center of the box plot represents the median, the upper and lower bounds of the box are the 75th and 25th percentiles, and the whiskers are the 5th to the 95th percentile of the estimates across 103 simulation replicates. (b) QQ plot of P-value under the null (i.e., no SNP effects). (c) Type-I error under different imputation r2. (d) Statistical power under different true effect sizes. (e) Statistical power under different imputation r2. (f) Statistical power under different sample size ratio between unlabeled and labeled data. The p-values in (b)-(f) are calculated from two-sided Wald test.
Fig. 4
Fig. 4. Effective sample size calculation for ML-assisted GWAS
(a) For a dataset comprising 90% unlabeled data, the graph illustrates the relationship between the ratio of the effective sample to the total sample size (Y-axis) and the imputation r2 of various ML algorithms (X-axis). (b) For algorithms with an imputation r2 of 0.5, the graph depicts the efficiency gain, represented by the ratio of the effective sample size to the labeled sample size (Y-axis), against the increase in unlabeled sample collection, represented by the ratio of the unlabeled sample size to the labeled sample size. There is an upper bound for the effective sample size given a fixed imputation r2.
Fig. 5
Fig. 5. POP-GWAS for DXA-BMD across 14 skeletal sites.
(a) Manhattan plot for DXA-BMD POP-GWAS. Red dots represent the loci only found in POP-GWAS, but not in conventional GWAS (yellow dots) of observed DXA-BMD. The P-value displayed for each SNP is the smallest P-value across 14 sites. P-value is calculated using two-sided Wald test. (b) The number of genome-wide significant loci (P < 1.4e-8) identified for each skeletal site based on conventional GWAS and POP-GWAS. (c) Genetic correlation between BMD GWAS and 40 complex traits. The color represents the point estimates. The size of the square represents the P-value, with larger squares indicating smaller P-values. Full square with asterisk highlights significant genetic correlations after Bonferroni correction (P < 0.05/3.5/40 = 3.6e-4). Larger squares correspond to more significant P-value. Femoral neck BMD 1 and 2 represent two different GWAS on the same phenotype (Supplementary Table 10). We use similar labels for lumbar spine and fracture studies. P-value is calculated using two-sided Wald test.
Fig. 6
Fig. 6. LGR5 as a head-specific GWAS signal.
(a) Effects of rs12308154-G (LGR5) on DXA-BMD across 14 sites in UKB. The error bars represent the 95% CI for the estimated GWAS effects. The GWAS sample size ranges from 44,267 to 60,829 across 14 sites. (b) Associations at the LGR5 locus from head DXA-BMD meta-analysis. P-value is calculated using two-sided Wald test.

Similar articles

Cited by

References

    1. Uffelmann E et al. Genome-wide association studies. Nature Reviews Methods Primers 1, 59 (2021).
    1. Dahl A et al. Phenotype integration improves power and preserves specificity in biobank-based genetic studies of major depressive disorder. Nature Genetics (2023). - PMC - PubMed
    1. An U et al. Deep learning-based phenotype imputation on population-scale biobank data increases genetic discoveries. Nature Genetics (2023). - PMC - PubMed
    1. Burstein D et al. Genome-wide analysis of a model-derived binge eating disorder phenotype identifies risk loci and implicates iron metabolism. Nature Genetics 55, 1462–1470 (2023). - PMC - PubMed
    1. Cosentino J et al. Inference of chronic obstructive pulmonary disease with deep learning on raw spirograms identifies new genetic loci and improves risk models. Nature Genetics, 1–9 (2023). - PubMed

Methods-only references

    1. Bulik-Sullivan B et al. An atlas of genetic correlations across human diseases and traits. Nature Genetics 47, 1236–1241 (2015). - PMC - PubMed
    1. Willer CJ, Li Y & Abecasis GR. METAL: fast and efficient meta-analysis of genomewide association scans. Bioinformatics 26, 2190–2191 (2010). - PMC - PubMed
    1. Medina-Gomez C et al. Life-course genome-wide association study meta-analysis of total body BMD and assessment of age-specific effects. The American Journal of Human Genetics 102, 88–102 (2018). - PMC - PubMed
    1. Bulik-Sullivan BK et al. LD Score regression distinguishes confounding from polygenicity in genome-wide association studies. Nature genetics 47, 291–295 (2015). - PMC - PubMed
    1. Wallace C. Eliciting priors and relaxing the single causal variant assumption in colocalisation analyses. PLoS genetics 16, e1008720 (2020). - PMC - PubMed

LinkOut - more resources