. 2024 Sep 30;7(1):1219.
doi: 10.1038/s42003-024-06932-w.

Low protein diet protects the liver from Salmonella Typhimurium-mediated injury by modulating the mTOR/autophagy axis in macrophages

Affiliations

Low protein diet protects the liver from Salmonella Typhimurium-mediated injury by modulating the mTOR/autophagy axis in macrophages

Edyta E Wojtowicz et al. Commun Biol. .

Abstract

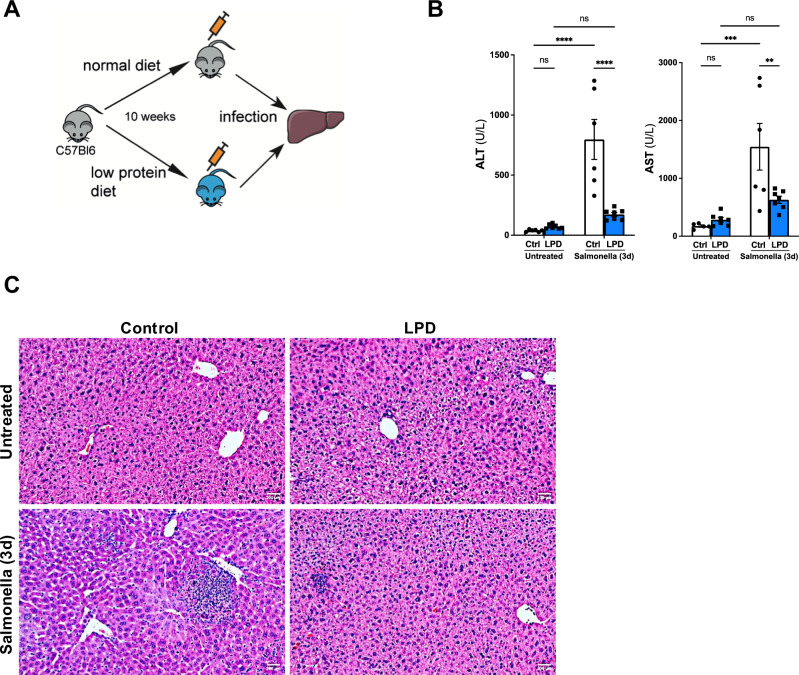
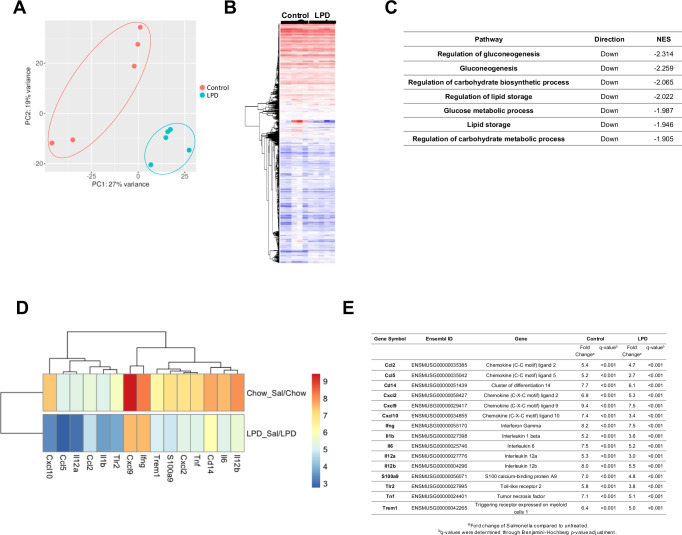
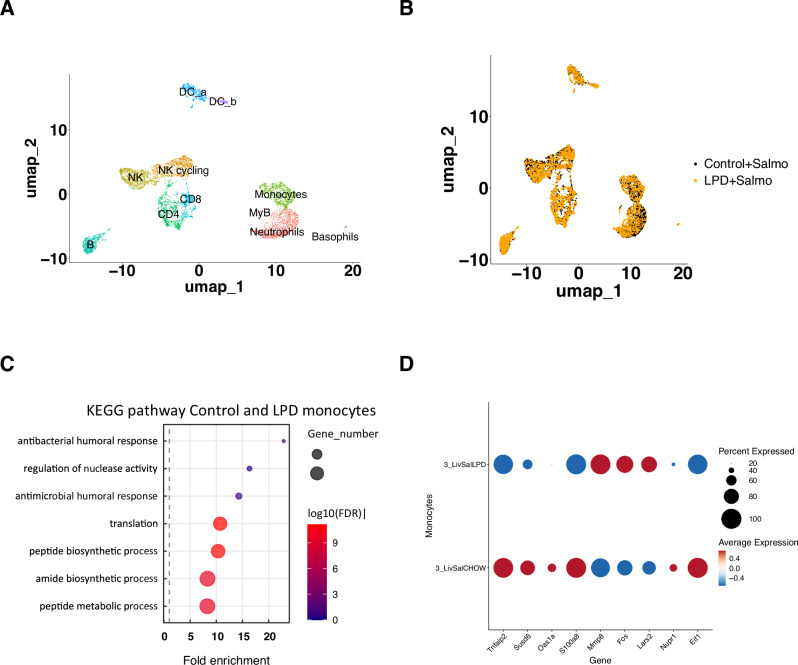
Western diets are the underlying cause of metabolic and liver diseases. Recent trend to limit the consumption of protein-rich animal products has become more prominent. This dietary change entails decreased protein consumption; however, it is still unknown how this affects innate immunity. Here, we studied the influence of a low protein diet (LPD) on the liver response to bacterial infection in mice. We found that LPD protects from Salmonella enterica serovar Typhimurium (S. Typhimurium)-induced liver damage. Bulk and single-cell RNA sequencing of murine liver cells showed reduced inflammation and upregulation of autophagy-related genes in myeloid cells in mice fed with LPD after S. Typhimurium infection. Mechanistically, we found reduced activation of the mammalian target of rapamycin (mTOR) pathway, whilst increased phagocytosis and activation of autophagy in LPD-programmed macrophages. We confirmed these observations in phagocytosis and mTOR activation in metabolically programmed human peripheral blood monocyte-derived macrophages. Together, our results support the causal role of dietary components on the fitness of the immune system.


Conflict of interest statement

The authors declare no competing interests. Robert A. Kingsley is an Editorial Board Member for Communications Biology, but was not involved in the editorial review of, nor the decision to publish this article.

Figures

Fig. 1
Fig. 1. Low protein diet feeding limits S. Typhimurium induced liver damage in vivo.
A Experimental set up scheme. B Quantification of the serum levels of alanine aminotransferase (ALT) (Control diet after Salmonella vs LPD after Salmonella p < 0.0001; Ctrl untreated vs Ctrl Salmonella p < 0.0001; applied two-way ANOVAtest) and aspartate aminotransferase (AST) (Control diet after Salmonella vs LPD after Salmonella p = 0.0031; Ctrl untreated vs Ctrl Salmonella p < 0.0002; applied two-way ANOVA test) in animals fed with a normal or low protein diet (LPD) for 10 weeks and 3 days after S. Typhimurium infection. C H&E staining in liver sections obtained from control and LPD fed mice infected with S. Typhimurium. Arrows point to necrotic areas. Analyses were done from n = 5–8 mice. Results shown are representative from 3 independent experiments. Representative microscopic images are shown from 20x magnification. Values are mean ± SEM.
Fig. 2
Fig. 2. Bulk RNA sequencing of liver samples showing diet induced metabolic reprogramming and anti-inflammatory changes.
A Principal component analysis (PCA) plot on raw gene count data for first and second component in normal and LPD liver samples infected with S. Typhimurium. B Heatmap of raw gene count data between treatment groups; Control vs LPD. C Table including pathway analysis using Gene Ontology (GO) database. the normalised enrichment score (NES) is generated from this analysis and indicates the distribution of gene ontology categories/gene sets across a list of ranked genes; a positive NES indicates an increase in the gene set, and a negative NES represents a decrease in the gene set. D Heat map showing fold change (Log2FC) of immune-related genes in normal and LPD and (E) associated statistical analyses of the genes shown. All q-value were <0.001; q-values were determined through Benjamini-Hochberg p-value adjustment.
Fig. 3
Fig. 3. Single cell RNA sequencing on immune cells isolated from livers after infection.
A UMAP representing cell types present among liver immune cells in normal and LPD fed animals after S. Typhimurium infection. B UMAP representing the cell type distribution in samples from animals fed normal and LPD diets. C KEGG analysis of pathways enriched in normal and LPD fed diets highlighting the metabolic remodelling of monocytes and enrichment for innate immune response genes in LPD-derived monocytes. D Dot plot representing differentially expressed genes between monocytes from normal and LPD diet calculated using differential expression (DE) testing based on the non-parametric Wilcoxon rank sum test included in Seurat package and Bonferroni correction for multiple testing.
Fig. 4
Fig. 4. Low-aa culture media inhibits mTOR and activates LC-3 dependent autophagy in BMDM in response to LPS in vitro.
A Experimental set up. B Representative histogram depicting decreased MFI of pS6K kinase level in Low-aa media programmed BMDM’s compared to normal media. C Quantification of pS6 kinase level upon LPS treatment of BMDM’s from normal or Low-aa media, applied two-way ANOVA with Sidak’s multiple comparisons test, p = 0.0015. D qPCR expression analysis of Nlrp3, Il1b and HIF1a; Ctrl vs Low-aa after LPS p = 0.0014, p < 0.0001, p = 0.0467 respectively, Two-Way ANOVA with Sidak’s multiple comparisons in BMDM. E Representative images of immunofluorescence staining for LC3 and further (F) quantification in control and low-aa media; Ctrl vs Low-aa p < 0.001, Ctrl vs Ctrl+LPS p = 0.003, Low-aa vs Low-aa+LPS p < 0.002, Ctrl+LPS vs Low-aa+LPS p < 0.001, Kruskal–Wallis test. Representative images are shown from 63x magnification. In vitro experiments were repeated 2-3x with n = 3–4 replicates. Values are mean ± SEM.
Fig. 5
Fig. 5. Supplementation with leucine diminishes LPD-mediated protection from liver damage upon S.
Typhimurium infection via BMDM metabolic reprogramming. A In vivo experimental set up. B Intracellular FACS staining for pS6 kinase in primary bone marrow F4/80+ macrophages stimulated ex vivo 60 min with LPS and quantification of pS6 kinase MFI, unpaired Student t-test, two-tailed, p = 0.03. C Serum level of ALT (Ctrl vs LPD p = 0.028; LPD vs Leu+LPD p = 0.181; Ctrl vs Leu+LPD p = 0.030, Brown-Forsythe and Welch ANOVA test) and AST (Ctrl vs LPD p = 0.0122; Ctrl vs Leu+LPD n.s.; LPD vs Leu+LPD p = 0.0005, Brown-Forsythe and Welch ANOVA test) and (D) H&E staining on liver sections from LPD and LPD+Leu fed mice, 3 days after S. Typhimurium. E In vitro experimental set up for BMDM. F Quantification of intracellular FACS staining for pS6 kinase in BMDM with control, Low-aa or Low-aa+Leu media, Non-stimulated: Ctrl vs Low-aa+Leu p = 0.01; 30 min after LPS: Ctrl vs Low-aa p < 0.001, Low-aa vs Low-aa+Leu p < 0.001, One-Way ANOVA with Tukey’s multiple comparisons test. G Immunofluorescence (IF) staining for LC3 puncta and (H) further quantification of per BMDM; Ctrl vs Low-aa p < 0.001, Low-aa vs Low-aa+Leu n.s., Ctrl+LPS vs Low-aa+LPS p < 0.001, Low-aa+LPS vs Low-aa+Leu+LPS p < 0.001, Kruskal–Wallis test. I IF for LC3 (green) and pHrodo E. coli beads (red) and (J) further quantification ***p < 0.001 at 2 h after LPS. H, J One-Way ANOVA, Kruskal–Wallis test with Dunns correction Results shown are representative from 2 independent experiments. Representative microscopic images are shown from 63x magnification. Values are mean ± SEM.

References

    1. Childs, C. E., Calder, P. C. & Miles, E. A. Diet and Immune Function. Nutrients11, 1933 (2019). - PMC - PubMed
    1. Schulze, M. B., Martinez-Gonzalez, M. A., Fung, T. T., Lichtenstein, A. H. & Forouhi, N. G. Food based dietary patterns and chronic disease prevention. BMJ361, k2396 (2018). - PMC - PubMed
    1. Christ, A. et al. Western diet triggers NLRP3-dependent innate immune reprogramming. Cell172, 162–175.e114 (2018). - PMC - PubMed
    1. Cildir, G., Akincilar, S. C. & Tergaonkar, V. Chronic adipose tissue inflammation: all immune cells on the stage. Trends Mol. Med.19, 487–500 (2013). - PubMed
    1. Netea, M. G. et al. Trained immunity: A program of innate immune memory in health and disease. Science352, aaf1098 (2016). - PMC - PubMed

Substances

LinkOut - more resources