. 2024 Oct;56(10):2216-2230.
doi: 10.1038/s12276-024-01318-8. Epub 2024 Oct 1.

Renal fibroblasts are involved in fibrogenic changes in kidney fibrosis associated with dysfunctional telomeres

Affiliations

Renal fibroblasts are involved in fibrogenic changes in kidney fibrosis associated with dysfunctional telomeres

Sarita Saraswati et al. Exp Mol Med. 2024 Oct.

Erratum in

Abstract

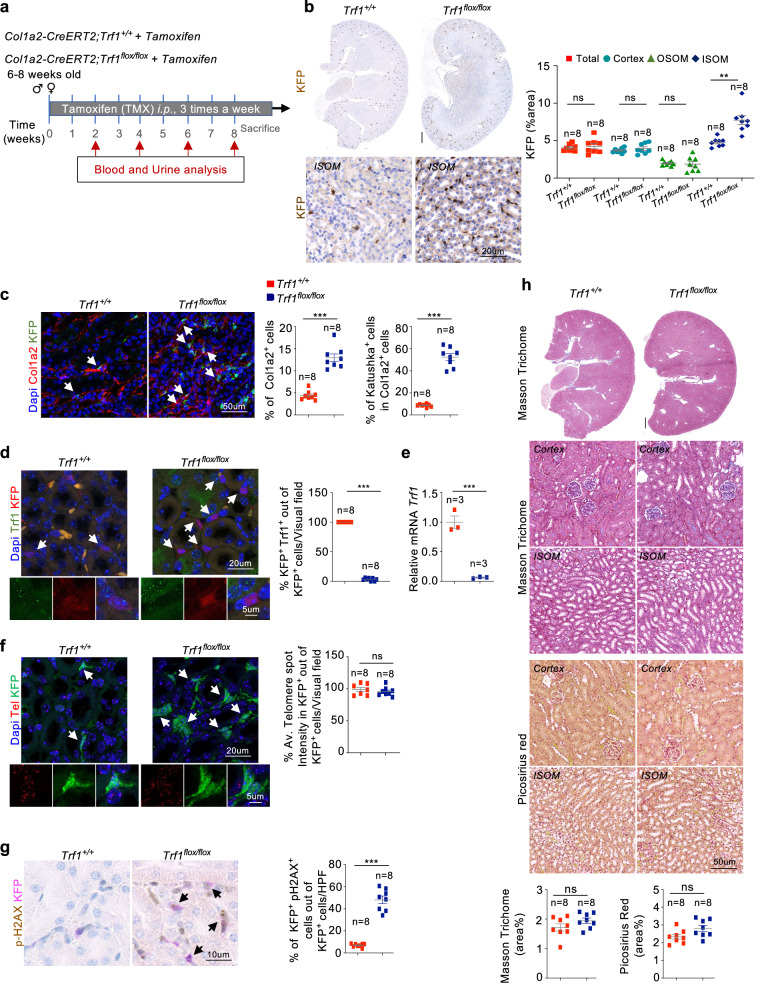
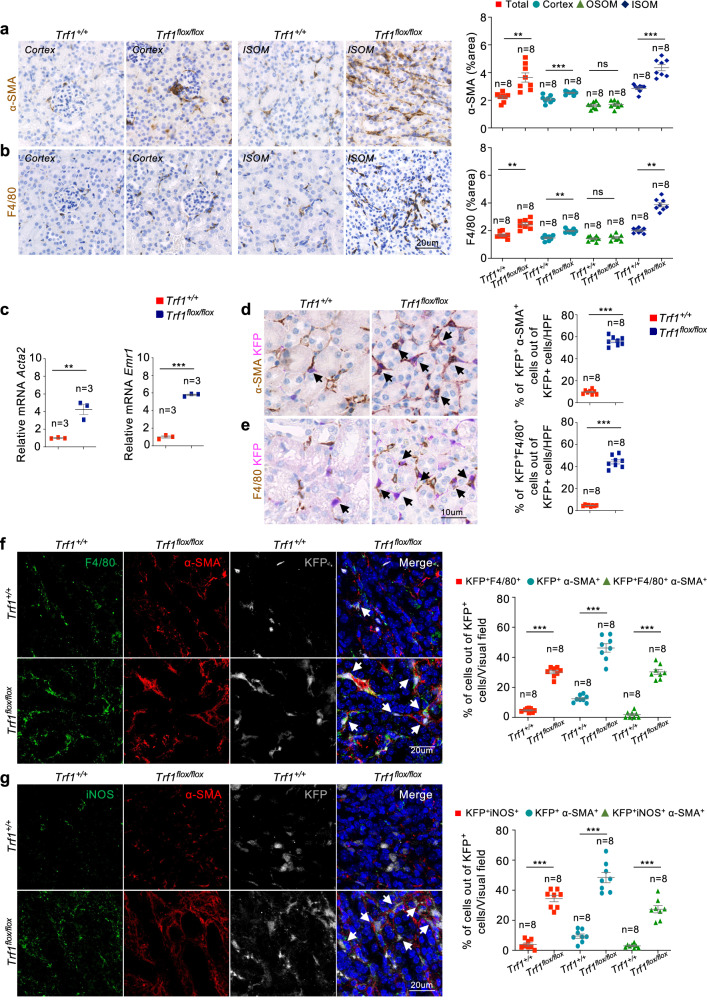
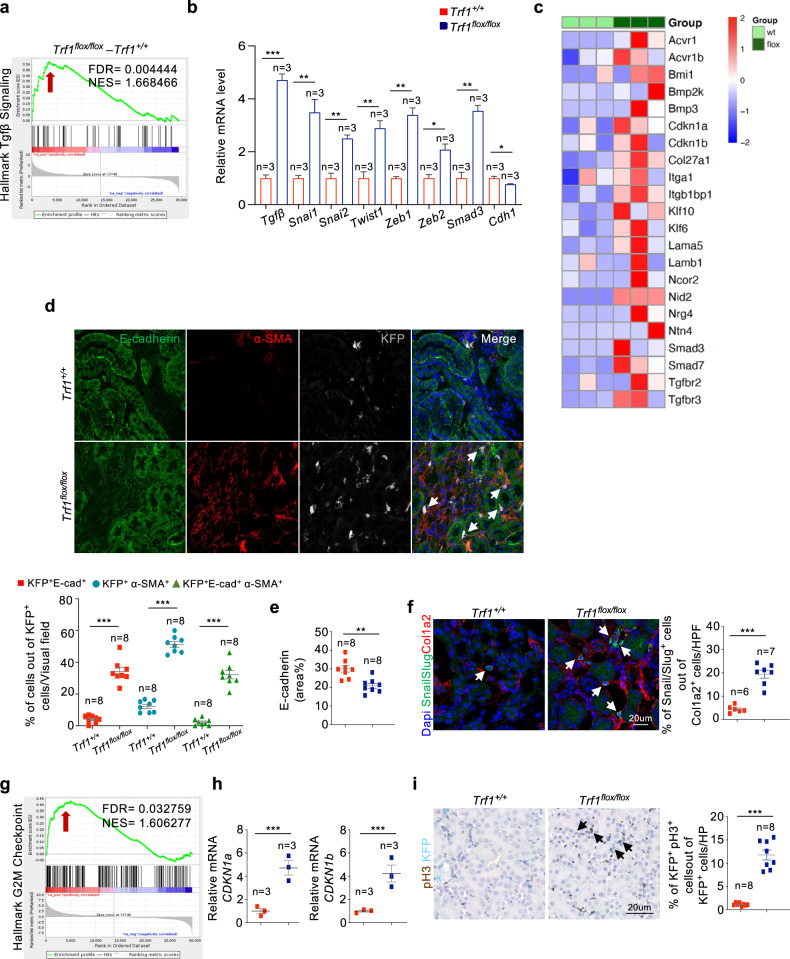
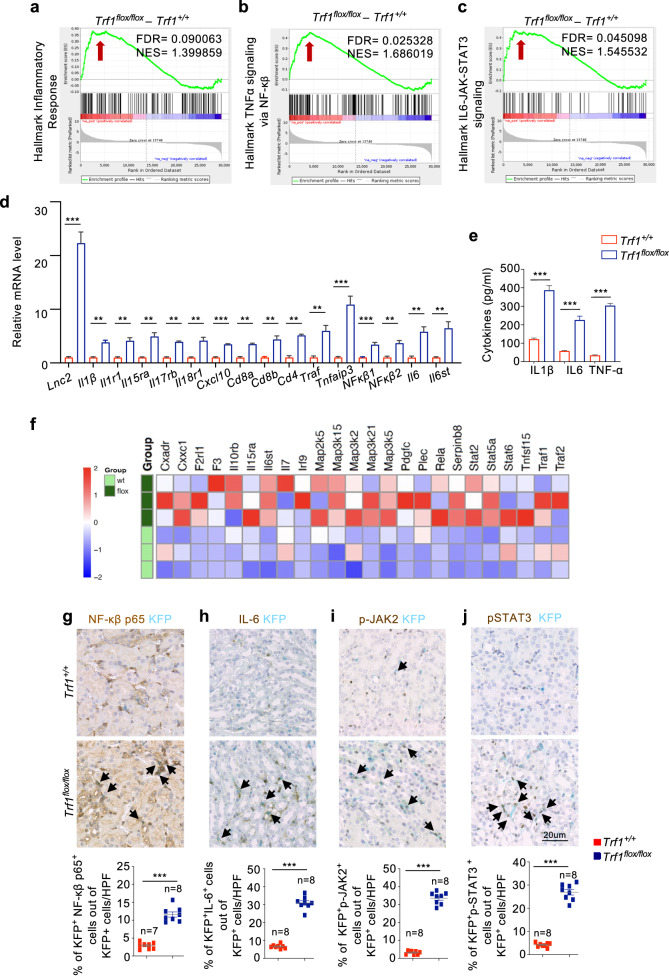
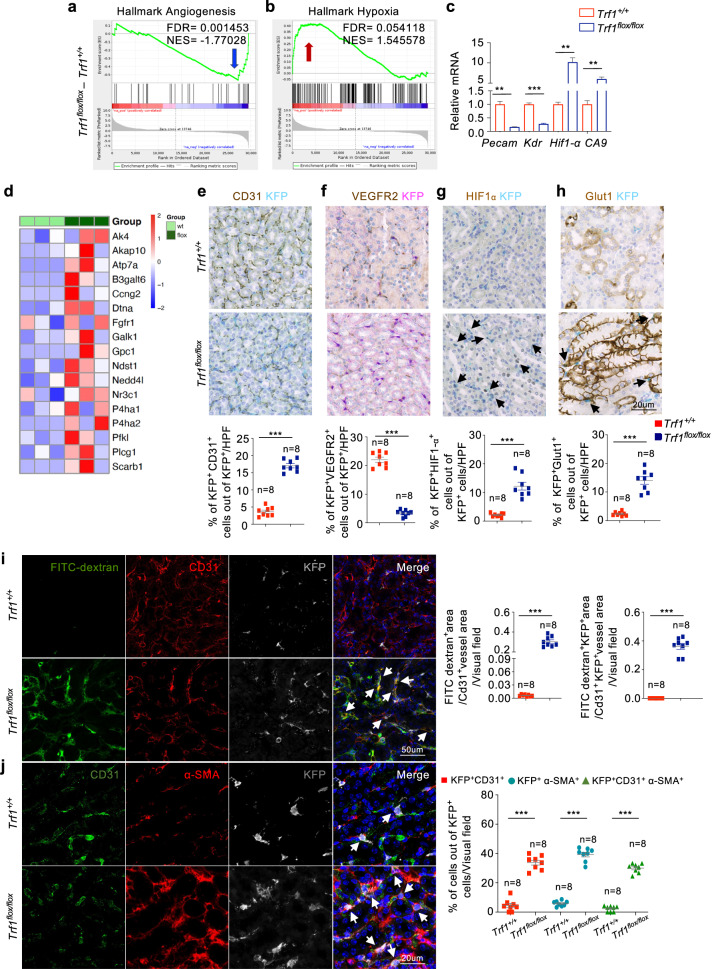
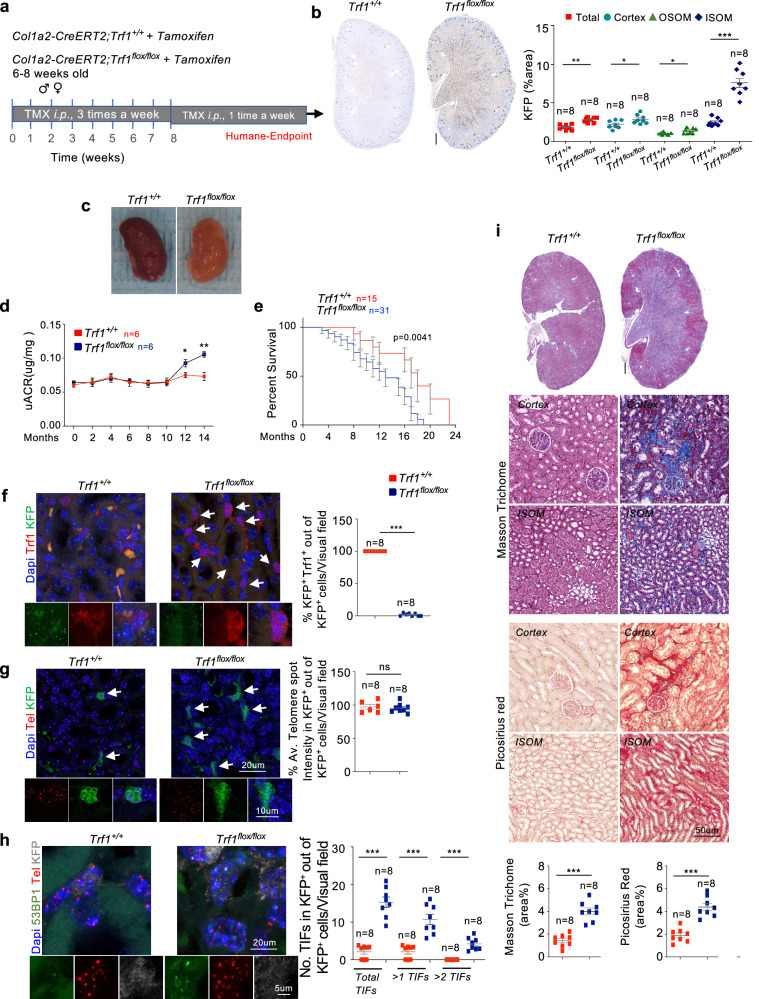
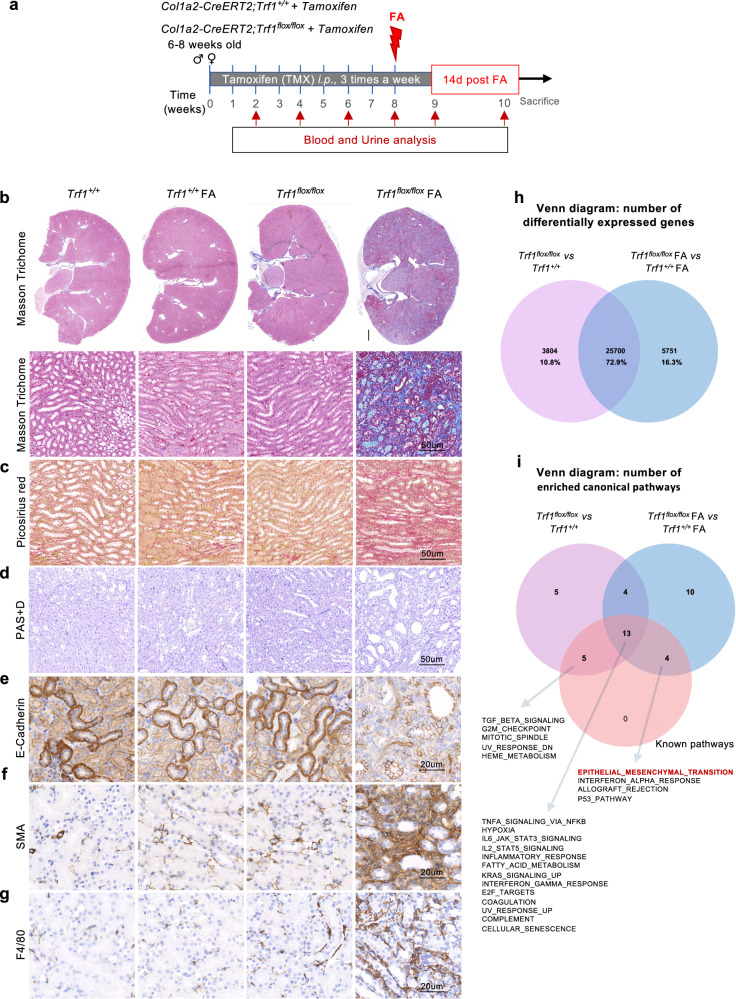
Tubulointerstitial fibrosis associated with chronic kidney disease (CKD) represents a global health care problem. We previously reported that short and dysfunctional telomeres lead to interstitial renal fibrosis; however, the cell-of-origin of kidney fibrosis associated with telomere dysfunction is currently unknown. We induced telomere dysfunction by deleting the Trf1 gene encoding a telomere-binding factor specifically in renal fibroblasts in both short-term and long-term life-long experiments in mice to identify the role of fibroblasts in renal fibrosis. Short-term Trf1 deletion in renal fibroblasts was not sufficient to trigger kidney fibrosis but was sufficient to induce inflammatory responses, ECM deposition, cell cycle arrest, fibrogenesis, and vascular rarefaction. However, long-term persistent deletion of Trf1 in fibroblasts resulted in kidney fibrosis accompanied by an elevated urinary albumin-to-creatinine ratio (uACR) and a decrease in mouse survival. These cellular responses lead to the macrophage-to-myofibroblast transition (MMT), endothelial-to-mesenchymal transition (EndMT), and partial epithelial-to-mesenchymal transition (EMT), ultimately causing kidney fibrosis at the humane endpoint (HEP) when the deletion of Trf1 in fibroblasts is maintained throughout the lifespan of mice. Our findings contribute to a better understanding of the role of dysfunctional telomeres in the onset of the profibrotic alterations that lead to kidney fibrosis.


Conflict of interest statement

The authors declare no competing interests.

Figures

Fig. 1
Fig. 1. Conditional deletion of Trf1 in fibroblasts.
a Schematic of the experimental approach. b Representative images of immunostaining and quantification of KFP-positive cells (whole kidney, upper panel; magnified view, lower panel) in Trf1+/+ and Trf1flox/flox kidneys. Scale bars, 500 μm. c Representative images of immunofluorescence staining for Col1a2 (red) and KFP (green) and quantification of the Col1a2+ area (whole kidney section) and Col1a2+KFP+ cells (six to eight visual fields) among Col1a2+ cells in Trf1+/+ and Trf1flox/flox kidneys. d Representative images of immunofluorescence staining (six to eight visual fields) for Trf1 (green) and KFP (red) and quantification of the percentage of double KFP+TRF1+ fibroblasts in Trf1+/+ and Trf1flox/flox kidneys. e Relative mRNA expression of Trf1 in Trf1+/+ and Trf1flox/flox kidneys. For all groups, n = 3 mice in each group. f Representative images (six to eight visual fields) of telomeric immuno-qFISH in KFP+ fibroblasts (Cy3Tel probe (red), KFP+ cells (green)) and quantification of the mean telomere spot intensity in Trf1+/+ and Trf1flox/flox kidneys. g Representative images of immunostaining (15–20 visual fields) and quantification of p-H2AX+ KFP+ cells in Trf1+/+ and Trf1flox/flox kidneys. h Representative images (15–20 visual fields) and quantification of Masson’s trichrome and Picrosirius red staining in Trf1+/+ and Trf1flox/flox kidneys. Scale bars, 500 μm. Nuclei are stained with DAPI (blue). The data are presented as the means ± SEMs. An unpaired, two-tailed Student’s t test was used. *p < 0.05, **p < 0.01, and ***p < 0.001. The number of mice analyzed per genotype is n = 8, if not indicated.
Fig. 2
Fig. 2. Deletion of Trf1 in fibroblasts induces fibrogenesis and inflammation coincident with the macrophage-to-mesenchymal transition (MMT).
Representative images of immunostaining (15–20 visual fields) and quantification of a α-SMA and b F4/80 expression in Trf1+/+ and Trf1flox/flox kidneys. c Relative mRNA expression of Acta2 and Emr1 in Trf1+/+ and Trf1flox/flox kidneys. For all groups, n = 3 mice in each group. d Representative images of immunostaining (15–20 visual fields) and quantification of (d) α-SMA+KFP+ and (e) F4/80+KFP+ cells in Trf1+/+ and Trf1flox/flox kidneys. f Representative images (six to eight visual fields) and quantification of immunolabeling for F4/80, α-SMA and KFP in Trf1+/+ and Trf1flox/flox kidneys. g Representative images (six to eight visual fields) and quantification of immunolabeling for iNOS, α-SMA and KFP in Trf1+/+ and Trf1flox/flox kidneys. Nuclei are stained with DAPI (blue). The data are presented as the means ± SEMs. An unpaired, two-tailed Student’s t test was used. *p < 0.05, **p < 0.01, and ***p < 0.001. The number of mice analyzed per genotype is n = 8, if not indicated.
Fig. 3
Fig. 3. Fibroblast-specific TRF1 deletion upregulates Tgfβ signaling and causes cell cycle arrest at G2/M phase.
a GSEA enrichment plots of the hallmark gene dataset showing the enrichment of Tgfβ signaling in the kidneys of Trf1+/+ and Trf1flox/flox mice. For all groups, n = 3 mice in each group. b Relative mRNA expression of Tgfβ, Snai1, Snai2, Twist1, Zeb1, Zeb2, Smad3 and Cdh1 in the kidneys of Trf1+/+ and Trf1flox/flox mice. For all groups, n = 3 mice in each group. c Heatmap of the RNA-seq results showing differences in the expression of Tgfβ signaling- and fibrosis-related genes in the kidneys of Trf1+/+ and Trf1flox/flox mice. d Representative images (six to eight visual fields) and quantification of immunolabeling for E-cadherin, α-SMA and KFP in Trf1+/+ and Trf1flox/flox kidneys. e Quantification of E-cadherin expression in the kidneys of Trf1+/+ and Trf1flox/flox mice. For all groups, n = 3 mice in each group. f Representative images (six to eight visual fields) and quantification of immunolabeling for Snail/Slug and Col1a2 in Trf1+/+ and Trf1flox/flox kidneys. Nuclei are stained with DAPI (blue). Trf1+/+ mice n = 6; Trf1flox/flox mice n = 7. g GSEA enrichment plots of the hallmark gene dataset showing the enrichment of the G2/M checkpoint in the kidneys of Trf1+/+ and Trf1flox/flox mice. For all groups, n = 3 mice in each group. h Relative mRNA expression of Cdkn1a and Cdkn1b in the kidneys of Trf1+/+ and Trf1flox/flox mice. For all groups, n = 3 mice in each group. i Representative images of immunostaining (15–20 visual fields) and quantification of pH3+KFP+ cells in Trf1+/+ and Trf1flox/flox kidneys. Nuclei are stained with DAPI (blue). The data are presented as the means ± SEMs. An unpaired, two-tailed Student’s t test was used. *p < 0.05, **p < 0.01, and ***p < 0.001. The number of mice analyzed per genotype is n = 8, if not indicated.
Fig. 4
Fig. 4. Fibroblast-specific deletion of Trf1 increases inflammation.
GSEA enrichment plots of the hallmark gene dataset revealed the enrichment of (a) the inflammatory response, b TNFα signaling via NF-κβ, and c IL6-JAK-STAT3 signaling in the kidneys of Trf1+/+ and Trf1flox/flox mice. For all groups, n = 3 mice in each group. d Relative mRNA expression of Lnc2, IL1β, IL1r1, IL15rα, IL17rb, IL18r1, Cxcl10, Cd8a, Cd8b, Cd4, Traf1, Tnfaip3, NF-κβ1, NF-κβ2, IL6 and IL6st in the kidneys of Trf1+/+ and Trf1flox/flox mice. For all groups, n = 3 mice in each group. e ELISAs of IL-1β, IL6 and TNFα levels in the kidneys of Trf1+/+ and Trf1flox/flox mice. For all groups, n = 3 mice in each group. f Heatmap of the RNA-seq results showing differences in the expression of inflammatory genes and genes in associated targeted pathways in the kidneys of Trf1+/+ and Trf1flox/flox mice. Representative images of immunostaining (15–20 visual fields) and quantification of (g) NF-κβ p65+KFP+, (h) IL6+KFP+, (i) p-JAK2+KFP+, and (j) p-STAT3+KFP+ cells in the kidneys of Trf1+/+ and Trf1flox/flox mice. The data are presented as the means ± SEMs. An unpaired, two-tailed Student’s t test was used. *p < 0.05, **p < 0.01, and ***p < 0.001. The number of mice analyzed per genotype is n = 8, if not indicated.
Fig. 5
Fig. 5. Fibroblast-specific deletion of Trf1 induces capillary rarefaction, the EndoMT and hypoxia.
GSEA enrichment plots of the hallmark gene dataset showed decreases in (a) angiogenesis and (b) hypoxia in the kidneys of Trf1+/+ and Trf1flox/flox mice. For all groups, n = 3 mice in each group. c Relative mRNA expression of Pecam1, Kdr, HIF-1α and CA9 in the kidneys of Trf1+/+ and Trf1flox/flox mice. For all groups, n = 3 mice in each group. d Heatmap of the RNA-seq results showing differences in the expression of angiogenesis- and hypoxia-related genes in the kidneys of the Trf1+/+ and Trf1flox/flox mice. Representative images of immunostaining (15–20 visual fields) and quantification of (e) CD31+KFP+, (f) Vegfr2+KFP+, (g) HIF-1α+ and KFP+, and (h) Glut1+ and KFP+ cells in the Trf1+/+ and Trf1flox/flox kidneys. i Representative images (six to eight visual fields) and quantification of immunolabeling for FITC-dextran, CD31 and KFP in Trf1+/+ and Trf1flox/flox kidneys. j Representative images (six to eight visual fields) and quantification of immunolabeling for CD31, α-SMA and KFP in Trf1+/+ and Trf1flox/flox kidneys. Nuclei are stained with DAPI (blue). The data are presented as the means ± SEMs. An unpaired, two-tailed Student’s t test was used. *p < 0.05, **p < 0.01, and ***p < 0.001. The number of mice analyzed per genotype is n = 8, if not indicated.
Fig. 6
Fig. 6. Persistent long-term fibroblast-specific deletion of Trf1 induces kidney fibrosis at the HEP.
a Schematic of the experimental approach. b Representative images of immunostaining and quantification of KFP-positive cells (whole kidney, upper panel; magnified view, lower panel) in Trf1+/+ and Trf1flox/flox kidneys. Scale bars, 500 μm. c Macroscopic appearance of the kidneys from Trf1+/+ and Trf1flox/flox mice. d Analysis of the urinary albumin-to-creatinine ratio (UACR), n = 6 mice per group. e Kaplan–Meier survival curves of Trf1+/+ mice (n = 15) and Trf1flox/flox mice (n = 31). f Representative images of immunofluorescence (six to eight visual fields) staining for Trf1 (green) and KFP (red) and quantification of the percentage of double KFP+TRF1+ fibroblasts in Trf1+/+ and Trf1flox/flox kidneys. g Representative images of telomeric immuno-q-FISH in KFP+ fibroblasts (Cy3Tel probe (red) and KFP+ cells (green)) and quantification of the mean telomere spot intensity in Trf1+/+ and Trf1flox/flox kidneys. h Representative images of telomere-induced foci (TIFs) in 53BP1 (green) and telomeres (red) and quantification of TIFs in KFP+ cells in Trf1+/+ and Trf1flox/flox kidneys. i Representative images (15–20 visual fields) and quantification of Masson’s trichrome and Picrosirius red staining in Trf1+/+ and Trf1flox/flox kidneys. Scale bars, 500 μm. Nuclei are stained with DAPI (blue). The data are presented as the means ± SEMs. An unpaired, two-tailed Student’s t test was used. *p < 0.05, **p < 0.01, and ***p < 0.001. The number of mice analyzed per genotype is n = 8, if not indicated.
Fig. 7
Fig. 7. Trf1 depletion exacerbates folic acid-induced fibrosis.
a Schematic of the experimental approach. A single dose of 125 mg kg−1 of body weight FA was administered to Trf1+/+ and Trf1flox/flox mice after tamoxifen administration over an 8-week period. Representative images (15–20 visual fields) of (b) Masson’s trichrome, (c) Picosirius red, (d) PAS + D, (e) E-cadherin, (f) α-SMA, and (g) F4/80 staining in the kidneys of Trf1+/+ and Trf1flox/flox mice that were untreated or treated with FA at a dose of 125 mg kg−1. Scale bars, 500 μm. Venn diagram representing the (h) number of differentially expressed genes and (i) the number of enriched canonical pathways betweenTrf1flox/flox and Trf1+/+ mice, n = 3 mice in each group; between Trf1flox/flox FA-treated and Trf1+/+ FA-treated mice, n = 4 mice in each group; and known pathways.

Similar articles

Cited by

References

    1. Kovesdy, C. P. Epidemiology of chronic kidney disease: an update 2022. Kidney Int. Suppl.12, 7–11 (2022). - PMC - PubMed
    1. Sundström, J. et al. Prevalence, outcomes, and cost of chronic kidney disease in a contemporary population of 2·4 million patients from 11 countries: The CaReMe CKD study. Lancet Reg. Heal—Eur.20, 100438 (2022). - PMC - PubMed
    1. Lovisa, S., Zeisberg, M. & Kalluri, R. Partial epithelial-to-mesenchymal transition and other new mechanisms of kidney fibrosis. Trends Endocrinol. Metab.27, 681–695 (2016). - PubMed
    1. Humphreys, B. D. Mechanisms of renal fibrosis. Annu. Rev. Physiol.80, 309–326 (2018). - PubMed
    1. Kuppe, C. et al. Decoding myofibroblast origins in human kidney fibrosis. Nature589, 281–286 (2021). - PMC - PubMed

Substances

LinkOut - more resources