

Single-cell analysis of preimplantation embryonic development in guinea pigs
- PMID: 39350018
- PMCID: PMC11440810
- DOI: 10.1186/s12864-024-10815-z
Single-cell analysis of preimplantation embryonic development in guinea pigs
Abstract
Background: Guinea pigs exhibit numerous physiological similarities to humans, yet the details of their preimplantation embryonic development remain largely unexplored.
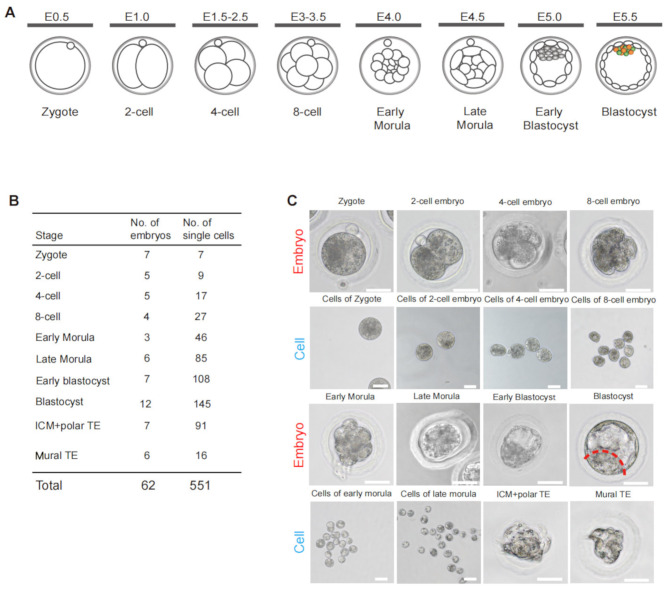
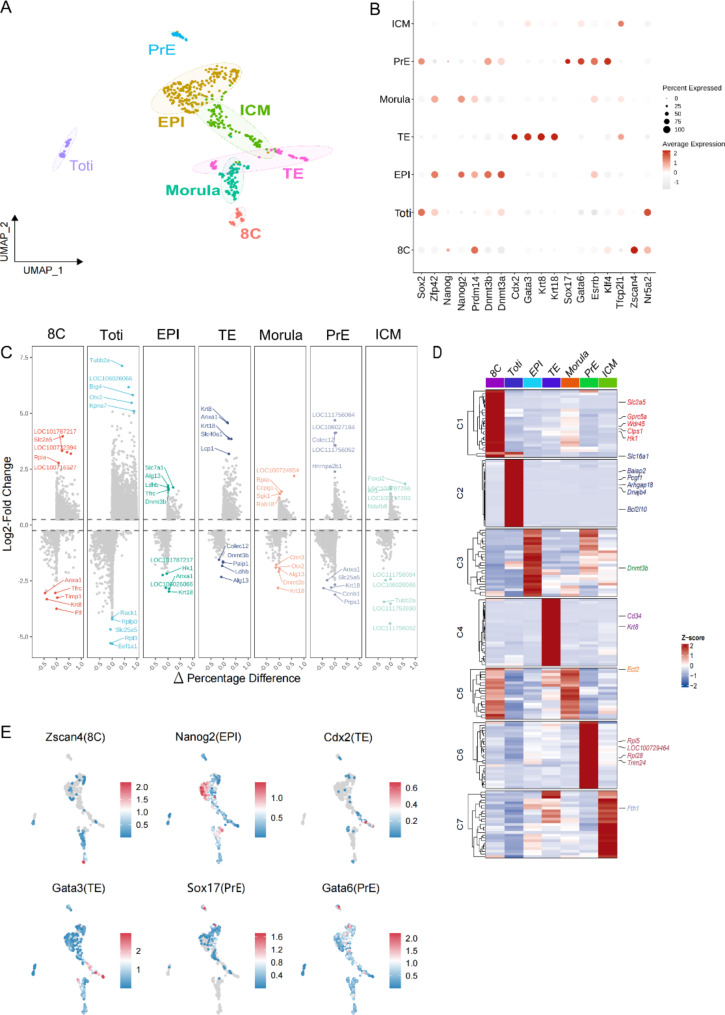
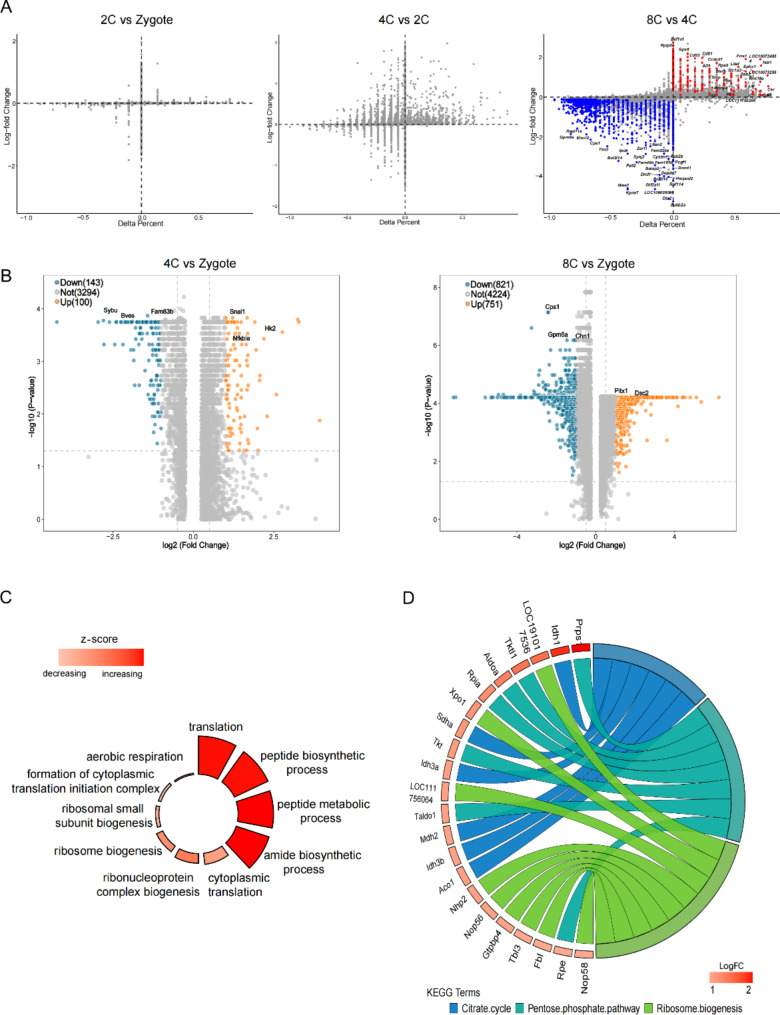
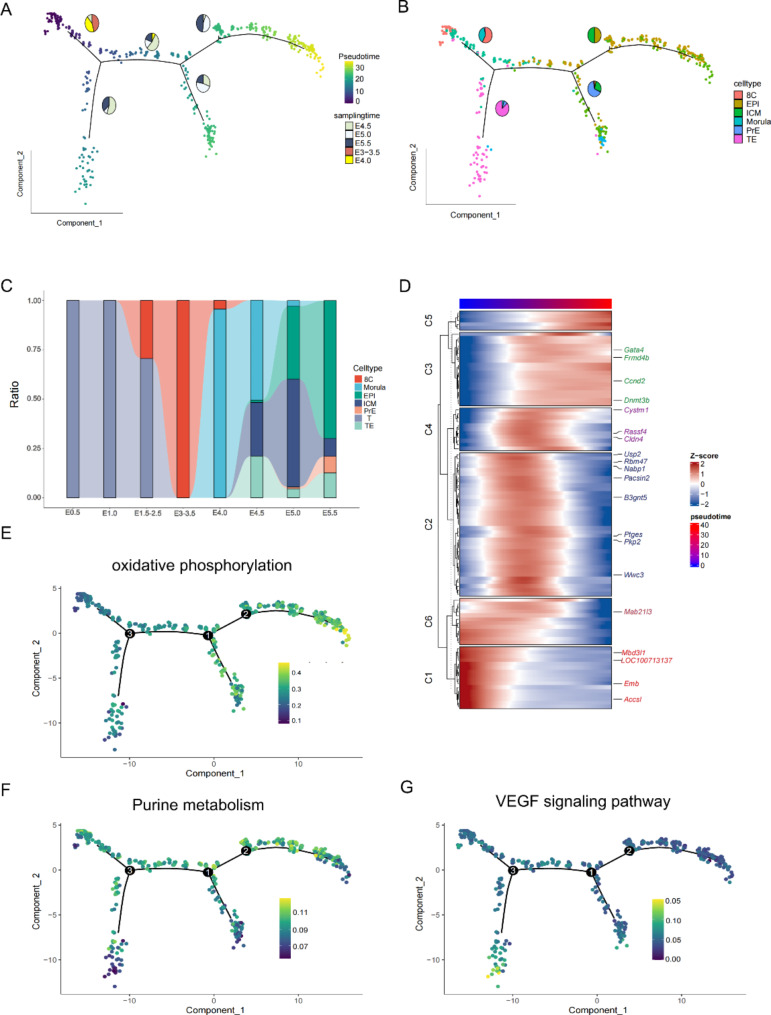
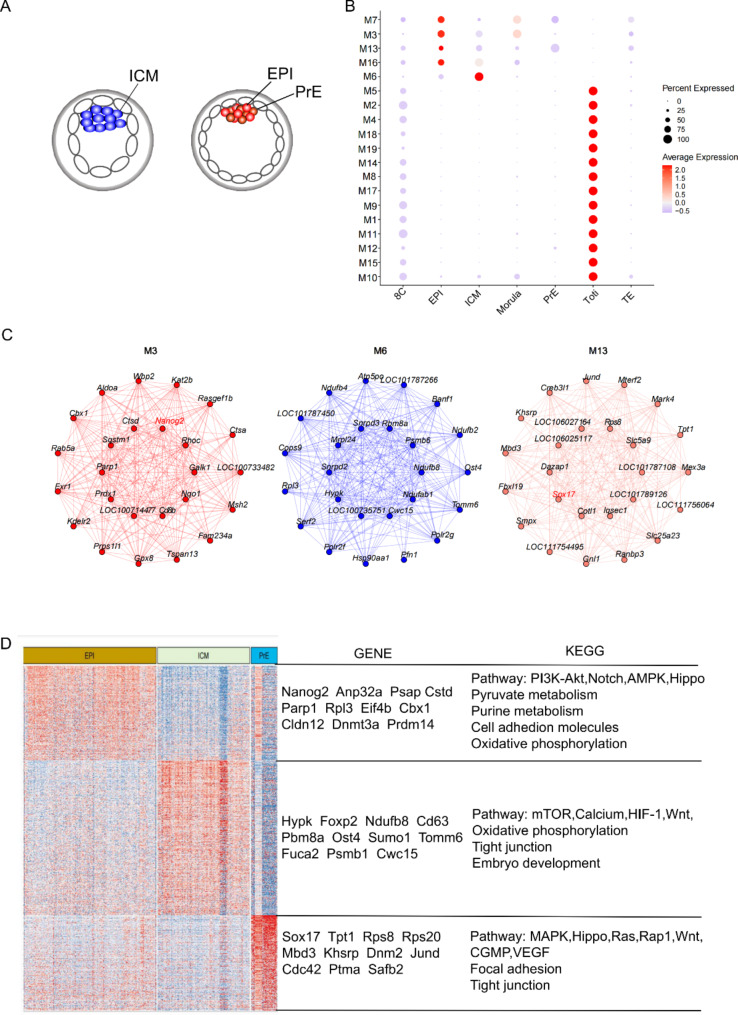
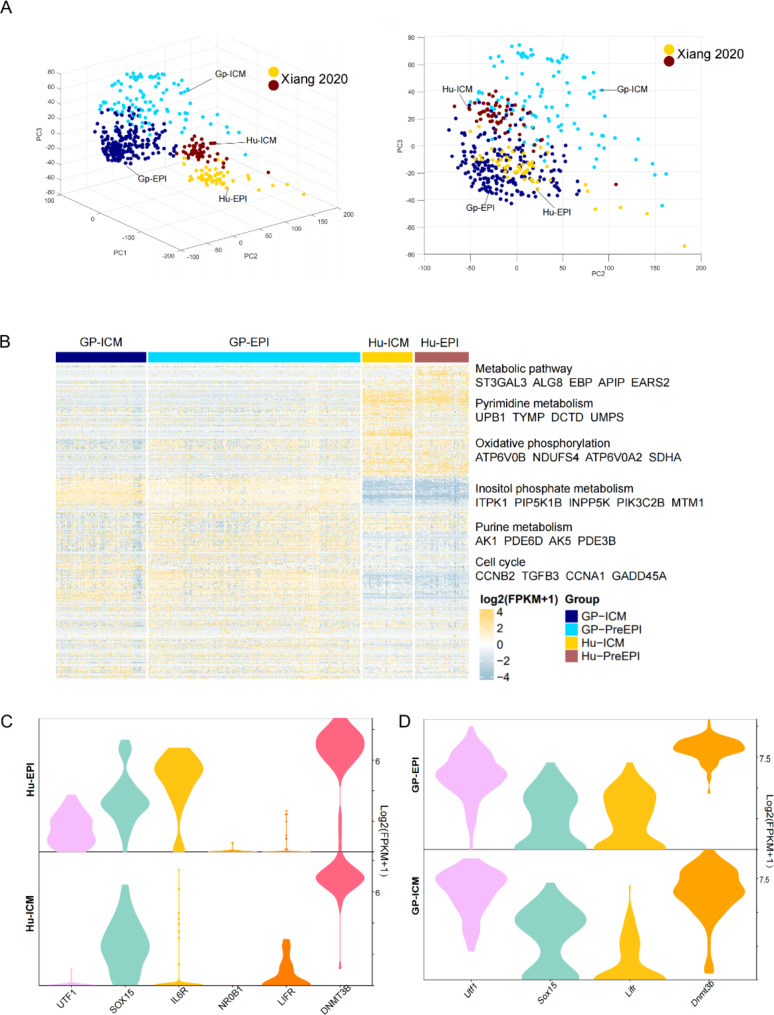
Results: To address this, we conducted single-cell sequencing on the transcriptomes of cells isolated from the zygote stage through preimplantation stages in guinea pigs. This study identified seven distinct cell types within guinea pig preimplantation embryos and pinpointed the timing of zygotic gene activation (ZGA). Trajectory analysis revealed a bifurcation into two lineage-specific branches, accompanied by alterations in specific pathways, including oxidative phosphorylation and vascular endothelial growth factor (VEGF). Additionally, co-expressed gene network analysis highlighted the most enriched functional modules for the epiblast (EPI), primitive endoderm (PrE), and inner cell mass (ICM). Finally, we compared the similarities and differences between human and guinea pig epiblasts (EPIs).
Conclusion: This study systematically constructs a cell atlas of guinea pig preimplantation embryonic development, offering fresh insights into mammalian embryonic development and providing alternative experimental models for studying human embryonic development.
Keywords: Early embryonic development; Guinea pigs; Single-cell sequencing.
© 2024. The Author(s).
Conflict of interest statement
The authors declare no competing interests.
Figures
Similar articles
-
Does mouse embryo primordial germ cell activation start before implantation as suggested by single-cell transcriptomics dynamics?Mol Hum Reprod. 2016 Mar;22(3):208-25. doi: 10.1093/molehr/gav072. Epub 2016 Jan 5. Mol Hum Reprod. 2016. PMID: 26740066
-
Lineage segregation in human pre-implantation embryos is specified by YAP1 and TEAD1.Hum Reprod. 2023 Aug 1;38(8):1484-1498. doi: 10.1093/humrep/dead107. Hum Reprod. 2023. PMID: 37295962
-
The guinea pig serves as an alternative model to study human preimplantation development.Nat Cell Biol. 2025 Apr;27(4):696-710. doi: 10.1038/s41556-025-01642-9. Epub 2025 Apr 4. Nat Cell Biol. 2025. PMID: 40185949 Free PMC article.
-
Cell fate regulation in early mammalian development.Phys Biol. 2012 Aug;9(4):045002. doi: 10.1088/1478-3975/9/4/045002. Epub 2012 Aug 7. Phys Biol. 2012. PMID: 22871593 Review.
-
[Epiblast and primitive endoderm cell specification during mouse preimplantation development: a combination between biology and mathematical modeling].Med Sci (Paris). 2016 Feb;32(2):192-7. doi: 10.1051/medsci/20163202013. Epub 2016 Mar 2. Med Sci (Paris). 2016. PMID: 26936177 Review. French.
Cited by
-
Hallmarks of uterine receptivity predate placental mammals.bioRxiv [Preprint]. 2024 Nov 6:2024.11.04.621939. doi: 10.1101/2024.11.04.621939. bioRxiv. 2024. PMID: 39574771 Free PMC article. Preprint.
References
-
- Gerri C, Menchero S, Mahadevaiah SK, Turner JMA, Niakan KK. Human embryogenesis: a comparative perspective. Annu Rev Cell Dev Biol. 2020;36:411–40. - PubMed
-
- White MD, Zenker J, Bissiere S, Plachta N. Instructions for assembling the early mammalian embryo. Dev Cell. 2018;45(6):667–79. - PubMed
-
- Chazaud C, Yamanaka Y, Pawson T, Rossant J. Early lineage segregation between epiblast and primitive endoderm in mouse blastocysts through the Grb2-MAPK pathway. Dev Cell. 2006;10(5):615–24. - PubMed
-
- Rossant J, Tam PPL. Early human embryonic development: blastocyst formation to gastrulation. Dev Cell. 2022;57(2):152–65. - PubMed
-
- Biondic S, Canizo J, Vandal K, Zhao C, Petropoulos S. Cross-species comparison of mouse and human preimplantation development with an emphasis on lineage specification. Reproduction. 2023;165(4):R103–16. - PubMed
MeSH terms
Grants and funding
LinkOut - more resources
Full Text Sources
