. 2024 Sep 6:11:rbae113.
doi: 10.1093/rb/rbae113. eCollection 2024.

Engineered liver-derived decellularized extracellular matrix-based three-dimensional tumor constructs for enhanced drug screening efficiency

Affiliations

Engineered liver-derived decellularized extracellular matrix-based three-dimensional tumor constructs for enhanced drug screening efficiency

Shengchang Luo et al. Regen Biomater. .

Abstract

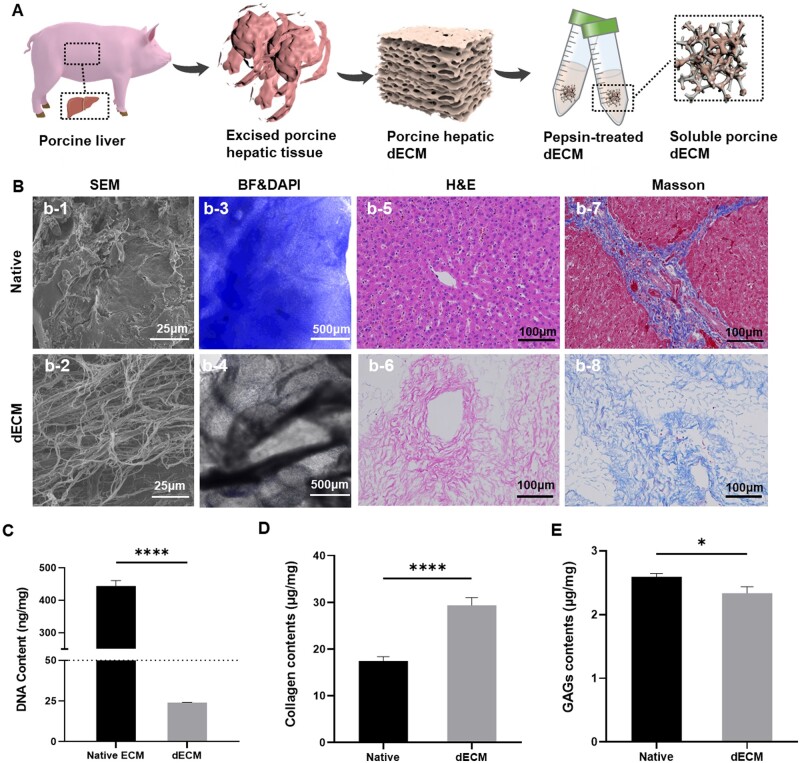
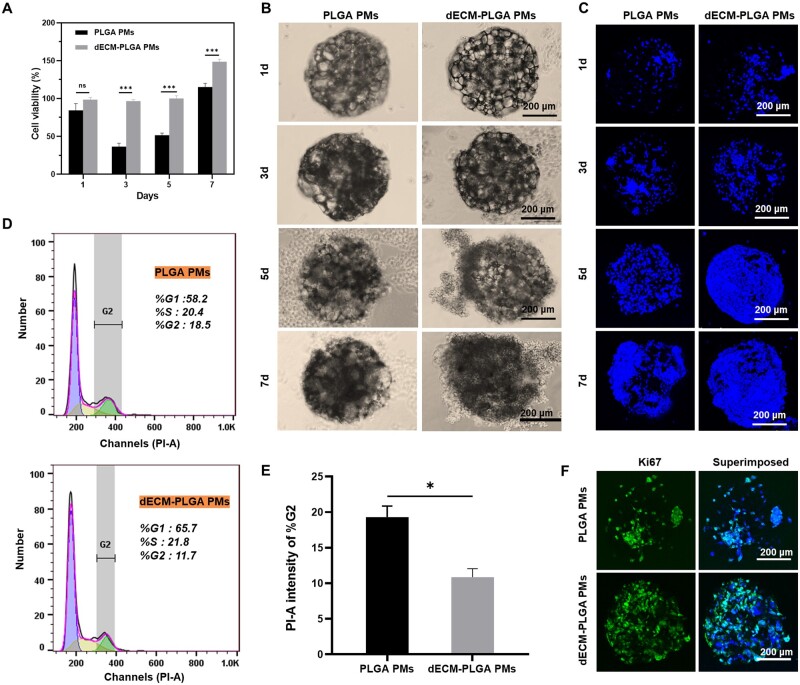
The decellularized extracellular matrix (dECM) has emerged as an effective medium for replicating the in vivo-like conditions of the tumor microenvironment (TME), thus enhancing the screening accuracy of chemotherapeutic agents. However, recent dECM-based tumor models have exhibited challenges such as uncontrollable morphology and diminished cell viability, hindering the precise evaluation of chemotherapeutic efficacy. Herein, we utilized a tailor-made microfluidic approach to encapsulate dECM from porcine liver in highly poly(lactic-co-glycolic acid) (PLGA) porous microspheres (dECM-PLGA PMs) to engineer a three-dimensional (3D) tumor model. These dECM-PLGA PMs-based microtumors exhibited significant promotion of hepatoma carcinoma cells (HepG2) proliferation compared to PLGA PMs alone, since the infusion of extracellular matrix (ECM) microfibers and biomolecular constituents within the PMs. Proteomic analysis of the dECM further revealed the potential effects of these bioactive fragments embedded in the PMs. Notably, dECM-PLGA PMs-based microtissues effectively replicated the drug resistance traits of tumors, showing pronounced disparities in half-maximal inhibitory concentration (IC50) values, which could correspond with certain aspects of the TME. Collectively, these dECM-PLGA PMs substantially surmounted the prevalent challenges of unregulated microstructure and suboptimal cell viability in conventional 3D tumor models. They also offer a sustainable and scalable platform for drug testing, holding promise for future pharmaceutical evaluations.

Keywords: cancer; decellularized extracellular matrix; microfluidics; preclinical drug screening; three-dimensional tumor model.


Figures

None
Graphical abstract
Figure 1.
Figure 1.
Decellularized and characterization of porcine liver. (A) Schematic overview of the decellularization and pepsin-treated dECM process. (B) Morphological overview of liver-derived dECM, including SEM micrographs of the native liver ECM (b-1) and porcine liver-derived dECM (b-2). Scale bar = 25 μm. Fluorescence imaging of DNA content in the native liver ECM (b-3) and porcine liver-derived dECM (b-4). Scale bar = 100 μm. H&E staining and Masson staining of native liver ECM (b-5 and b-7) and porcine liver-derived dECM (b-6 and b-8). Scale bar = 100 μm. (C) Quantitative analysis of DNA content of the native liver ECM and porcine liver-derived dECM. ****P <0.0001. (D) Analysis of collagen-I content in native liver ECM and porcine liver-derived dECM. ****P <0.0001. (E) Analysis of GAGs content in native liver ECM and porcine liver-derived dECM. *P <0.05.
Figure 2.
Figure 2.
Composition of the liver-derived ECM. (A) Molecular weight distribution and sequence distribution length based on compositions in the liver-derived dECM. (B) KEGG analysis of porcine liver-derived dECM, the secondary class, was used to stand the relative to key pathways relations of porcine liver-derived dECM. (C) GO analysis of protein composition (CC), biological processes (BP) and involvement of the dECM proteins in different molecular functions (MF). The top 10 GO terms were used to introduce the main functions of dECM. Statistical significance was determined at a defined level of P <0.05 for all proteomic analyses.
Figure 3.
Figure 3.
Characterization of dECM-PLGA PMs. (A) SEM images of PLGA PMs (up) and dECM-PLGA PMs (down). Scale bar = 200 μm (holistic view, left) and 40 μm (magnified view, right). (B) Pore size distribution of fabricated PMs based on SEM images. (C) FTIR analysis of various PMs based on attenuated total reflectance protocol. (D) XPS results of samples. XPS peaks of the PLGA PMs and dECM-PLGA PMs. (E) Immunohistochemical image of Collagen-I enriched in dECM-PLGA PMs showing the existence of liver-derived dECM. The arrow marked the positive components of dECM. Scale bar = 200 μm.
Figure 4.
Figure 4.
Proliferation of HepG2 on the dECM-PLGA PMs. (A) Cell viability of PMs-based microtumors for various cultural time. ***P < 0.001. Representative images of bright-field (B) and fluorescence images (C) showing the adhesion of HepG2 incubated PLGA PMs and dECM-PLGA PMs under dynamic culture for various cultural times. Scale bar = 200 μm. (D) Flow cytometry analysis of cell cycle variations of HepG2 adhesion with PLGA PMs and dECM-PLGA PMs (3 d). (E) The percentage of the G2 phase shows the proliferative activity of HepG2 adhesion on PLGA PMs and dECM-PLGA PMs (3 d). *P < 0.05. (F) Immunofluorescence morphology of Ki-67 expression of HepG2 adhesion on the PLGA PMs and dECM-PLGA PMs (3 d). Scale bar = 200 μm.
Figure 5.
Figure 5.
Evaluation of cell growth states on dECM-PLGA PMs. (A). CLSM images showing the cell viability of the PMs-based microtumors (1 d and 7 d). Scale bar =200 μm. (B) Survival percentage analysis of the ratio of live to dead stained HepG2. **P < 0.01. (C) CLSM images showing the cytoskeleton of HepG2 on the PMs (1 d and 7 d). Scale bar = 200 μm. (D) Fluorescence intensity analysis of TRITC positive stained HepG2. **P < 0.01.
Figure 6.
Figure 6.
Evaluation of cell function on dECM-PLGA PMs. (A) H&E staining showing cell-laden PMs-based microtumors (1 d and 7 d). Scale bar = 200 μm. (B) Immunofluorescence morphology of MRP-2 expression of cell-laden PMs (7 d). Scale bar = 200 μm. (C) p-β-catenin/β-catenin, and (D) MRP-2 protein expression levels of PMs-based microtumors (10 d). ***P <0.001.
Figure 7.
Figure 7.
Drug evaluation on the dECM-PLGA PMs-based microtumors. (A, B) Drug susceptibility curve (CIS and SOR) in vitro showing the relative viabilities of HepG2 after incubation with different concentrations. (C) IC50 values analysis of anticancer drugs in different tumor models based on drug susceptibility curve. (D and E) Fluorescence microscopy analysis showing AO/EB dual staining of PMs-based microtumors after incubating with 50 and 100 μM CIS and SOR, respectively. Scale bar = 200 μm. (F and G) Fluorescence microscopy of cellular internalization of DOX partnered with DAPI staining in PMs-based microtumors.Scale bar = 200 μm.

References

    1. Wakefield L, Agarwal S, Tanner K.. Preclinical models for drug discovery for metastatic disease. Cell 2023;186:1792–813. - PubMed
    1. Thoma CR, Zimmermann M, Agarkova I, Kelm JM, Krek W.. 3D cell culture systems modeling tumor growth determinants in cancer target discovery. Adv Drug Deliv Rev 2014;69–70:29–41. - PubMed
    1. Brancato V, Oliveira JM, Correlo VM, Reis RL, Kundu SC.. Could 3D models of cancer enhance drug screening? Biomaterials 2020;232:119744. - PubMed
    1. Ma JN, Dai LS, Yu JB, Cao H, Bao YM, Hu JJ, Zhou LH, Yang JQ, Sofia A, Chen HW, Wu F, Xie ZK, Qian WQ, Zhan RY.. Tumor microenvironment targeting system for glioma treatment via fusion cell membrane coating nanotechnology. Biomaterials 2023;295:122026. - PubMed
    1. Zhang CY, Fu CP, Li XY, Lu XC, Hu LG, Kankala RK, Wang SB, Chen AZ.. Three-dimensional bioprinting of decellularized extracellular matrix-based bioinks for tissue engineering. Molecules 2022;27:3442. - PMC - PubMed

LinkOut - more resources