. 2024 Sep 16:15:1432334.
doi: 10.3389/fimmu.2024.1432334. eCollection 2024.

Aconitate decarboxylase 1 mediates the acute airway inflammatory response to environmental exposures

Affiliations

Aconitate decarboxylase 1 mediates the acute airway inflammatory response to environmental exposures

Aaron D Schwab et al. Front Immunol. .

Abstract

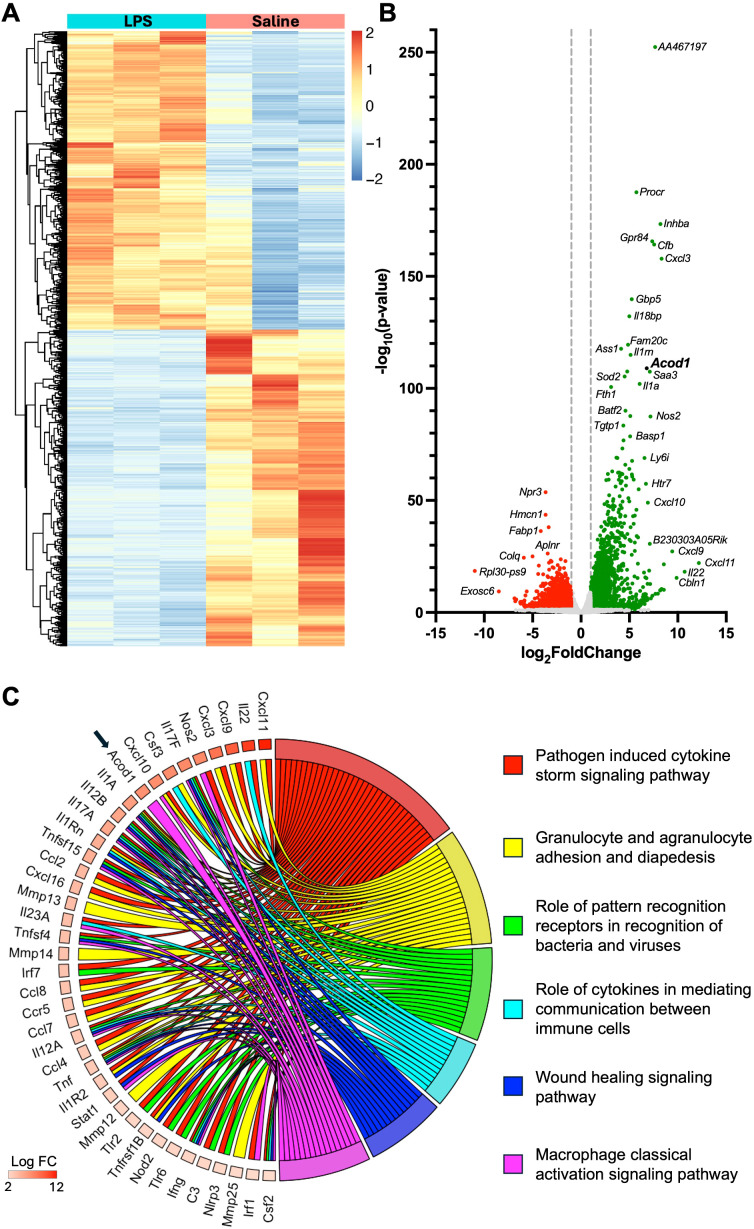
Background: Environmental lipopolysaccharide (LPS) and microbial component-enriched organic dusts cause significant lung disease. These environmental exposures induce the recruitment and activation of distinct lung monocyte/macrophage subpopulations involved in disease pathogenesis. Aconitate decarboxylase 1 (Acod1) was one of the most upregulated genes following LPS (vs. saline) exposure of murine whole lungs with transcriptomic profiling of sorted lung monocyte/macrophage subpopulations also highlighting its significance. Given monocyte/macrophage activation can be tightly linked to metabolism, the objective of these studies was to determine the role of the immunometabolic regulator ACOD1 in environmental exposure-induced lung inflammation.

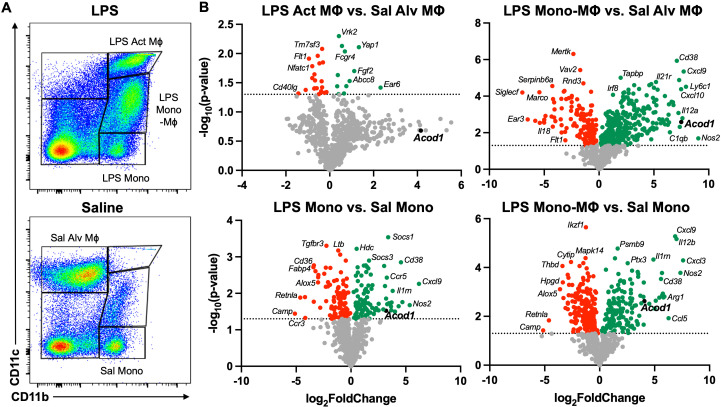
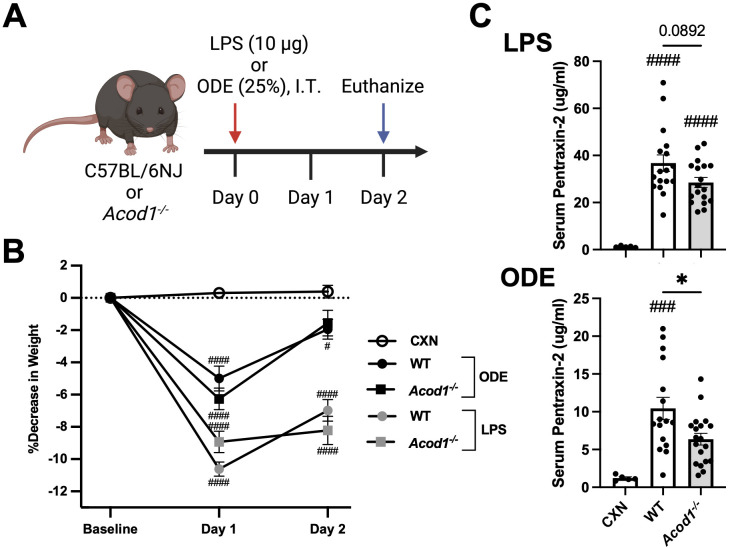
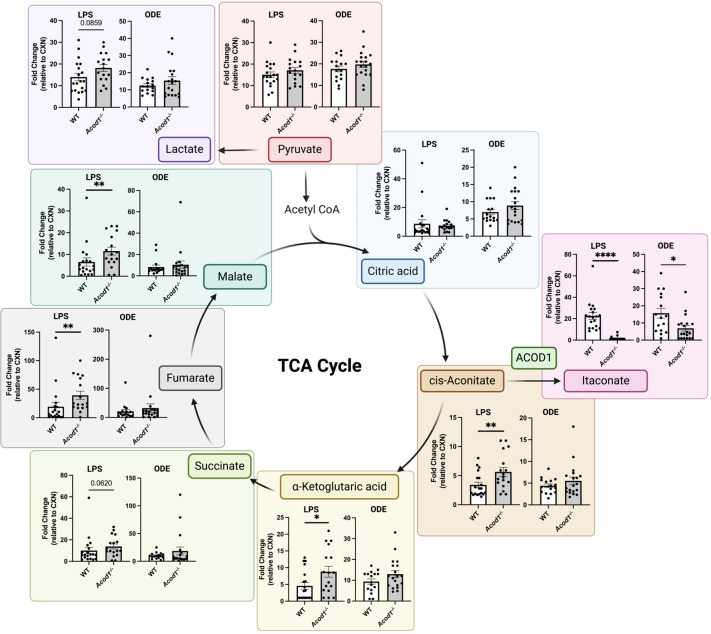
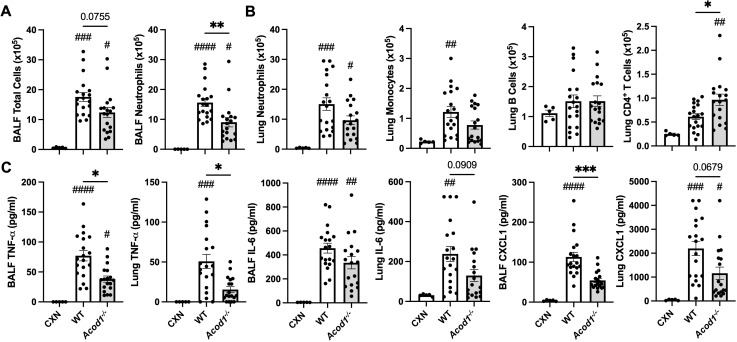
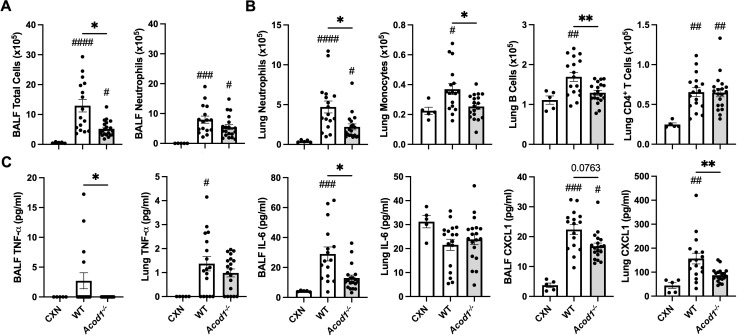
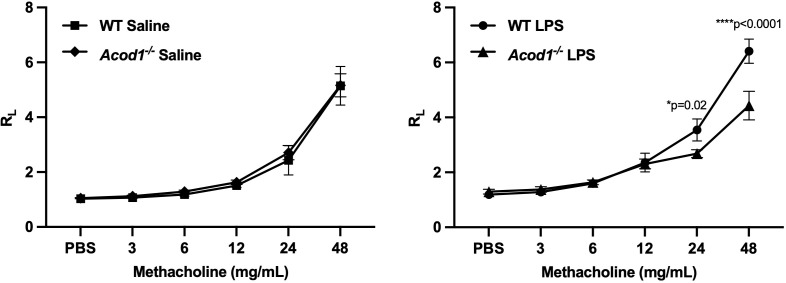
Methods: Wild-type (WT) mice were intratracheally (i.t.) instilled with 10 μg of LPS or saline. Whole lungs were profiled using bulk RNA sequencing or sorted to isolate monocyte/macrophage subpopulations. Sorted subpopulations were then characterized transcriptomically using a NanoString innate immunity multiplex array 48 h post-exposure. Next, WT and Acod1-/- mice were instilled with LPS, 25% organic dust extract (ODE), or saline, whereupon serum, bronchoalveolar lavage fluid (BALF), and lung tissues were collected. BALF metabolites of the tricarboxylic acid (TCA) cycle were quantified by mass spectrometry. Cytokines/chemokines and tissue remodeling mediators were quantitated by ELISA. Lung immune cells were characterized by flow cytometry. Invasive lung function testing was performed 3 h post-LPS with WT and Acod1-/- mice.

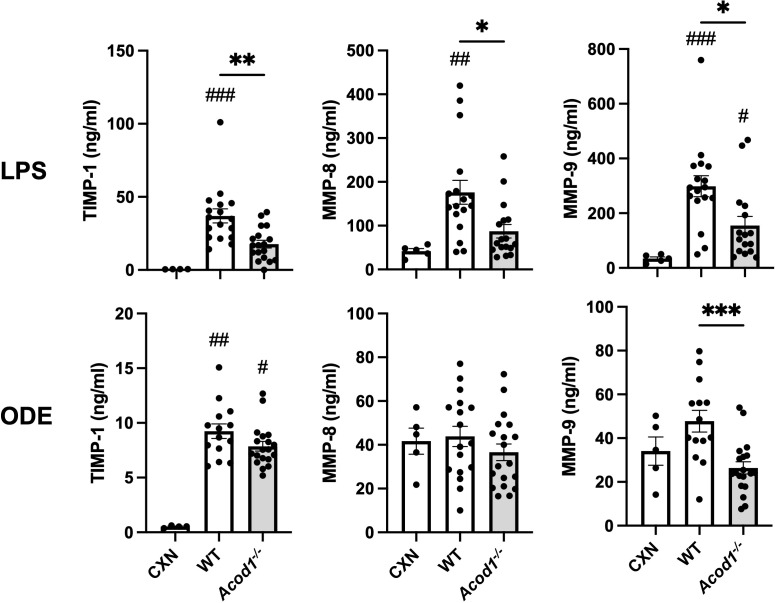
Results: Acod1-/- mice treated with LPS demonstrated decreased BALF levels of itaconate, TCA cycle reprogramming, decreased BALF neutrophils, increased lung CD4+ T cells, decreased BALF and lung levels of TNF-α, and decreased BALF CXCL1 compared to WT animals. In comparison, Acod1-/- mice treated with ODE demonstrated decreased serum pentraxin-2, BALF levels of itaconate, lung total cell, neutrophil, monocyte, and B-cell infiltrates with decreased BALF levels of TNF-α and IL-6 and decreased lung CXCL1 vs. WT animals. Mediators of tissue remodeling (TIMP1, MMP-8, MMP-9) were also decreased in the LPS-exposed Acod1-/- mice, with MMP-9 also reduced in ODE-exposed Acod1-/- mice. Lung function assessments demonstrated a blunted response to LPS-induced airway hyperresponsiveness in Acod1-/- animals.

Conclusion: Acod1 is robustly upregulated in the lungs following LPS exposure and encodes a key immunometabolic regulator. ACOD1 mediates the proinflammatory response to acute inhaled environmental LPS and organic dust exposure-induced lung inflammation.

Keywords: ACOD1; endotoxin; environmental health; immunometabolism; inhalation; macrophages; organic dust.


Conflict of interest statement

JP has received research reagent from AstraZeneca (no monies) and has been a site investigator for allergy and asthma clinical studies for Takeda, GlaxoSmithKline, Regeneron, Areteia, and AstraZeneca (no monies). The remaining authors declare that the research was conducted in the absence of any commercial or financial relationships that could be construed as a potential conflict of interest.

Figures

Figure 1
Figure 1
Comparative transcriptome of lung tissue from lipopolysaccharide (LPS)- and saline-exposed mice at 48 h post-exposure. (A) Heatmap demonstrates unsupervised hierarchical clustering of samples (n = 3 per treatment) and relative frequencies of genes subjected to symmetric normalization of log2(transcripts per million [TPM] + 0.0001) for all significant genes (adj p < 0.05) to avoid any nonsense values. The color scheme represents symmetric normalization of relative frequencies from 2 (red, high expression) to −2 (blue, low expression). (B) Volcano plot demonstrates statistical significance (−log10(p-value)) vs. magnitude of change (log2FoldChange) in the expression of specified gene transcripts (−log10(p-value) > 1.3) with green reflecting upregulated and red reflecting downregulated genes. (C) Chord plot demonstrates the top canonical pathways of the whole lung transcriptome based on the Ingenuity Pathway Analysis (IPA) output and corresponding adjusted p-value (adj p < 0.05) and the top upregulated genes (p < 0.05) associated with each modulated pathway.
Figure 2
Figure 2
Acute exposure to LPS differentially modulates myeloid cell gene transcription with notable Acod1 upregulation. (A) Representative image of gates for the five lung monocyte (Mono)/macrophage (MΦ) subpopulations: Saline (Sal) Alveolar (Alv) MΦ: CD11c+CD11blo, LPS Activated (Act) MΦ: CD11c+CD11bhi, Transitioning LPS Mono-MΦ: CD11cintCD11bhi, and Sal and LPS Mono: CD11bhiCD11c after exclusion of debris, doublets, dead cells, CD45 cells, lymphocytes, and neutrophils. (B) Volcano plots demonstrate statistical significance (−log10(p-value) vs. magnitude of change (log2FoldChange) in the expression of specified gene transcripts. Statistical significance is denoted by the dotted line (−log10(p-value) > 1.3). n = 3 samples per lung monocyte/macrophage subpopulation for differential gene expression analysis.
Figure 3
Figure 3
Acod1 depletion decreases ODE-induced serum pentraxin-2 levels but not LPS- or ODE-induced weight loss. (A) Schematic of the experimental design (created with BioRender.com). (B) Line graph depicts the mean with SEM bars of percent changes in weight over time. (C) Scatter plot graphs depict the mean with SEM bars of serum pentraxin-2 levels among treatment groups. n = 5 (CXN), n = 17–19 (8–9 male and 9–10 female WT mice, LPS), n = 18 (8 male and 10 female Acod1−/− mice, LPS), n = 16–17 (7 male and 9–10 female WT mice, ODE), and n = 19 (9 male and 10 female Acod1−/− mice, ODE). Statistical significance vs. CXN (#p < 0.05, ###p < 0.001, ####p < 0.0001); between groups (*p < 0.05).
Figure 4
Figure 4
Acod1−/− mice demonstrate modulation of tricarboxylic acid cycle (TCA) intermediates following environmental exposure. A simplified schematic of the TCA cycle with scatter plot graphs depicting the mean with SEM bars between treatment groups. Graphs show the relative abundance of indicated metabolites, represented by fold change relative to CXN (saline-treated WT mice). n = 5 (CXN), n = 19 (9 male and 10 female WT mice, LPS), n = 18 (8 male and 10 female Acod1−/− mice, LPS), n = 17 (7 male and 10 female WT mice, ODE), and n = 19 (9 male and 10 female Acod1−/− mice, ODE). Statistical significance between groups (*p < 0.05, **p < 0.01, ****p < 0.0001).
Figure 5
Figure 5
LPS-induced cellular infiltrates and inflammatory mediators are reduced in Acod1−/− mice. Scatter plot graphs depict the mean with SEM bars among treatment groups. (A) Total cellular influx and neutrophils in BALF. (B) Neutrophils, monocytes, B cells, and CD4+ T cells in lung tissue quantified by flow cytometry. (C) Levels of airway inflammatory markers determined by ELISA from BALF and lung homogenate. n = 5 (CXN), n = 19 (9 male and 10 female WT mice), and n = 18 (8 male and 10 female Acod1−/− mice). Statistical significance vs. CXN (#p < 0.05, ##p < 0.01, ###p < 0.001, ####p < 0.0001); between groups (*p < 0.05, **p < 0.01, ***p < 0.001).
Figure 6
Figure 6
Acod1−/− mice exhibit decreased mediators of lung and airway inflammation following a one-time ODE exposure. Scatter plot graphs depict the mean with SEM bars among treatment groups. (A) Total cellular influx and neutrophils in BALF. (B) Neutrophils, monocytes, B cells, and CD4+ T cells in lung tissue quantified by flow cytometry. (C) Levels of airway inflammatory markers determined by ELISA from BALF and lung homogenate. n = 5 (CXN), n = 16–17 (7 male and 9–10 female WT mice exposed to ODE), and n = 19 (9 male and 10 female Acod1−/− mice exposed to ODE). Statistical significance vs. CXN (#p < 0.05, ##p < 0.01, ###p < 0.001, ####p < 0.0001); between groups (*p < 0.05, **p < 0.01).
Figure 7
Figure 7
Mediators of tissue remodeling are decreased in Acod1−/− mice following environmental exposures. Scatter plot graphs depict the mean with SEM bars among treatment groups. Lung tissue levels of matrix metalloproteinases (MMPs) and tissue inhibitor of metalloproteinase (TIMP-1) are shown 48 h after a one-time LPS or ODE intratracheal instillation. n = 4–5 (CXN), n = 17 (7 male and 10 female WT mice exposed to LPS), n = 16–18 (6–8 male and 10 female Acod1−/− mice exposed to LPS), n = 17 (7 male and 10 female WT mice exposed to ODE), and n = 19 (9 male and 10 female Acod1−/− mice exposed to ODE). Statistical significance vs. CXN (#p < 0.05, ##p < 0.01, ###p < 0.001); between groups (*p < 0.05, **p < 0.01, ***p < 0.001).
Figure 8
Figure 8
Acod1−/− mice demonstrated a blunted response to LPS-induced airway hyperresponsiveness (AHR). WT and Acod1−/− mice were initially treated with saline or LPS. Three hours following i.t. instillation, mice were tracheostomized and mechanically ventilated, and AHR to aerosolized methacholine (0 [PBS], 3, 6, 12, 24, 48 mg/mL) was measured and expressed as the mean (± SEM) total lung resistance (RL). Statistical difference between the LPS and saline treatment groups was determined by repeated measures of a two-way ANOVA full fit model with a two-stage linear step-up procedure of Benjamini, Krieger, and Yekutieli to control for false discovery rate. n = 6 male mice/group.

References

    1. Prüss-Ustün A, Wolf J, Corvalán C, Neville T, Bos R, Neira M, et al. . Diseases due to unhealthy environments: an updated estimate of the global burden of disease attributable to environmental determinants of health. J Public Health (Oxf). (2017) 39:464–75. doi: 10.1093/pubmed/fdw085 - DOI - PMC - PubMed
    1. Rolph CA, Gwyther CL, Tyrrel SF, Nasir ZA, Drew GH, Jackson SK, et al. . Sources of airborne endotoxins in ambient air and exposure of nearby communities—A review. Atmosphere. (2018) 9:375. doi: 10.3390/atmos9100375 - DOI
    1. Tager IB, Lurmann FW, Haght T, Alcorn S, Penfold B, Hammond SK. Temporal and spatial patterns of ambient endotoxin concentrations in Fresno, California. Environ Health Perspect. (2010) 118:1490–6. doi: 10.1289/ehp.0901602 - DOI - PMC - PubMed
    1. Park S, Allen RJ, Lim CH. A likely increase in fine particulate matter and premature mortality under future climate change. Air Quality Atmosphere Health. (2020) 13:143–51. doi: 10.1007/s11869-019-00785-7 - DOI
    1. Joshi M, Goraya H, Joshi A, Bartter T. Climate change and respiratory diseases: a 2020 perspective. Curr Opin Pulm Med. (2020) 26:119–27. doi: 10.1097/MCP.0000000000000656 - DOI - PubMed

MeSH terms