. 2024 Sep 16:15:1458967.
doi: 10.3389/fimmu.2024.1458967. eCollection 2024.

Varicella-zoster virus recapitulates its immune evasive behaviour in matured hiPSC-derived neurospheroids

Affiliations

Varicella-zoster virus recapitulates its immune evasive behaviour in matured hiPSC-derived neurospheroids

Jonas Govaerts et al. Front Immunol. .

Abstract

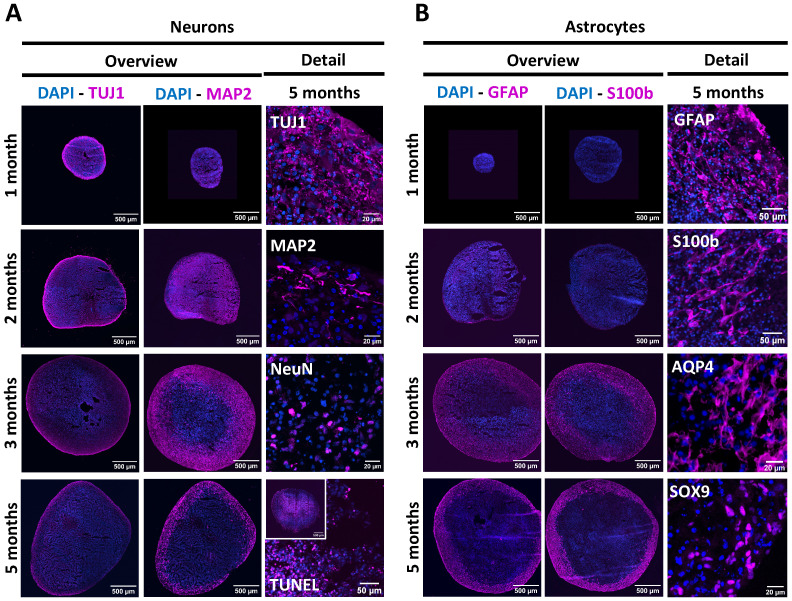
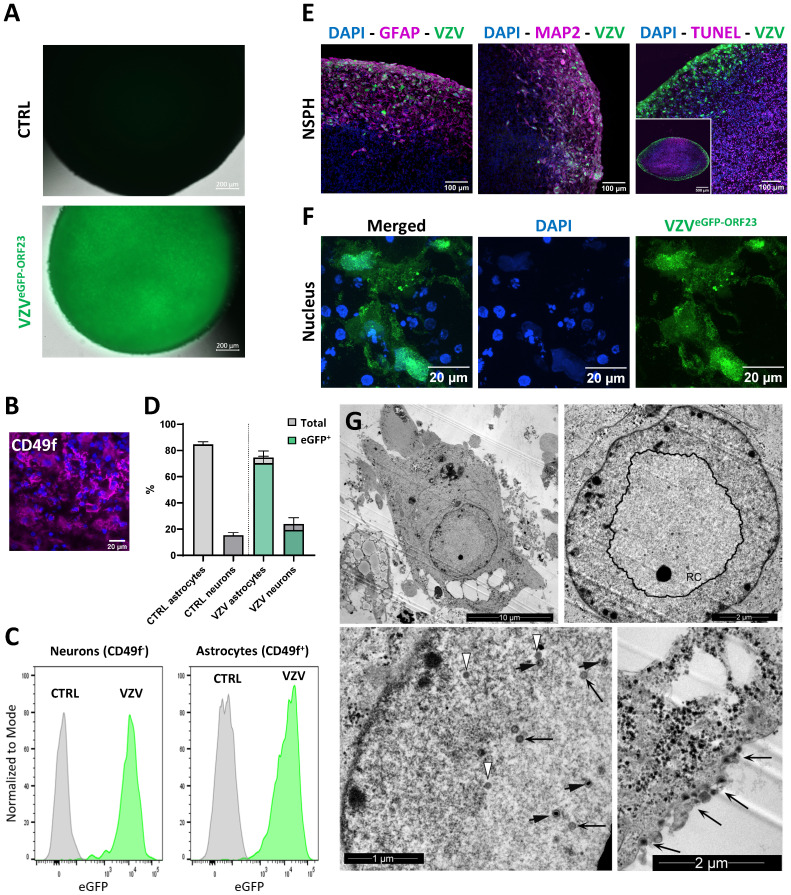
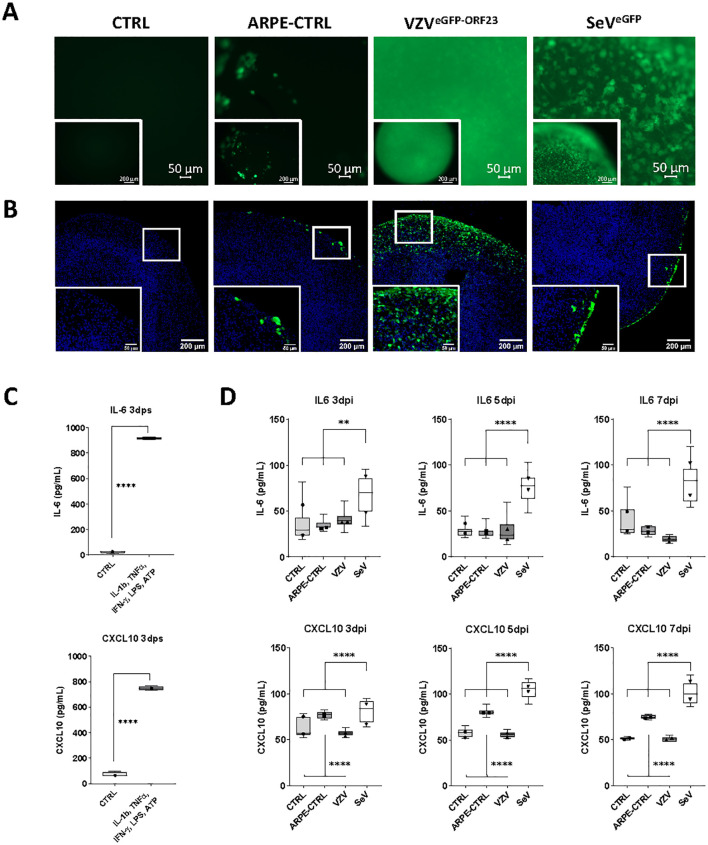
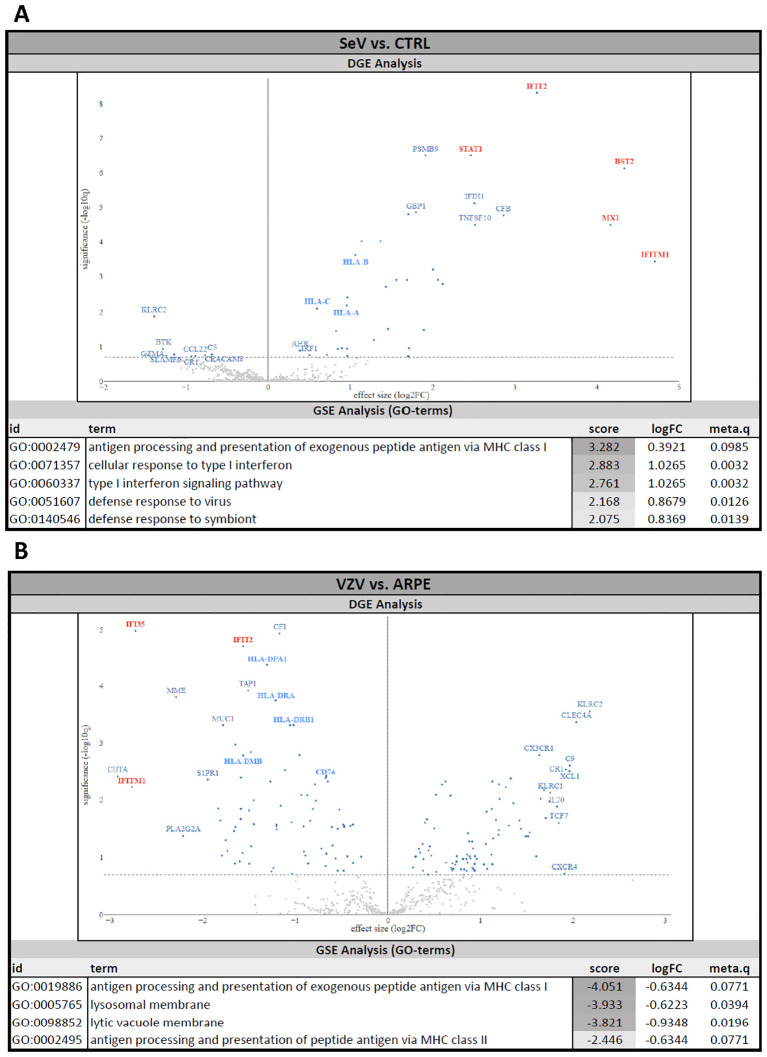
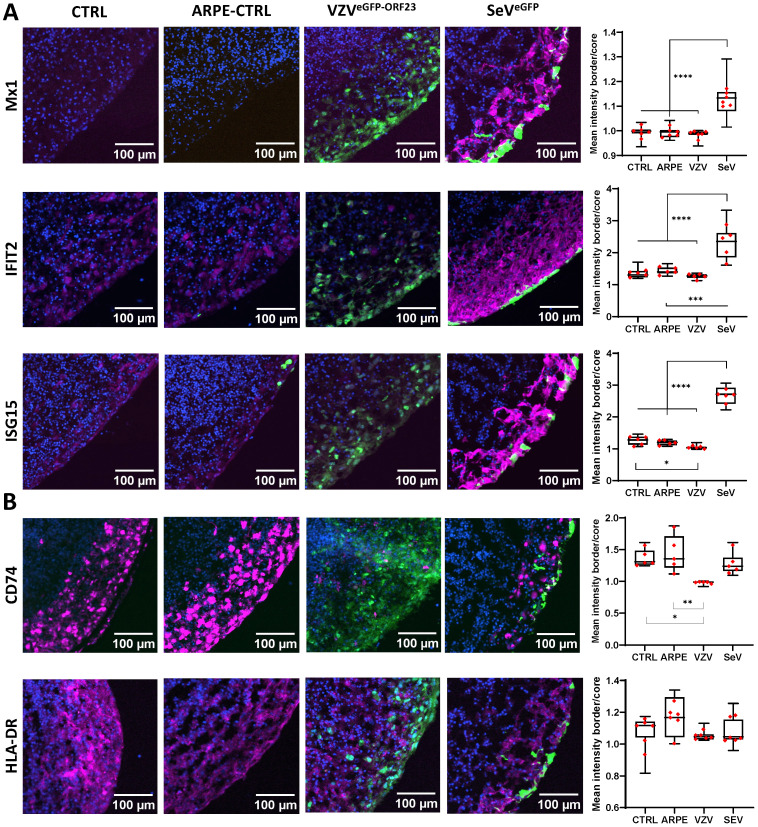
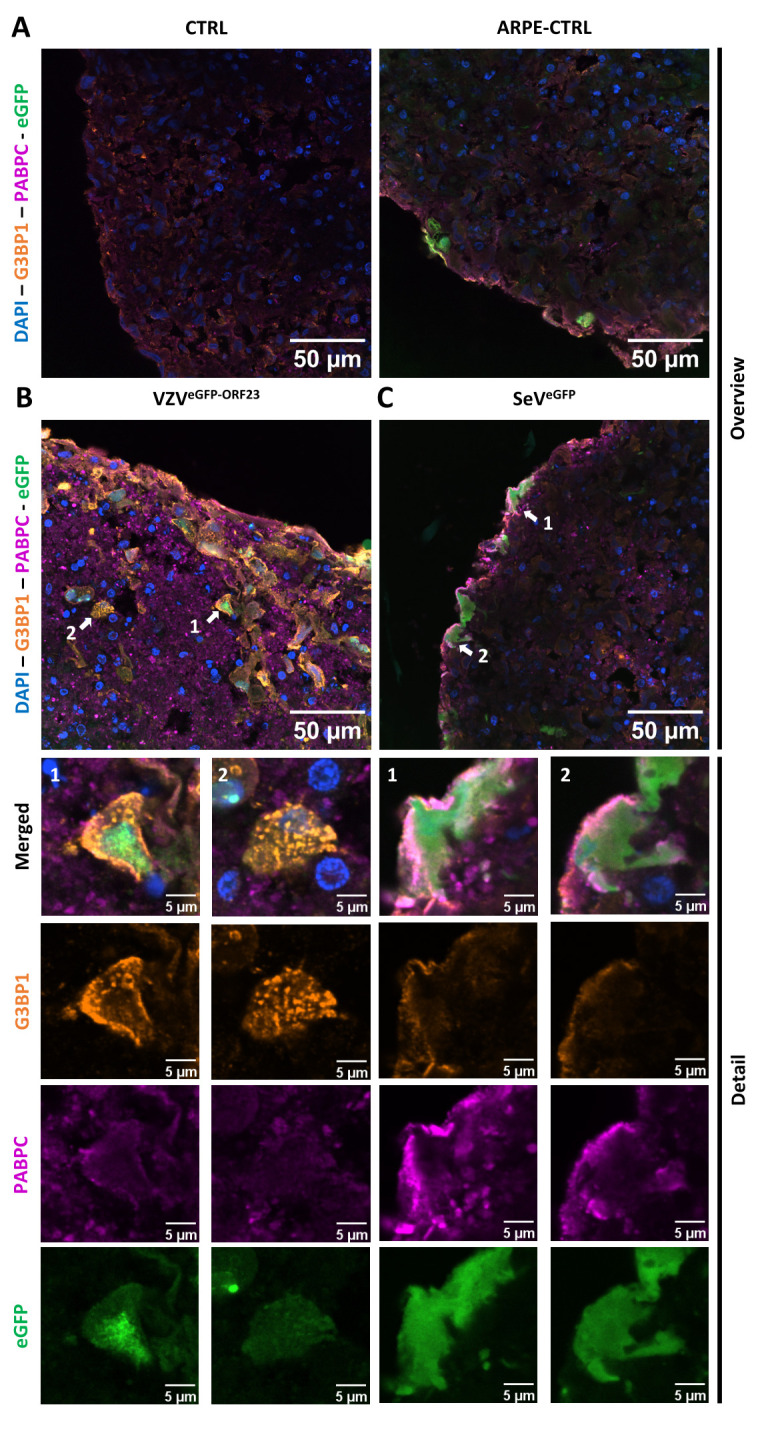
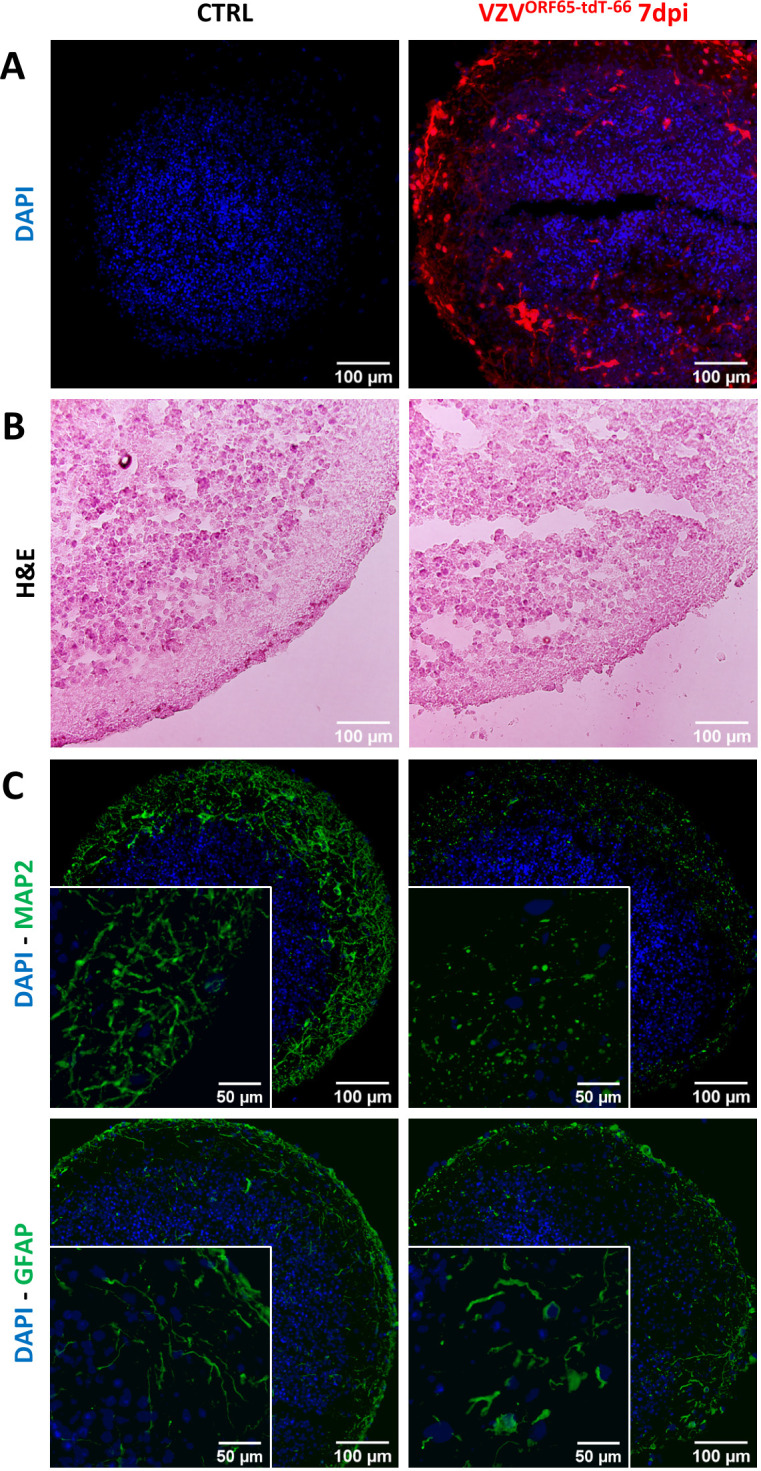
Varicella-zoster virus (VZV) encephalitis and meningitis are potential central nervous system (CNS) complications following primary VZV infection or reactivation. With Type-I interferon (IFN) signalling being an important first line cellular defence mechanism against VZV infection by the peripheral tissues, we here investigated the triggering of innate immune responses in a human neural-like environment. For this, we established and characterised 5-month matured hiPSC-derived neurospheroids (NSPHs) containing neurons and astrocytes. Subsequently, NSPHs were infected with reporter strains of VZV (VZVeGFP-ORF23) or Sendai virus (SeVeGFP), with the latter serving as an immune-activating positive control. Live cell and immunocytochemical analyses demonstrated VZVeGFP-ORF23 infection throughout the NSPHs, while SeVeGFP infection was limited to the outer NSPH border. Next, NanoString digital transcriptomics revealed that SeVeGFP-infected NSPHs activated a clear Type-I IFN response, while this was not the case in VZVeGFP-ORF23-infected NSPHs. Moreover, the latter displayed a strong suppression of genes related to IFN signalling and antigen presentation, as further demonstrated by suppression of IL-6 and CXCL10 production, failure to upregulate Type-I IFN activated anti-viral proteins (Mx1, IFIT2 and ISG15), as well as reduced expression of CD74, a key-protein in the MHC class II antigen presentation pathway. Finally, even though VZVeGFP-ORF23-infection seems to be immunologically ignored in NSPHs, its presence does result in the formation of stress granules upon long-term infection, as well as disruption of cellular integrity within the infected NSPHs. Concluding, in this study we demonstrate that 5-month matured hiPSC-derived NSPHs display functional innate immune reactivity towards SeV infection, and have the capacity to recapitulate the strong immune evasive behaviour towards VZV.

Keywords: antigen presentation; human iPSc; neurospheroids; stress granules; structural integrity; type-I interferon signalling; varicella-zoster virus.


Conflict of interest statement

The authors declare that the research was conducted in the absence of any commercial or financial relationships that could be construed as a potential conflict of interest.

Figures

Figure 1
Figure 1
Longitudinal characterisation of NSPH differentiation. (A) Representative images of NSPHs at the age of 1, 2, 3 and/or 5 months immunolabelled for the neuronal markers Tuj1 (magenta), MAP2 (magenta) and NeuN (magenta), and the late-stage apoptosis TUNEL staining (magenta), as indicated. (B) Representative images of NSPHs at the age of 1, 2, 3 and/or 5 months immunolabelled for the astrocyte markers GFAP (magenta), S100b (magenta), AQP4 (magenta) and SOX9 (magenta), as indicated. Nuclei are labelled with DAPI (blue). Scale bars of 20, 50 and 500 µm are indicated on the images.
Figure 2
Figure 2
VZVeGFP-ORF23 infection of 5-month-old NSPHs. (A) Representative live cell fluorescence image of uninfected NSPHs and VZVeGFP-ORF23 infected NSPHs at day 7 post-infection. Scale bars of 200 µm are indicated on the images. (B) Representative image of a NSPH stained with the extracellular astrocyte-enriched CD49f marker (magenta) and nuclei labelled with DAPI (blue). Scale bar of 20µm indicated on the image. (C) Representative flow cytometric analysis showing histogram overlay of CD49f- neurons and CD49f+ astrocytes obtained from dissociated uninfected NSPHs (CTRL) and VZVeGFP-ORF23 infected NSPHs (VZV) at day 7 post-infection. (D) Bar graph indicating the average percentage of astrocytes and neurons measured in uninfected NSPHs (CTRL) and VZVeGFP-ORF23 infected NSPHs (VZV), as well as the average % of astrocytes and neurons displaying eGFP-ORF23 fluorescence in VZVeGFP-ORF23 infected NSPHs (n=3 for CTRL and n=3 for VZV). Error bars indicate standard deviation (SD). (E) Representative images of VZVeGFP-ORF23 infected NSPHs (green) at the age of 5 months immunolabelled for GFAP (magenta), MAP2 (magenta) and TUNEL (magenta), as indicated. Nuclei are labelled with DAPI (blue). Scale bars of 100 and 500 µm are indicated on the images. (F) Representative images of the cytoplasmic and nuclear localisation of VZVeGFP-ORF23 (green) in infected NSPHs at the age of 5 months. Nuclei are labelled with DAPI (blue). Scale bars of 20 µm are indicated on the images. (G) Representative transmission electron microscopy (TEM) images of VZVeGFP-ORF23 infected NSPHs at the age of 5 months. Upper left image showing an overview TEM image of a VZVeGFP-ORF23 infected cell. Upper right image showing the nuclear replication complex (RC). Lower left image showing different maturation stages of the VZV virion, with white arrows indicating procapsids, long black arrows indicating capsid B and short black arrows indicating capsid C Lower right image showing viral particles egressing at the cell surface (long black arrows). Scale bars of 1, 2 and 10 µm are indicated on the images.
Figure 3
Figure 3
Immune responsiveness of VZVeGFP-ORF23- and SeVeGFP-infected NSPHs. (A) Representative live cell fluorescence image of 5-month-old control NSPHs (CTRL), NSPHs inoculated with eGFP+ control ARPE19 cells (ARPE-CTRL, green), NSPHs inoculated with VZVeGFP-ORF23-infected ARPE19 cells (VZVeGFP-ORF23, green), and NSPHs infected with SeVeGFP (SeVeGFP, green) at day 7. Scale bars of 50 and 200 µm are indicated on the images. (B) Representative images of 5-month-old control NSPHs (CTRL), NSPHs inoculated with eGFP+ control ARPE19 cells (ARPE-CTRL, green), NSPHs inoculated with VZVeGFP-ORF23-infected ARPE19 cells (VZVeGFP-ORF23, green), and NSPHs infected with SeVeGFP (SeVeGFP, green) at day 7. Nuclei are labelled with DAPI (blue). Scale bars of 50 and 200 µm are indicated on the images. (C) Boxplots showing IL-6 and CXCL10 cytokine secretion (in pg/mL) by 5-month-old control NSPHs (CTRL, n=4) and NSPHs stimulated with IL-1b, TNF-α, IFN-γ, LPS and ATP (n=4) at day 3 post-stimulation (dps). **** p<0,0001. Error bars indicate standard deviation (SD). (D) Combined box/dotplots showing IL-6 and CXCL10 cytokine secretion (in pg/mL) derived from 2 independent experiments for5-month-old control NSPHs (CTRL, n=8 for Exp1, n=4 for Exp 2), NSPHs inoculated with eGFP+ control ARPE19 cells (ARPE-CTRL, n=8 for Exp1, n=4 for Exp 2), NSPHs inoculated with VZVeGFP-ORF23-infected ARPE19 cells (VZV, n=8 for Exp1, n=4 for Exp 2), and NSPHs infected with SeVeGFP (SeV, n=8 for Exp1, n=4 for Exp 2) at 3-, 5- and 7-days post-infection (dpi). The mean of each individual experiment is given as a dot within the boxplot. ** p<0,01. **** p<0,0001.
Figure 4
Figure 4
Human Immunology NanoString gene expression analysis of VZVeGFP-ORF23- and SeVeGFP-infected NSPHs. Differential gene expression (DGE) analysis and gene set enrichment (GSE) analysis. (A) NSPHs infected with SeVeGFP (SeV, n=3) vs. uninfected control NSPH (CTRL, n=3). (B) NSPHs inoculated with VZVeGFP-ORF23-infected ARPE19 cells (VZV, n=3) vs. NSPHs inoculated with eGFP+ control ARPE19 cells (ARPE, n=3). Genes related to the Type-I IFN pathway are marked in red and genes related to the MHC antigen presentation pathway are marked in blue on the DGE volcano plot. The activation score, LogFC and meta.q significance values for the top-ranked GO terms from the GSE analysis are provided for (A, B).
Figure 5
Figure 5
VZVeGFP-ORF23 and SeVeGFP-infected NSPHs display opposite effects on protein expression related to Type-I interferon response and antigen presentation pathway. Representative immunofluorescence images for 5-month-old control NSPHs (CTRL, n=6), NSPHs inoculated with eGFP+ control ARPE19 cells (ARPE-CTRL, green, n=6), NSPHs inoculated with VZVeGFP-ORF23-infected ARPE19 cells (VZVeGFP-ORF23, green, n=6), and NSPHs infected with SeVeGFP (SeVeGFP, green, n=6), immunolabelled for (A) Type-I interferon response markers MX1, IFIT2 and ISG15, and (B) antigen presentation pathway markers HLA-DR and CD74. All in magenta. Nuclei are labelled with DAPI (blue). Scale bars of 100 µm are indicated on the images. Combined box/dotplots showing signal quantification. The mean value for each individual NSPH analysed is given as a dot within the boxplot. * p<0,05. ** p<0,01. *** p<0,001. **** p<0,0001.
Figure 6
Figure 6
Formation of stress granules in VZVeGFP-ORF23 and SeVeGFP-infected NSPHs. Representative overview immunofluorescence images of control NSPHs [(A), top left], NSPHs inoculated with eGFP+ control ARPE19 cells [(A), top right, ARPE-CTRL], NSPHs inoculated with VZVeGFP-ORF23-infected ARPE19 cells [(B), top left, VZVeGFP-ORF23], and NSPHs infected with SeVeGFP [(C), top right, SeVeGFP], immunolabelled for G3BP1 (orange) and PABPC1 (magenta). Insets of virus-infected cells are depicted by white arrows on the overview image [(B, C), top] and shown below the corresponding overview images [(B, C), bottom]. Nuclei are labelled with DAPI (blue). Scale bars of 50 (overview) and 5 (detail) µm are indicated on the images.
Figure 7
Figure 7
VZVORF65-tdT-66 affects cellular integrity in infected NSPHs. (A) Representative images of cryosections of control (CTRL) and VZVORF65-tdT-66 infected NSPH at day 7 post-infection (dpi), in which nuclei are labelled with DAPI (blue) and infection with VZVORF65-tdT-66 is shown in red (direct tdTomato fluorescence signal). (B) Representative images Haematoxylin-Eosin stained cryosections of control (CTRL) and VZVORF65-tdT-66 infected NSPH at 7 dpi. (C) Representative immunofluorescence images of control (CTRL) and VZVORF65-tdT-66 infected NSPH at 7 dpi, immunolabelled for the neuronal marker MAP2 (green, top panel) and astrocyte marker GFAP (green, bottom panel). Nuclei are labelled with DAPI (blue). Scale bars of 100 (overview) and 50 (detail) µm are indicated on the images.

References

    1. Lum KK, Cristea IM. Host innate immune response and viral immune evasion during alphaherpesvirus infection. Curr Issues Mol Biol. (2021) 42:635–86. doi: 10.21775/cimb.042.635 - DOI - PMC - PubMed
    1. Grose C. Pangaea and the out-of-Africa model of varicella-zoster virus evolution and phylogeography. J Virol. (2012) 86:9558–65. doi: 10.1128/JVI.00357-12 - DOI - PMC - PubMed
    1. Zerboni L, Sen N, Oliver SL, Arvin AM. Molecular mechanisms of varicella zoster virus pathogenesis. Nat Rev Microbiol. (2014) 12:197–210. doi: 10.1038/nrmicro3215 - DOI - PMC - PubMed
    1. Gershon AA, Breuer J, Cohen JI, Cohrs RJ, Gershon MD, Gilden D, et al. Varicella zoster virus infection. Nat Rev Dis Primers. (2015) 1:15016. doi: 10.1038/nrdp.2015.16 - DOI - PMC - PubMed
    1. Van Breedam E, Buyle-Huybrecht T, Govaerts J, Meysman P, Bours A, Boeren M, et al. Lack of strong innate immune reactivity renders macrophages alone unable to control productive Varicella-Zoster Virus infection in an isogenic human iPSC-derived neuronal co-culture model. Front Immunol. (2023) 14:1177245. doi: 10.3389/fimmu.2023.1177245 - DOI - PMC - PubMed

MeSH terms