. 2024 Oct;28(19):e70124.
doi: 10.1111/jcmm.70124.

The enhancing effects of selenomethionine on harmine in attenuating pathological cardiac hypertrophy via glycolysis metabolism

Affiliations

The enhancing effects of selenomethionine on harmine in attenuating pathological cardiac hypertrophy via glycolysis metabolism

Qi Chen et al. J Cell Mol Med. 2024 Oct.

Abstract

Pathological cardiac hypertrophy, a common feature in various cardiovascular diseases, can be more effectively managed through combination therapies using natural compounds. Harmine, a β-carboline alkaloid found in plants, possesses numerous pharmacological functions, including alleviating cardiac hypertrophy. Similarly, Selenomethionine (SE), a primary organic selenium source, has been shown to mitigate cardiac autophagy and alleviate injury. To explores the therapeutic potential of combining Harmine with SE to treat cardiac hypertrophy. The synergistic effects of SE and harmine against cardiac hypertrophy were assessed in vitro with angiotensin II (AngII)-induced hypertrophy and in vivo using a Myh6R404Q mouse model. Co-administration of SE and harmine significantly reduced hypertrophy-related markers, outperforming monotherapies. Transcriptomic and metabolic profiling revealed substantial alterations in key metabolic and signalling pathways, particularly those involved in energy metabolism. Notably, the combination therapy led to a marked reduction in the activity of key glycolytic enzymes. Importantly, the addition of the glycolysis inhibitor 2-deoxy-D-glucose (2-DG) did not further potentiate these effects, suggesting that the antihypertrophic action is predominantly mediated through glycolytic inhibition. These findings highlight the potential of SE and harmine as a promising combination therapy for the treatment of cardiac hypertrophy.

Keywords: cardiac hypertrophy; combination therapy; glycolysis metabolism; harmine; selenomethionine.


Conflict of interest statement

The authors confirm that this article content has no conflict of interest.

Figures

FIGURE 1
FIGURE 1
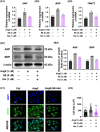
Combination synergy assessment of SE and Harmine against cardiac hypertrophy. (A) Cell viability was measured after treatment of Harmine or SE under various concentrations for 24 h. n = 5. (B) qPCR analysis of hypertrophic‐related genes ANP, BNP and TNNT2 in cardiomyocytes (normalized to 36B4 expression). n = 6. (C) Dose–response matrix of drug combination measurements representing the inhibition against biomarker genes. (D) Synergistic analysis of the combinatorial landscape based on the Loewe model. Har is an abbreviation of Harmine, SE is an abbreviation of selenomethionine. D1 and D2 refer to the doses of SE and Harmine, respectively. DIx,1 and DIx,2 represent the doses of Harmine and SE, respectively, that would be needed to achieve the same effect as observed in the combination, but when each drug is used alone. Data are presented as mean ± SEM, *p < 0.05, **p < 0.01, ***p < 0.001 versus AngII group by one‐way ANOVA.
FIGURE 2
FIGURE 2
Suppression of AngII‐induced hypertrophic responses by co‐treatment with SE and Harmine. (A) qPCR analysis showing the expression levels of hypertrophic markers ANP, BNP, and TNNT2 in cardiomyocytes, normalized to 36B4 expression. n = 6. (B) Western blot analysis demonstrating the protein expression levels of hypertrophic markers ANP and BNP in cardiomyocytes, normalized to β‐Actin expression. n = 3. (C) Representative immunofluorescence images of MYH7‐stained for sarcomere marker (green) and DAPI (blue) for nuclei of AC16. Scale bar = 40 μm. Data are presented as mean ± SEM. *p < 0.05, **p < 0.01, ***p < 0.001 versus AngII group by one‐way ANOVA.
FIGURE 3
FIGURE 3
Co‐treatment of SE and Harmine alleviates cardiac hypertrophy in Myh6R404Q mice. (A) Macroscopic view of heart size. (B) Representative images of H&E staining of heart tissues (upper, scale bar: 2 mm), along with high‐magnification views (bottom, scale bar: 100 μm). (C) Masson's trichrome staining of cardiac tissue sections (scale bar: 100 μm). (D) WGA staining of cardiac tissue sections. (E) Weekly food intake of each group during the 4‐week treatment. (F) Quantification of heart weight to body weight ratio in each group. (G) Quantification of WGA staining images. Quantitative data are presented as the mean ± SEM. (H1―7) Measurements of left ventricular anterior wall end systolic thicknesses (LVAW;s), left ventricular anterior wall end diastolic thicknesses (LVAW;d), left ventricular posterior wall end systolic thicknesses (LVPW;s), and left ventricular posterior wall end diastolic thicknesses (LVPW;d), left ventricular mass (LV mass), ejection fraction (EF), and fractional shortening (FS). n = 6. Data are presented as mean ± SEM. *p < 0.05, **p < 0.01, ***p < 0.001 versus Myh6R404Q + Veh group by one‐way ANOVA.
FIGURE 4
FIGURE 4
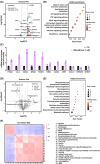
Omic analysis of AngII‐induced hypertrophic after co‐treatment. (A) Volcano plot of the transcriptome showing the significantly up‐regulated and down‐regulated genes. (B) KEGG pathway enrichment analysis of differentially expressed transcripts. (C) Quantitative real‐time PCR analysis of the mRNA expression of PTGS2, CCL2, INHBA, BPGM, PDGFB, THBS1, CXCR4, GPX1, CXCL11, TNFRSF9, IGFBP3 in AC16 cells at 24 h after the co‐treatment. Normalized to 36B4 expression. n = 6. Data are presented as mean ± SEM. *p < 0.05, **p < 0.01, ***p < 0.001 versus control group by two‐tailed Student's test. (D) Volcano plot for changed metabolite in cardiomyocytes at 24 h after co‐treatment. Red represented the upregulated metabolites and blue represented the downregulated metabolites. (E) KEGG pathway enrichment analysis of differentially changed metabolites. (F) Clustering heat map for 22 differential metabolites.
FIGURE 5
FIGURE 5
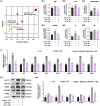
Co‐treatment of SE and Harmine inhibited glycolysis metabolism in AngII‐induced hypertrophic cells. (A) Joint pathway analysis of metabolites and transcripts that significantly changed in AC16 by MetaboAnalyst. (B) Quantitative analysis of G6P, ATP, NAD+/NADH ratio, GAPDH activity, pyruvate (PA) and lactic acid (LA). n = 6. (C) Quantitative real‐time PCR analysis of the mRNA expression of glycolysis targeted genes G6PD, HK1, PFKM, PGK1, ENO1, PKM2, LDHA and LDHB after co‐treatment of SE and Harmine. Normalized to 36B4 expression, n = 6. (D) Western blot analysis demonstrating the protein expression levels of glycolysis pathway markers GLUT1, GLUT4, HEKII, PFKFB3 and PKM2 in cardiomyocytes, normalized to β‐Actin expression. n = 3. Data are presented as mean ± SEM. *p < 0.05, **p < 0.01, ***p < 0.001 versus AngII group by one‐way ANOVA.
FIGURE 6
FIGURE 6
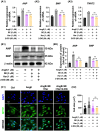
Co‐treatment of SE and Harmine attenuates AngII‐induced hypertrophic via glycolysis pathway. (A) Quantitative real‐time PCR analysis showing the expression levels of hypertrophic markers ANP, BNP, and TNNT2 in cardiomyocytes, normalized to 36B4 expression. n = 6. (B) Western blot analysis demonstrating the protein expression levels of hypertrophic markers ANP and BNP in cardiomyocytes, normalized to β‐Actin expression. n = 3. (C) Representative immunofluorescence images of MYH7‐stained for sarcomere marker (green) and DAPI (blue) for nuclei of AC16. Scale bar = 40 μm. Data are presented as mean ± SEM. *p < 0.05, **p < 0.01, ***p < 0.001 versus AngII group by one‐way ANOVA.
FIGURE 7
FIGURE 7
Glycolysis inhibition as atherapeutic strategy for AngII‐induced cardiac hypertrophy. (A) Quantitativeanalysis of G6P, ATP, NAD+/NADH ratio, GAPDH activity, PA and LA. n = 6. (B) Quantitative real‐time PCR analysis of the mRNA expression ofglycolysis targeted genes G6PD, HK1, PFKM, PGK1, ENO1, PKM2, LDHA and LDHBafter co‐treatment of SE and Harmine in AngII induced AC16 cells for 24 h. Normalized to 36B4 expression, n = 6. (C) Western blot analysis demonstrating the protein expression levels ofglycolysis pathway markers GLUT1, GLUT4, HEKII, PFKFB3, and PKM2 incardiomyocytes, normalized to β‐actin expression. n = 3. Data are presented asmean±SEM. *p < 0.05, **p < 0.01,***p < 0.001 versus AngII group by one‐way ANOVA.

Similar articles

Cited by

References

    1. Huang J, Liu Y, Chen JX, Lu XY, Chen HY. Harmine is an effective therapeutic small molecule for the treatment of cardiac hypertrophy. Acta Pharmacol Sin. 2022;43:50‐63. - PMC - PubMed
    1. Hill JA, Olson EN. Cardiac plasticity. N Engl J Med. 2008;358(13):1370‐1380. - PubMed
    1. Bernardo BC, Weeks KL, Pretorius L, Mcmullen JR. Molecular distinction between physiological and pathological cardiac hypertrophy: experimental findings and therapeutic strategies. Pharmacol Ther. 2010;128(1):191‐227. - PubMed
    1. Waki H, Park KW, Mitro N, et al. The small molecule harmine is an antidiabetic cell‐type‐specific regulator of PPARgamma expression. Cell Metab. 2007;5(5):357‐370. - PubMed
    1. Ruan W, Ji X, Qin Y, et al. Harmine alleviated sepsis‐induced cardiac dysfunction by modulating macrophage polarization. Front Cell Dev Biol. 2021;9:792257. - PMC - PubMed

LinkOut - more resources