. 2024 Aug 13;134(19):e178604.
doi: 10.1172/JCI178604.

Genomic and transcriptomic features of androgen receptor signaling inhibitor resistance in metastatic castration-resistant prostate cancer

Affiliations

Genomic and transcriptomic features of androgen receptor signaling inhibitor resistance in metastatic castration-resistant prostate cancer

Xiaolin Zhu et al. J Clin Invest. .

Abstract

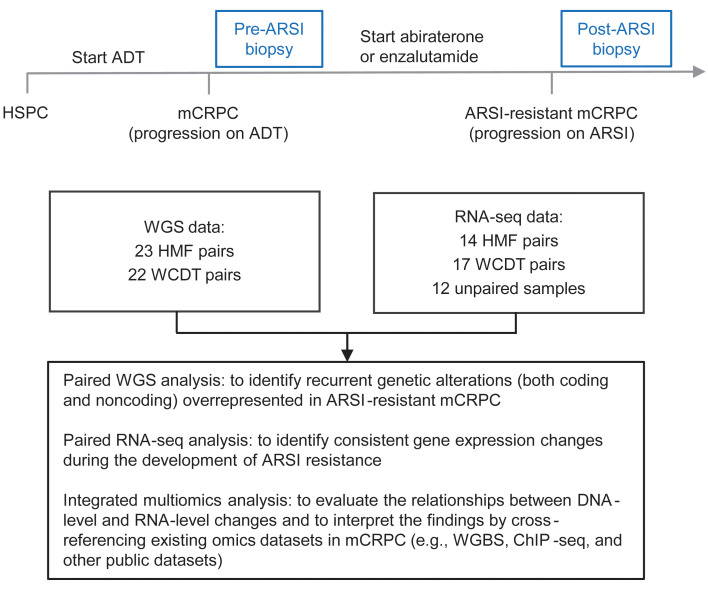
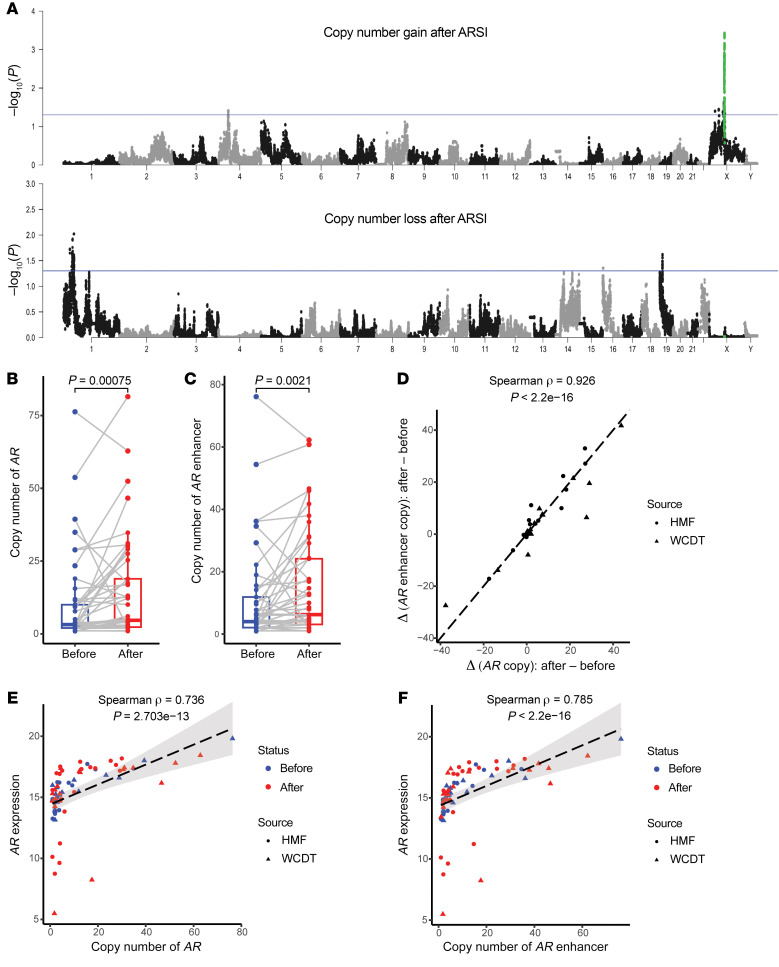
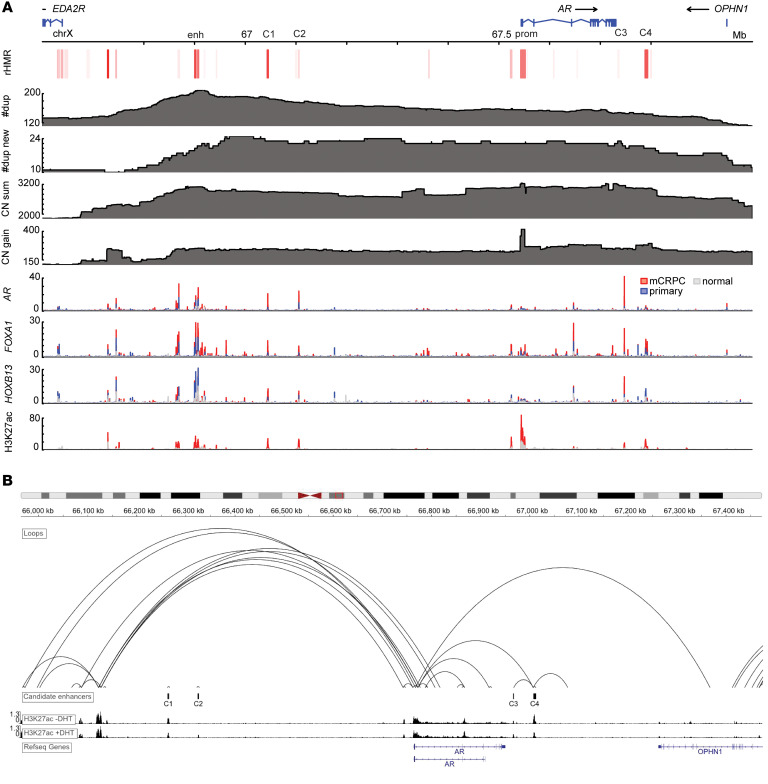
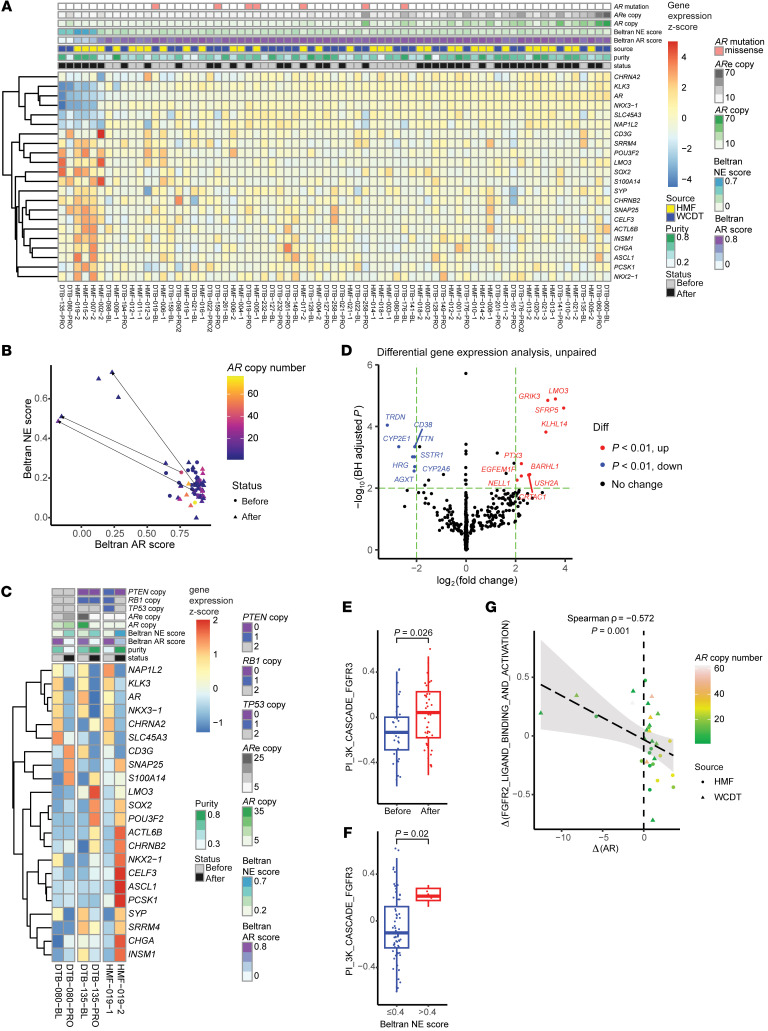
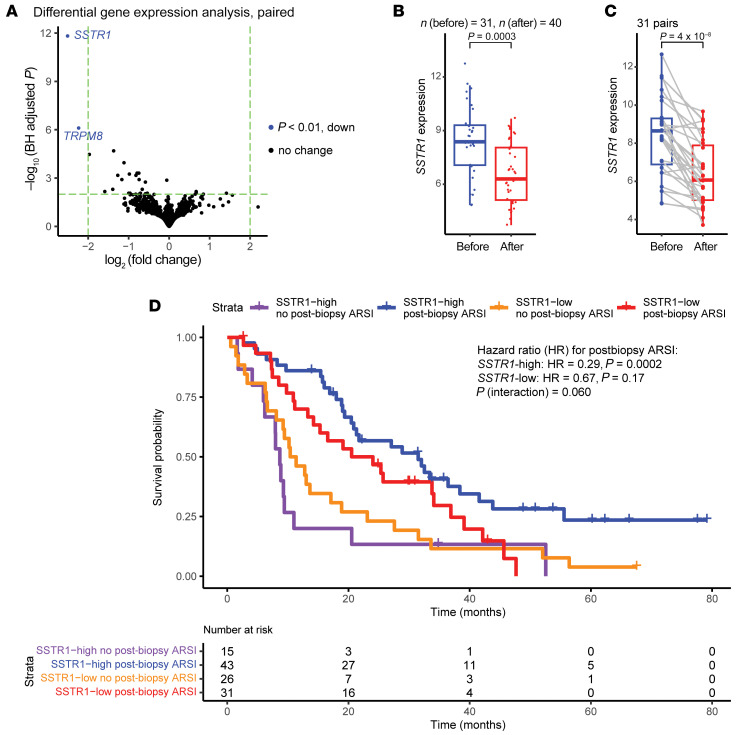
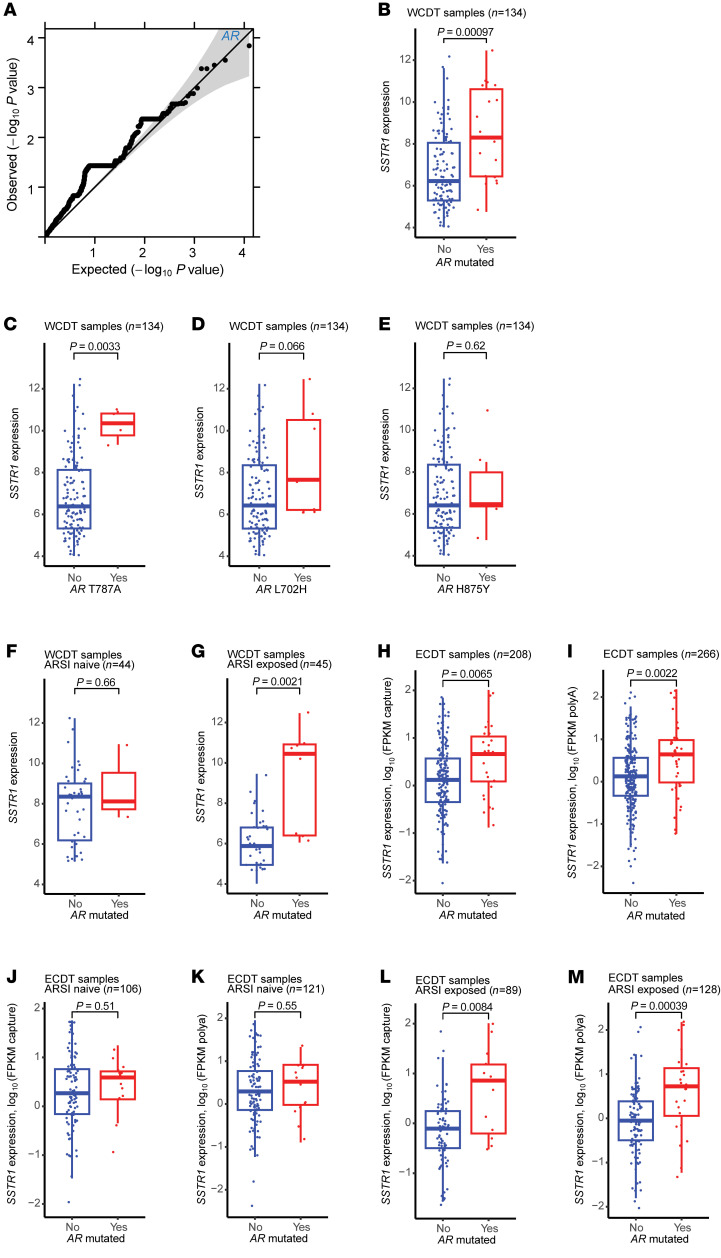
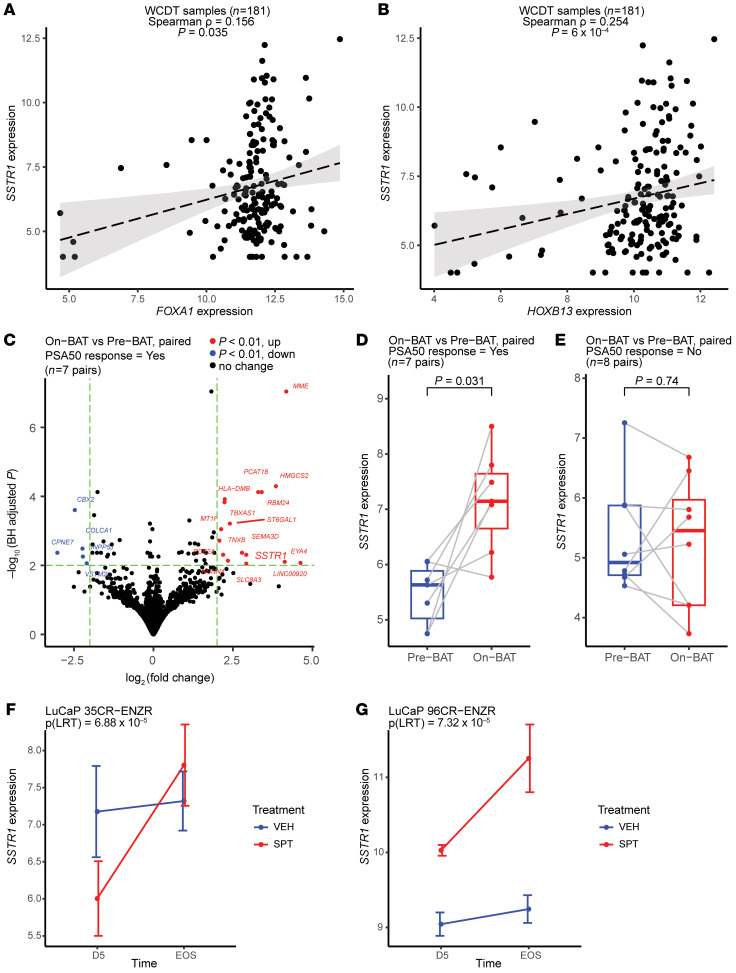
BACKGROUNDAndrogen receptor signaling inhibitors (ARSIs) have improved outcomes for patients with metastatic castration-resistant prostate cancer (mCRPC), but their clinical benefit is limited by treatment resistance.METHODSTo investigate the mechanisms of ARSI resistance, we analyzed the whole-genome (n = 45) and transcriptome (n = 31) sequencing data generated from paired metastatic biopsies obtained before initiation of first-line ARSI therapy for mCRPC and after radiographic disease progression. We investigated the effects of genetic and pharmacologic modulation of SSTR1 in 22Rv1 cells, a representative mCRPC cell line.RESULTSWe confirmed the predominant role of tumor genetic alterations converging on augmenting androgen receptor (AR) signaling and the increased transcriptional heterogeneity and lineage plasticity during the emergence of ARSI resistance. We further identified amplifications involving a putative enhancer downstream of the AR and transcriptional downregulation of SSTR1, encoding somatostatin receptor 1, in ARSI-resistant tumors. We found that patients with SSTR1-low mCRPC tumors derived less benefit from subsequent ARSI therapy in a retrospective cohort. We showed that SSTR1 was antiproliferative in 22Rv1 cells and that the FDA-approved drug pasireotide suppressed 22Rv1 cell proliferation.CONCLUSIONOur findings expand the knowledge of ARSI resistance and point out actionable next steps, exemplified by potentially targeting SSTR1, to improve patient outcomes.FUNDINGNational Cancer Institute (NCI), NIH; Prostate Cancer Foundation; Conquer Cancer, American Society of Clinical Oncology Foundation; UCSF Benioff Initiative for Prostate Cancer Research; Netherlands Cancer Institute.

Keywords: Oncology; Prostate cancer.


Conflict of interest statement

Conflict of interest: AF reports personal fees from Varian Medical Systems. RA reports grants from Janssen, Amgen, Zenith Epigenetics, and Xynomic Pharmaceuticals; grants and personal fees from AstraZeneca, Merck, and Novartis; and personal fees from Dendreon, Elsevier, Exelixis, Jubilant Therapeutics, Bayer, Pfizer, and Alessa Therapeutics. ES reports other support from Fortis, Harpoon, Teon, Janssen, Johnson & Johnson, and Ultragenyx. MSVDH received research funding from Bristol Myers Squibb, AstraZeneca, 4SC, and Roche, and consultancy fees from Bristol Myers Squibb, Roche, Merck Sharp & Dohme, Merck, AstraZeneca, Pfizer, Janssen, and Seattle Genetics, which were all paid to the Netherlands Cancer Institute. FF reports personal fees from Janssen Oncology, Bayer, PFS Genomics, Myovant Sciences, Roivant Sciences, Astellas Pharma, Foundation Medicine, Varian, Bristol Myers Squibb, Exact Sciences, Clearnote Health, Novartis, and Tempus and other support from Serimmune and Artera.

Figures

Figure 1
Figure 1. Overview of study design and analysis.
Paired metastatic biopsies were obtained for patients with mCRPC before the initiation of an ARSI (pre-ARSI) and after radiographic progression on the ARSI (post-ARSI). Two cohorts (WCDT and HMF) were merged, with batch effects corrected as appropriate before downstream analysis. A total of 45 WGS pairs were analyzed, and for a subset of them, RNA-Seq data were successfully generated and analyzed.
Figure 2
Figure 2. The AR locus is the major genetic substrate of converging evolution under ARSI-induced selective pressure.
(A) Amplification of AR and its flanking sequences stood out as the predominant signal in genome-wide copy number analysis. The human genome was partitioned into 1 kb consecutive bins, and association tests were performed for each bin against the null hypotheses of (a) no pair gaining 1 or more copies after progression on ARSIs (top panel) and (b) no pair losing 1 or more copies thereof (bottom panel), respectively. P values were calculated using the paired Wilcoxon test for the 45 WGS pairs. x axis: chromosomal location with chromosomes numbered; y axis: –log10 (P value). Each dot represents an association test P value (–log10-transformed) for a given genomic bin, and 2 alternating colors (gray and black) were used to facilitate the visualization of genomic bins of consecutive chromosomes. The blue horizontal line in each panel indicates the threshold of nominal statistical significance (P < 0.05) to aid the visualization of potential hits. The AR locus (AR gene ±1 Mb flanking regions) is labeled in green. (B and C) mCRPC continues to acquire additional copies of AR and its upstream enhancer, reported by Quigley et al. (5), while developing ARSI resistance. P values were calculated using the paired Wilcoxon test (n = 45). (D) Copy number gains of AR and its upstream enhancer were highly correlated. (E and F) Higher AR and upstream enhancer copy numbers were correlated with higher AR mRNA levels.
Figure 3
Figure 3. A putative enhancer downstream of AR is amplified after ARSI therapy.
(A) Overlaying multiomics sequencing data revealed potential functional elements (C1–C4) flanking AR associated with ARSI resistance. enh, the known enhancer upstream of AR reported by Quigley et al. (5); prom, AR promoter; C1–C4, candidate functional elements (C1: chrX: 67043000-67046000; C2: chrX: 67104300-67106900; C3: chrX: 67746500-67748100; C4: chrX: 67787800-67793300; hg38); rHMR, recurrent hypomethylated regions in 100 mCRPC biopsies identified using WGBS reported by Zhao et al. (36) (redness indicates the frequency of recurrence); #dup, total number of TD events overlapping each base pair, identified by WGS of 201 mCRPC biopsies (n = 156 WCDT and n = 45 HMF samples); #dup new, total number of TD events overlapping each base pair, newly emerging after progression of disease on ARSIs, identified by WGS of 45 paired mCRPC biopsies; CN sum, copy number per base pair summed over the 201 mCRPC biopsies; CN gain, copy number gain (after ARSI – before ARSI) summed over the 45 paired mCRPC biopsies. Bottom 4 tracks show ChIP-Seq data for AR, FOXA1, HOXB13, and H3K27ac generated in normal prostate epithelium, primary PCa, and mCRPC, respectively (37). (B) HiChIP of H3K27ac in LNCaP cells (data were generated by Giambartolomei et al., ref. 40) demonstrates evidence of chromatin looping between C4 and the AR promoter.
Figure 4
Figure 4. Transcriptomics analyses comparing mCRPC tumors before and after ARSIs.
(A) Heatmap of the 22 genes used to subtype mCRPC by Labrecque et al. (11), sorted by AR expression. Both extremes of the AR expression spectrum were enriched with ARSI-resistant tumors, indicating diverging changes. ARe, upstream AR enhancer reported by Quigley et al. (5). (B) Scatter plot of AR and NE scores calculated per Beltran et al. (9). Directed line segments indicate the 3 pairs showing a clear post-ARSI phenotypic switch, 2 of which (the 2 WCDT pairs) were also reported by Westbrook et al. (13). All 5 NE-high samples are post-ARSI samples without a high AR copy number. (C) Focused heatmap of the 3 phenotypic converters in B highlights the transcriptional heterogeneity within this group. (D) Unpaired DGE analysis identified relevant genes involved in ARSI-resistant tumors, including LMO3 (a NE TF and 1 of the 22 Labrecque genes) and the Wnt signaling regulator SFRP5 (Wald test, DESeq2). diff, differential. (E) Unpaired DGE analysis of Reactome pathways highlighted that FGFR pathways were among the most upregulated in ARSI-resistant mCRPC (Wilcoxon test). (F) FGFR3 pathway activity was higher in mCRPC tumors with a high NE score (>0.4 as defined by Beltran et al. [ref. 9]; Wilcoxon test) (G) Changes in the FGFR2 pathway and AR expression were anticorrelated.
Figure 5
Figure 5. Decreased SSTR1 mRNA in ARSI-resistant mCRPC.
(A) Paired DGE analysis identifies SSTR1 as the most significantly altered gene after ARSI therapy (Wald test, DESeq2). BH, Benjamini-Hochberg procedure. (B) SSTR1 mRNA decreased, while mCRPC developed ARSI resistance in an unpaired analysis using all 71 RNA-Seq samples (Wilcoxon test). (C) SSTR1 downregulation was consistently observed after ARSI across 31 paired samples (paired Wilcoxon test). (D) High SSTR1 expression was associated with survival benefit in 115 WCDT patients who received ARSIs following the biopsy (Wald test).
Figure 6
Figure 6. AR mutations are associated with higher SSTR1 mRNA in ARSI-exposed mCRPC.
(A) Quantile-quantile plot of P values (t test as implemented in the linear regression model) shows AR to be the gene most significantly associated with SSTR1 mRNA expression. (B) AR-mutated mCRPC had higher SSTR1 expression in the WCDT. (CE) Single-mutation analysis in WCDT samples demonstrated T878A to be the main contributor to the gene-level association, with L702H and H875Y showing trends in the same direction. (F and G) AR-mutated status predicted higher SSTR1 expression only in ARSI-exposed tumors in the WCDT dataset. (H and I) The positive association between AR mutation status and SSTR1 mRNA was replicated in the ECDT dataset, where analyses were stratified by the RNA-Seq method (capture vs. polyA). (JM) Similarly, in the ECDT dataset, AR-mutated status predicted higher SSTR1 expression in ARSI-exposed, but not ARSI-naive, mCRPC. All P values were calculated using the Wilcoxon test for BM.
Figure 7
Figure 7. SSTR1 is potentially regulated by the AR/FOXA1/HOXB13 transcription machinery, and its upregulation is associated with tumor response to high-dose testosterone.
(A and B) FOXA1 and HOXB13 were each coexpressed with SSTR1 in the WCDT cohort. (C and D) SSTR1 is one of the most significantly upregulated genes in mCRPC tumors that responded to BAT from the COMBAT-CRPC trial (data from Sena et al.; ref. 67). (E) Conversely, no change in SSTR1 expression was observed in tumors without a PSA50 response. (F and G) Echoing findings in patients, SPT suppressed mCRPC tumor growth in 2 enzalutamide-resistant PDX models, LuCaP 35CR-ENZR and LuCaP 96CR-ENZR; in both models, SSTR1 expression was upregulated after SPT. D5, day 5 after SPT; EOS, end of study, as reported by Lam et al. (68); VEH, vehicle; LRT, likelihood ratio test. P values in C were calculated using the Wald test (DESeq2); P values in D and E were calculated using the paired Wilcoxon test.

References

    1. Sandhu S, et al. Prostate cancer. Lancet. 2021;398(10305):1075–1090. doi: 10.1016/S0140-6736(21)00950-8. - DOI - PubMed
    1. Schmidt KT, et al. Resistance to second-generation androgen receptor antagonists in prostate cancer. Nat Rev Urol. 2021;18(4):209–226. doi: 10.1038/s41585-021-00438-4. - DOI - PubMed
    1. Gillessen S, et al. Management of patients with advanced prostate cancer. Part I: Intermediate-/high-risk and locally advanced disease, biochemical relapse, and side effects of hormonal treatment: Report of the Advanced Prostate Cancer Consensus Conference 2022. Eur Urol. 2023;83(3):267–293. - PMC - PubMed
    1. Visakorpi T, et al. In vivo amplification of the androgen receptor gene and progression of human prostate cancer. Nat Genet. 1995;9(4):401–406. doi: 10.1038/ng0495-401. - DOI - PubMed
    1. Quigley DA, et al. Genomic hallmarks and structural variation in metastatic prostate cancer. Cell. 2018;174(3):758–769. doi: 10.1016/j.cell.2018.06.039. - DOI - PMC - PubMed

MeSH terms