. 2025 Mar;62(3):3903-3917.
doi: 10.1007/s12035-024-04480-2. Epub 2024 Oct 1.

Chronically Low NMNAT2 Expression Causes Sub-lethal SARM1 Activation and Altered Response to Nicotinamide Riboside in Axons

Affiliations

Chronically Low NMNAT2 Expression Causes Sub-lethal SARM1 Activation and Altered Response to Nicotinamide Riboside in Axons

Christina Antoniou et al. Mol Neurobiol. 2025 Mar.

Abstract

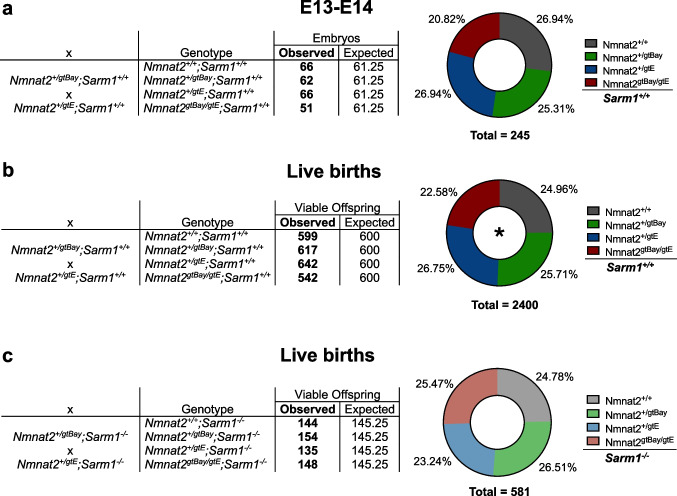
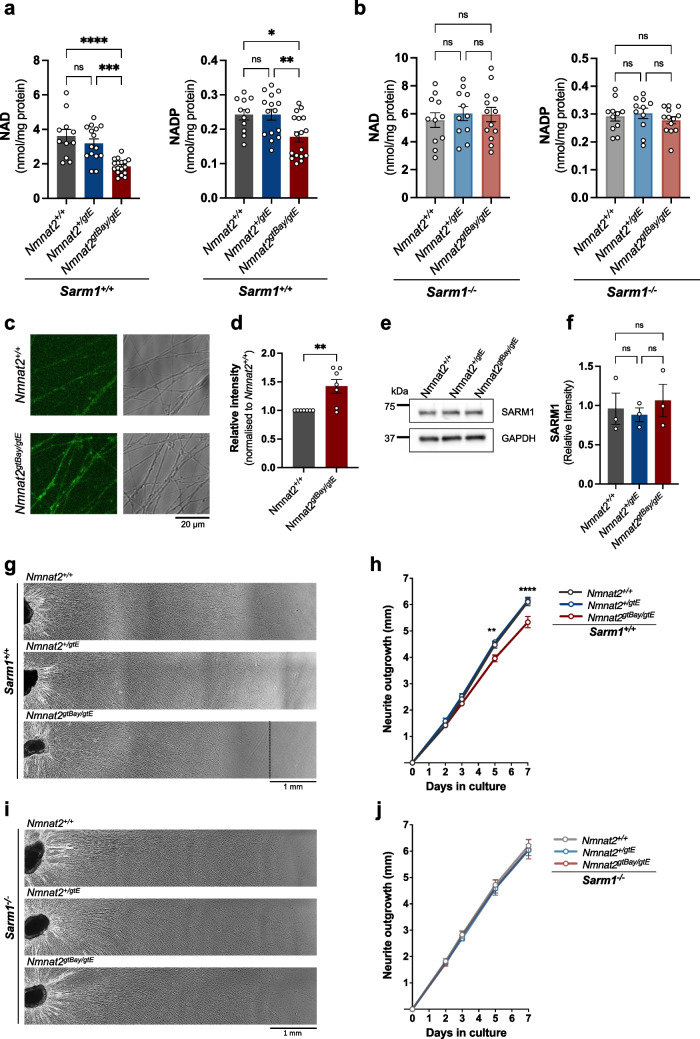
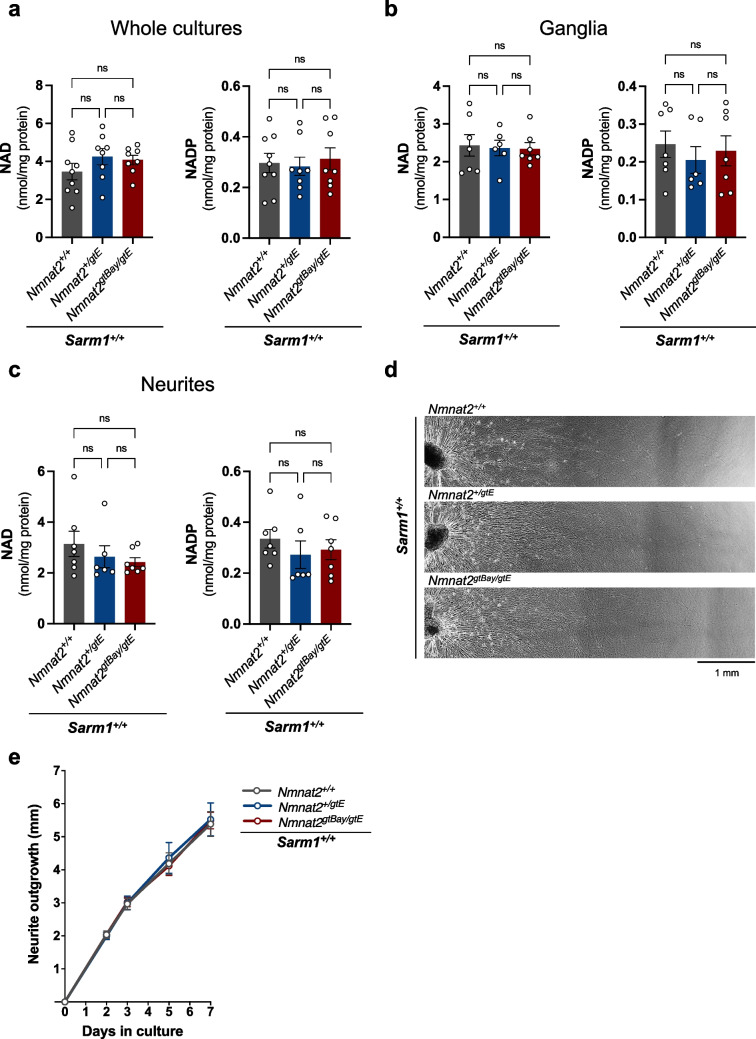
Nicotinamide mononucleotide adenylyltransferase 2 (NMNAT2) is an endogenous axon survival factor that maintains axon health by blocking activation of the downstream pro-degenerative protein SARM1 (sterile alpha and TIR motif containing protein 1). While complete absence of NMNAT2 in mice results in extensive axon truncation and perinatal lethality, the removal of SARM1 completely rescues these phenotypes. Reduced levels of NMNAT2 can be compatible with life; however, they compromise axon development and survival. Mice born expressing sub-heterozygous levels of NMNAT2 remain overtly normal into old age but develop axonal defects in vivo and in vitro as well as behavioural phenotypes. Therefore, it is important to examine the effects of constitutively low NMNAT2 expression on SARM1 activation and disease susceptibility. Here we demonstrate that chronically low NMNAT2 levels reduce prenatal viability in mice in a SARM1-dependent manner and lead to sub-lethal SARM1 activation in morphologically intact axons of superior cervical ganglion (SCG) primary cultures. This is characterised by a depletion in NAD(P) and compromised neurite outgrowth. We also show that chronically low NMNAT2 expression reverses the NAD-enhancing effect of nicotinamide riboside (NR) in axons in a SARM1-dependent manner. These data indicate that low NMNAT2 levels can trigger sub-lethal SARM1 activation which is detectable at the molecular level and could predispose to human axonal disorders.

Keywords: NAD; NMNAT2; Programmed axon death; SARM1.


Conflict of interest statement

Declarations. Ethics Approval: Animal work was approved by the University of Cambridge and performed in accordance with the Home Office Animal Scientific Procedures Act (ASPA), 1986 under project licence P98A03BF9. Consent to Participate: Not applicable. Consent for Publication: Not applicable. Competing Interests: MPC consults for Nura Bio and Drishti Discoveries and the Coleman group is part funded by AstraZeneca for academic research projects but none of these activities relate to the study reported here.

Figures

Fig. 1
Fig. 1
Absence of SARM1 rescues prenatal lethality in Nmnat2gtBay/gtE mice. a Genotype frequencies of embryos from crosses between Nmnat2+/gtE and Nmnat2+/gtBay mice on a Sarm1+/+ background. The observed embryo frequencies are not significantly different from the expected frequencies: χ2 = 2.461, d.f. = 3, p = 0.4823. b Genotype frequencies of viable offspring from crosses between Nmnat2+/gtE and Nmnat2+/gtBay mice, on a Sarm1+/+ background, combining the live births recorded in our previous study [21] and the current study. The observed birth frequencies are significantly different from expected frequencies: χ2 = 9.030, d.f. = 3, p = 0.0289. c Genotype frequencies of viable offspring from crosses between Nmnat2+/gtE and Nmnat2+/gtBay mice, on a Sarm1−/− background. The observed birth frequencies are not significantly different from the expected frequencies: χ2 = 1.313, d.f. = 3, p = 0.7260. Viable offspring numbers include animals between P0-P3 and post-weaning
Fig. 2
Fig. 2
Absence of SARM1 restores NAD(P) levels and rescues the neurite outgrowth defect in SCG neurons from Nmnat2gtBay/gtE mice. a NAD and NADP levels in SCG explants of the indicated genotypes on a Sarm1+/+ background (mean ± SEM; n = 11–17 pups per genotype; ****p < 0.0001, ***p < 0.001, **p < 0.01, *p < 0.05 and ns (not significant) = p > 0.05, one-way ANOVA with Tukey’s multiple comparisons test). b NAD and NADP levels in SCG explants of the indicated genotypes, all on a Sarm1−/− background (mean ± SEM; n = 11–13 pups per genotype; ns (not significant) = p > 0.05, one-way ANOVA with Tukey’s multiple comparisons test). For ab, cultures were collected at DIV7. c Representative images of Nmnat2+/+ and Nmnat2gtBay/gtE SCG neurons (on a Sarm1+/+ background) 30 min after incubation with PC6 (50 μM). d Quantification of fluorescence intensity of PAD6 in Nmnat2+/+ and Nmnat2gtBay/gtE SCG neurites (on a Sarm1+/+ background), normalised to Nmnat2+/+ (mean ± SEM; n = 7 with 4 experiments corresponding to the PBS controls from supplementary Fig. 2; **p < 0.01, unpaired t-test). e Representative immunoblot of SCG neurite extracts of the indicated genotypes (Sarm1+/+) probed for SARM1 and GAPDH (loading control). Cultures were collected at DIV7. f Quantification of normalised SARM1 levels (to GAPDH) in SCG neurite extracts for the indicated genotypes (Sarm1+/+) (mean ± SEM; n = 3; ns (not significant) = p > 0.05, one-way ANOVA with Tukey’s multiple comparisons test). g Representative images of neurite outgrowth at DIV7 in SCG explant cultures of the indicated genotypes on a Sarm1+/+ background. h Quantification of neurite outgrowth in SCG explant cultures of the indicated genotypes on a Sarm1+/+ background, between DIV0 and DIV7 (mean ± SEM; n = 8–9 pups per genotype; ****p < 0.0001 and **p < 0.01, two-way repeated measures ANOVA with Tukey’s multiple comparisons test for between genotype effects at each time point. Significance is shown for the Nmnat2+/+ vs Nmnat2gtBay/gtE comparison). i Representative images of neurite outgrowth at DIV7 in SCG explant cultures of the indicated genotypes on a Sarm1−/− background. j Quantification of neurite outgrowth in SCG explant cultures of the indicated genotypes on a Sarm1−/− background, between DIV0 and DIV7 (mean ± SEM; n = 7 pups per genotype; ns (not significant) = p > 0.05, two-way repeated measures ANOVA with Tukey’s multiple comparisons test for between genotype effects at each time point)
Fig. 3
Fig. 3
No NAD(P) depletion or neurite outgrowth defect in DRG neurons from Nmnat2gtBay/gtE mice. a NAD and NADP levels in DRG whole explant cultures of the indicated genotypes on a Sarm1+/+ background (mean ± SEM; n = 8–9 embryos per genotype; ns (not significant) = p > 0.05, one-way ANOVA with Tukey’s multiple comparisons test). b NAD and NADP levels in DRG ganglia of the indicated genotypes on a Sarm1+/+ background (mean ± SEM; n = 6–7 embryos per genotype; ns (not significant) = p > 0.05, one-way ANOVA with Tukey’s multiple comparisons test). c NAD and NADP levels in DRG neurites of the indicated genotypes on a Sarm1+/+ background (mean ± SEM; n = 6–7 embryos per genotype; ns (not significant) = p > 0.05, one-way ANOVA with Tukey’s multiple comparisons test). For ac cultures were collected at DIV7. d Representative images of neurite outgrowth at DIV7 in DRG explant cultures of the indicated genotypes on a Sarm1+/+ background. e. Quantification of neurite outgrowth in DRG explant cultures of the indicated genotypes on a Sarm1+/+ background, between DIV0 and DIV7 (mean ± SEM; n = 3–4 embryos per genotype; ns (not significant) = p > 0.05, two-way repeated measures ANOVA with Tukey’s multiple comparisons test for between genotype effects at each time point)
Fig. 4
Fig. 4
Higher NMNAT2 to NAMPT ratio in DRG vs SCG neurons. a Pathway of NAD synthesis from precursor NAM and NAD consumption by SARM1. b Representative immunoblot of wild-type SCG and DRG extracts probed for NAMPT, NMNAT2, SARM1 and GAPDH (loading control). Cultures were collected at DIV7. c NMNAT2:NAMPT ratio (mean ± SEM; n = 3; *p < 0.05, paired t-test). d-f Quantification of NAMPT, NMNAT2 and SARM1 levels normalised to GAPDH (mean ± SEM; n = 3; **p < 0.01 and ns (not significant) = p > 0.05, paired t-test)
Fig. 5
Fig. 5
NR causes SARM1-dependent NAD depletion in SCG neurites from Nmnat2gtBay/gtE mice. a Timeline of NR (2 mM) or PBS administration and collection of SCG cultures. b NAD levels in whole SCG explants of the indicated genotypes on a Sarm1+/+ background (mean ± SEM; n = 5; *p < 0.05 and ns (not significant) = p > 0.05, multiple paired t-tests for PBS vs NR with Holm-Šídák correction method). c NAD levels in whole SCG explants of the indicated genotypes on a Sarm1−/− background (mean ± SEM; n = 4; **p < 0.01, multiple paired t-tests for PBS vs NR with Holm-Šídák correction method). d Schematic of NMNAT1 and NMNAT2 localisation in neurons and effects of NR administration. e NAD levels in SCG ganglia and neurites of the indicated genotypes on a Sarm1+/+ background (mean ± SEM; n = 4; *p < 0.05, multiple paired t-tests for PBS vs NR with Holm-Šídák correction method). f NAD levels in SCG ganglia and neurites of the indicated genotypes on a Sarm1−/− background (mean ± SEM; n = 3; **p < 0.01 and *p < 0.05, multiple paired t-tests for PBS vs NR with Holm-Šídák correction method). g Representative images of neurite outgrowth at DIV7 in SCG explant cultures of the indicated genotypes on a Sarm1+/+ background after administration of NR (2 mM) or PBS control. h Quantification of neurite outgrowth in SCG explant cultures of the indicated genotypes on a Sarm1+/+ background, between DIV0 and DIV7 (mean ± SEM; n = 5; ns (not significant) = p > 0.05, two-way repeated measures ANOVA with Tukey’s multiple comparisons test for between genotype effects at each time point). i Representative images of neurite outgrowth at DIV7 in SCG explant cultures of the indicated genotypes on a Sarm1−/− background after administration of NR (2 mM) or PBS control. j Quantification of neurite outgrowth in SCG explant cultures of the indicated genotypes on a Sarm1−/− background, between DIV0 and DIV7 (mean ± SEM; n = 3; ns (not significant) = p > 0.05, two-way repeated measures ANOVA with Tukey’s multiple comparisons test for between genotype effects at each time point)

References

    1. Gilley J, Coleman MP (2010) Endogenous Nmnat2 Is an essential survival factor for maintenance of healthy axons. PLoS Biol 8:e1000300. 10.1371/journal.pbio.1000300 - PMC - PubMed
    1. Hicks AN, Lorenzetti D, Gilley J, Lu B, Andersson K-E, Miligan C et al (2012) Nicotinamide mononucleotide adenylyltransferase 2 (Nmnat2) regulates axon integrity in the mouse embryo. PLoS ONE 7:e47869. 10.1371/journal.pone.0047869 - PMC - PubMed
    1. Gilley J, Adalbert R, Yu G, Coleman MP (2013) Rescue of peripheral and CNS axon defects in mice lacking NMNAT2. J Neurosci 33:13410–13424. 10.1523/JNEUROSCI.1534-13.2013 - PMC - PubMed
    1. Gilley J, Orsomando G, Nascimento-Ferreira I, Coleman MP (2015) Absence of SARM1 rescues development and survival of NMNAT2-deficient axons. Cell Rep 10:1974–1981. 10.1016/j.celrep.2015.02.060 - PMC - PubMed
    1. Zhao ZY, Xie XJ, Li WH, Liu J, Chen Z, Zhang B, et al. (2019) A cell-permeant mimetic of NMN activates SARM1 to Produce Cyclic ADP-ribose and induce non-apoptotic cell death. iScience 15:452–66. 10.1016/j.isci.2019.05.001. - PMC - PubMed