. 2024 Oct 1;134(22):e178628.
doi: 10.1172/JCI178628.

Dual targeting macrophages and microglia is a therapeutic vulnerability in models of PTEN-deficient glioblastoma

Affiliations

Dual targeting macrophages and microglia is a therapeutic vulnerability in models of PTEN-deficient glioblastoma

Yang Liu et al. J Clin Invest. .

Abstract

Tumor-associated macrophages and microglia (TAMs) are critical for tumor progression and therapy resistance in glioblastoma (GBM), a type of incurable brain cancer. We previously identified lysyl oxidase (LOX) and olfactomedin like-3 (OLFML3) as essential macrophage and microglia chemokines, respectively, in GBM. Here, single-cell transcriptomics and multiplex sequential immunofluorescence followed by functional studies demonstrate that macrophages negatively correlate with microglia in the GBM tumor microenvironment. LOX inhibition in PTEN-deficient GBM cells upregulates OLFML3 expression via the NF-κB-PATZ1 signaling pathway, inducing a compensatory increase of microglia infiltration. Dual targeting macrophages and microglia via inhibition of LOX and the CLOCK-OLFML3 axis generates potent antitumor effects and offers a complete tumor regression in more than 60% of animals when combined with anti-PD1 therapy in PTEN-deficient GBM mouse models. Thus, our findings provide a translational triple therapeutic strategy for this lethal disease.

Keywords: Brain cancer; Cancer immunotherapy; Macrophages; Oncology.


Conflict of interest statement

Conflict of interest: YL and PC are listed as inventors on a patent (provisional patent application 63/606,528filed by Northwestern) related to targeting the LOX and CLOCK-OLFML3 signaling axis combining with or without anti-PD1 therapy or radiotherapy.

Figures

Figure 1
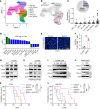
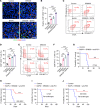
Figure 1. LOX inhibition improves the efficacy of anti-PD1 therapy.
(A) High-resolution uniform manifold approximation and projection (UMAP) dimensional reduction of different subtypes, including mesenchymal-like (MES-like), neural-progenitor-like (NPC-like), astrocyte-like (AC-like) and oligodendrocyte-progenitor-like (OPC-like), of tumor cells from tumors from patients with GBM based on the scRNA-seq dataset (GSE182109). (B) Pattern representing single-cell gene expression of LOX in distinct subtypes of tumor cells based on above scRNA-seq dataset. (C) Percentage MES-like GBM cells out of total GBM cells, and normalized LOX gene expression in different subtypes of malignant cells in tumors from patients with GBM based on above scRNA-seq dataset. (D) GSEA analysis for various types of immune cells in LOX-high (n = 123) and LOX-low (n = 122) patient tumors from the TCGA GBM database. (E and F) IF (E) and quantification (F) of relative CD8+CD69+ T cells in tumors from CT2A tumor-bearing mice treated with or without LOX inhibitor BAPN (2 g/L in drinking water) on day 4. Scale bar: 50 μm. n = 3 independent samples. Student’s t test. (G and H) Immunoblots for PD-L1 and LOX in lysates of U87 (G) and PTEN-KO SF763 (H) cells expressing shRNA control (shC) and LOX shRNAs (shLOX). (I) Immunoblots for PD-L1 in lysates of U87 and PTEN-KO SF763 cells treated with BAPN at indicated concentrations. (J) Immunoblots for PD-L1 in lysates of CT2A cells and 005 GSCs treated with BAPN at indicated concentration. (K and L) Survival curves of C57BL/6J mice implanted with CT2A cells (2 × 10⁴ cells/mouse, K) or 005 GSCs (2 × 10⁵ cells/mouse, L). Mice were treated with BAPN (2 g/L in drinking water) on day 4, and then received the treatment with IgG or anti-PD1 (10 mg/kg body weight, i.p.) on days 11, 14, and 17. n = 5–7 mice per group. Log-rank test. *P < 0.05; **P < 0.01; ***P < 0.001.
Figure 2
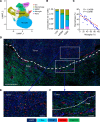
Figure 2. Macrophages negatively related to microglia in GBM tumors.
(A) High-resolution UMAP dimensional reduction of myeloid cells, including macrophages, microglia, monocytes (Mono), dendritic cells (DCs), and myeloid-derived suppressor cells (MDSCs), from tumors from patients with GBM based on the scRNA-seq dataset (GSE182109). (B) Percentage of different types of myeloid cells in tumors of low-grade gliomas (LGG), newly diagnosed GBM (ndGBM) and recurrent GBM (rGBM) based on above scRNA-seq data. (C) Correlation between macrophages and microglia in the GBM TME based on the above scRNA-seq data. Pearson test. (D) Representative image of multiplex sequential immunofluorescence showing the distribution of P2RY12+ microglia, CD163+ macrophages, GFAP+ tumor cells, and CD31+ blood vessels in the tumor edges and tumors from IDH1-WT GBM patients. Scale bar: 500 μm. (E and F) Higher magnified view of CD163+ macrophages and P2RY12+ microglia in the tumor edges and tumors from IDH1-WT GBM patients. Scale bar: 100 μm.
Figure 3
Figure 3. LOX negatively regulates OLFML3 expression and microglia infiltration in GBM.
(A and B) Identification (A) and expression heatmap (B) of 4 overlapping PTEN-LOX axis-regulated genes encoding secreted factors in PTEN-KO versus WT SF763 cells and in LOX shRNA (shLOX) versus shRNA control (shC) U87 cells. Red signal indicates higher expression and blue signal denotes lower expression. (C) Immunoblots for OLFML3 and LOX in lysates of U87 and PTEN-KO SF763 cells expressing shC and shLOX. (D and E) Immunoblots for OLFML3 in lysates of U87 and PTEN-KO SF763 cells (D) and CT2A cells and 005 GSCs (E) treated with BAPN at indicated concentrations. (F and G) Representative images (F) and quantification (G) of relative migration of HMC3 microglia following stimulation with the conditioned media (CM) from U87 cells pretreated with or without BAPN (200 μM). Scale bar: 400 μm. n = 3 independent samples. Student’s t test. (H) Immunoblots for OLFML3 and LOX in lysates of GL261 cells in the presence or absence of LOX overexpression (OE). (I and J) IF (I) and quantification (J) of relative CX3CR1+ microglia (green) in tumors from CT2A-bearing mice treated with or without BAPN (2 g/L in drinking water) on day 4. DAPI (blue). Scale bar: 50 μm. n = 3 independent samples. Student’s t test. (K and L) Representative images (K) and quantification (L) of flow cytometry for the percentage of intratumoral CD45loCD11b+CX3CR1+ microglia in size-matched tumors from CT2A tumor-bearing mice treated with or without BAPN. n = 3 independent samples. Student’s t test. (MP) IF (M) and quantification of relative F4/80+ macrophages (N, green), CX3CR1+ microglia (O, green), and OLFML3+ cells (P, red) in tumors from mice implanted with control and LOX-overexpressed GL261 cells. DAPI (blue). Scale bar: 50 μm. n = 3 independent samples. Student’s t test. *P < 0.05; **P < 0.01; and ***P < 0.001.
Figure 4
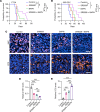
Figure 4. Dual Inhibition of LOX and CLOCK-OLFML3 axis exhibits a potent antitumor effect in GBM mouse models.
(A and B) Survival curves of C57BL/6J mice implanted with CT2A cells (2 × 10⁴ cells/mouse, A) or 005 GSCs (2 × 10⁵ cells/mouse, B). Mice were treated with BAPN on day 4, and/or SR9009 (100 mg/kg/day, i.p) for 10 days beginning at day 7. n = 5–7 mice per group. Log-rank test. (CE) Representative (C) and quantification (D and E) of immunofluorescence staining of Ki67 and cleaved caspase 3 (CC3) in tumors from CT2A-bearing mice treated with or without BAPN and SR9009. Scale bars: 50 μm. n = 3 independent samples. 1-way ANOVA test. *P < 0.05; **P < 0.01; and ***P < 0.001.
Figure 5
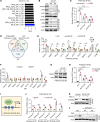
Figure 5. LOX regulates OLFML3 expression through regulating the NF-κB-PATZ1 signaling axis.
(A) GSEA analysis on RNA-seq data of U87 cells with LOX shRNA knockdown (shLOX) versus shRNA control (shC) shows top 10 enriched oncogenic signaling pathways. (B) Immunoblots for P-P65, P65, and LOX in lysates of U87 and PTEN-KO SF763 cells expressing shC and shLOX. (C) Relative mRNA expression of OLFML3 in PTEN-KO SF763 cells expressing shC and shLOX treated with or without P65 inhibitor (P65i) SC75741 (5 μM). n = 3 independent samples. Student’s t test. (D) Identification of 22 overlapping transcription factors (TFs) in TCGA GBM tumors (LOX-low versus -high) and U87 cells (shLOX versus shC). (E) Relative mRNA expression of 10 TFs in PTEN-KO SF763 cells expressing shC and shLOX. n = 3 independent samples. 1-way ANOVA test. (F) Relative mRNA expression of the 10 TFs in U87 cells treated with or without LOX inhibitor BAPN (200 μM). n = 3 independent samples. Student’s t test. (G) Immunoblots for PATZ1 in lysates of PTEN-KO SF763 cells expressing shC and shLOX. (H) Relative mRNA expression of PATZ1 in PTEN-KO SF763 cells expressing shC and shLOX and treated with or without P65i SC75741 (5 μM). n = 3 independent samples. Student’s t test. (I) Schematic of designing ChIP-qPCR primers based on 3 potential binding sites. (J) Quantification of PATZ1 ChIP-qPCR in the OLFML3 promoter of PTEN-KO SF763 cells. IgG was used as the control. n = 3 independent samples. Student’s t test. (K) Immunoblots for OLFML3 in lysates of PTEN-KO SF763 cells with or without PATZ1 overexpression (OE) and treated with or without P65 activator (+). (L) Immunoblots for OLFML3 in lysates of PTEN-WT SF763 cells expressing shC and shPATZ1 treated with or without P65i SC75741 (5 μM). *P < 0.05; **P < 0.01; ***P < 0.001; n.s., not significant (P > 0.05).
Figure 6
Figure 6. Dual Inhibition of LOX and CLOCK-OLFML3 axis activates antitumor immune response and synergizes with anti-PD1 therapy.
(A and B) Immunofluorescence (A) and quantification (B) of relative CD8+CD69+ T cells in tumors from CT2A model (2 × 10⁴ cells/mouse) treated with or without BAPN (2 g/L in drinking water) on day 4, and/or SR9009 (100 mg/kg/day, i.p.) for 10 days beginning at day 7 after orthotopic injection. Scale bar: 50 μm. n = 3 independent samples. 1-way ANOVA test. (C and D) Representative images (C) and quantification (D) of flow cytometry for the percentage of intratumoral CD8+CD69+ T cells in size matched tumors from CT2A tumor–bearing mice treated with or without BAPN (2 g/L in drinking water) on day 4, and/or SR9009 (100 mg/kg/day, i.p.) for 10 days beginning at day 7 after orthotopic injection. n = 3 independent samples. 1-way ANOVA test. (E and F) Representative images (E) and quantification (F) of flow cytometry for the percentage of intratumoral CD8+IFN-γ+ T cells in size matched tumors from CT2A tumor-bearing mice treated with or without BAPN (2 g/L in drinking water) on day 4, and/or SR9009 (100 mg/kg/day, i.p.) for 10 days beginning at day 7 after orthotopic injection. n = 3 independent samples. 1-way ANOVA test. (G and H) Survival curves of C57BL/6J mice implanted with CT2A cells (2 × 10⁴ cells/mouse, G) or 005 GSCs (2 × 10⁵ cells/mouse, H). Mice were treated with BAPN (2 g/L in drinking water) on day 4, SR9009 (100 mg/kg/day, i.p.) for 10 days beginning at day 7 after orthotopic injection, and anti-PD1 (10 mg/kg, i.p.) on days 11, 14, and 17. n = 7–10 mice per group. Log-rank test. (I and J) Cured mice from the triple therapy were rechallenged on day 70 with CT2A cells (2 × 10⁴ cells/mouse, I) or on day 110 with 005 GSCs (2 × 10⁵ cells/mouse, J). Similarly aged naive mice were implanted as controls. n = 5 mice per group. Log-rank test. *P < 0.05; **P < 0.01; ***P < 0.001.

References

    1. Wen PY, et al. Glioblastoma in adults: a Society for Neuro-Oncology (SNO) and European Society of Neuro-Oncology (EANO) consensus review on current management and future directions. Neuro Oncol. 2020;22(8):1073–1113. doi: 10.1093/neuonc/noaa106. - DOI - PMC - PubMed
    1. Tykocki T, Eltayeb M. Ten-year survival in glioblastoma. A systematic review. J Clin Neurosci. 2018;54:7–13. doi: 10.1016/j.jocn.2018.05.002. - DOI - PubMed
    1. Lim M, et al. Current state of immunotherapy for glioblastoma. Nat Rev Clin Oncol. 2018;15(7):422–442. doi: 10.1038/s41571-018-0003-5. - DOI - PubMed
    1. Reardon DA, et al. Effect of nivolumab vs bevacizumab in patients with recurrent glioblastoma: The CheckMate 143 Phase 3 Randomized Clinical Trial. JAMA Oncol. 2020;6(7):1003–1010. doi: 10.1001/jamaoncol.2020.1024. - DOI - PMC - PubMed
    1. Wick W, et al. Lomustine and bevacizumab in progressive glioblastoma. N Engl J Med. 2017;377(20):1954–1963. doi: 10.1056/NEJMoa1707358. - DOI - PubMed

MeSH terms