. 2024 Oct 1;9(21):e167373.
doi: 10.1172/jci.insight.167373.

Sublingual immune cell clusters and dendritic cell distribution in the oral cavity

Affiliations

Sublingual immune cell clusters and dendritic cell distribution in the oral cavity

Yutaka Kusumoto et al. JCI Insight. .

Abstract

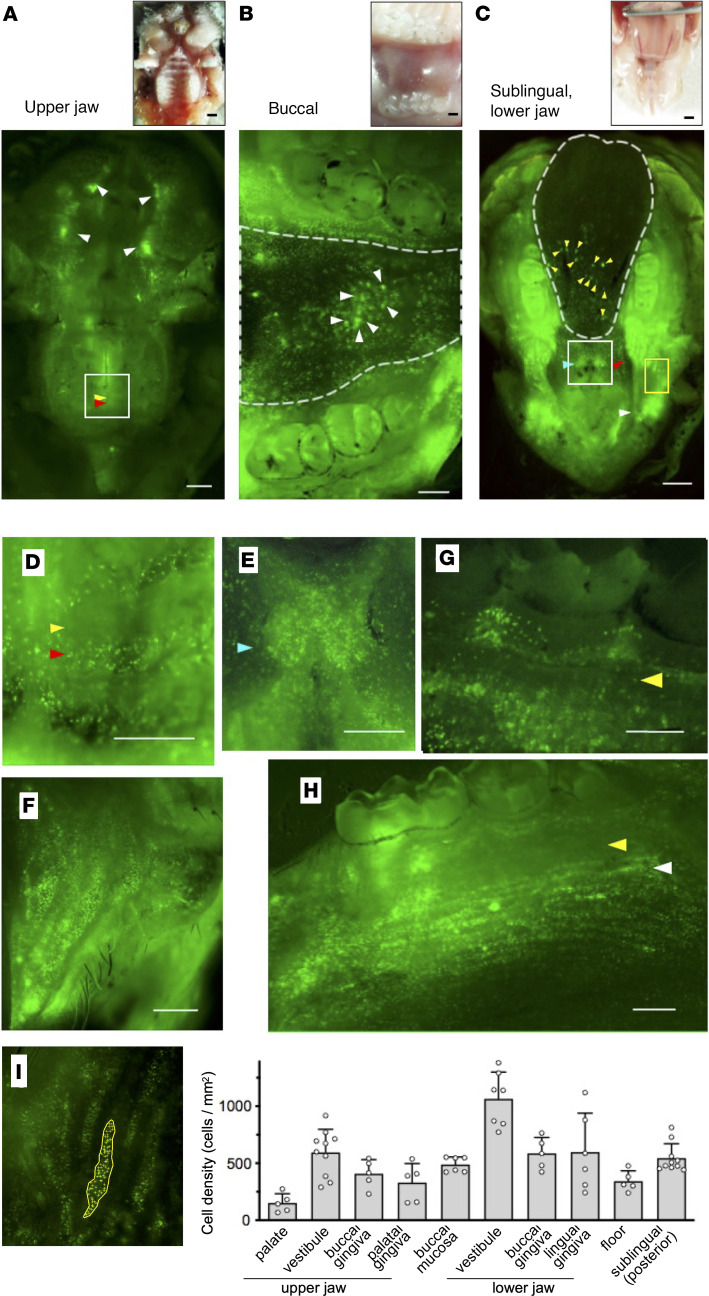
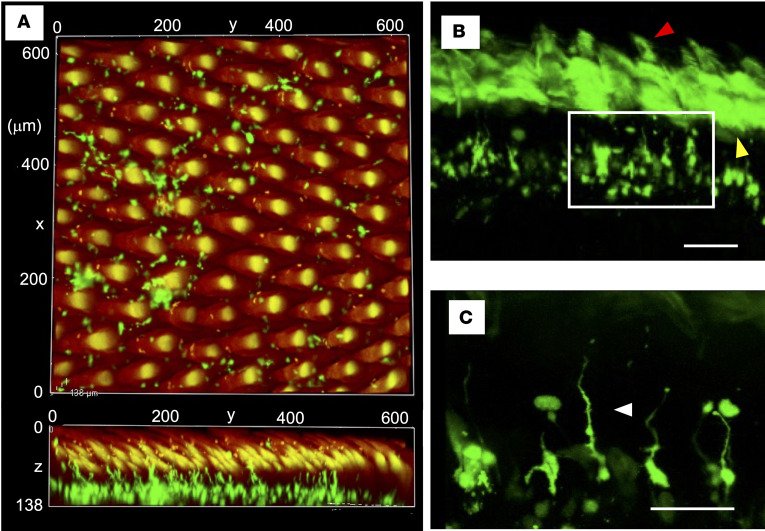
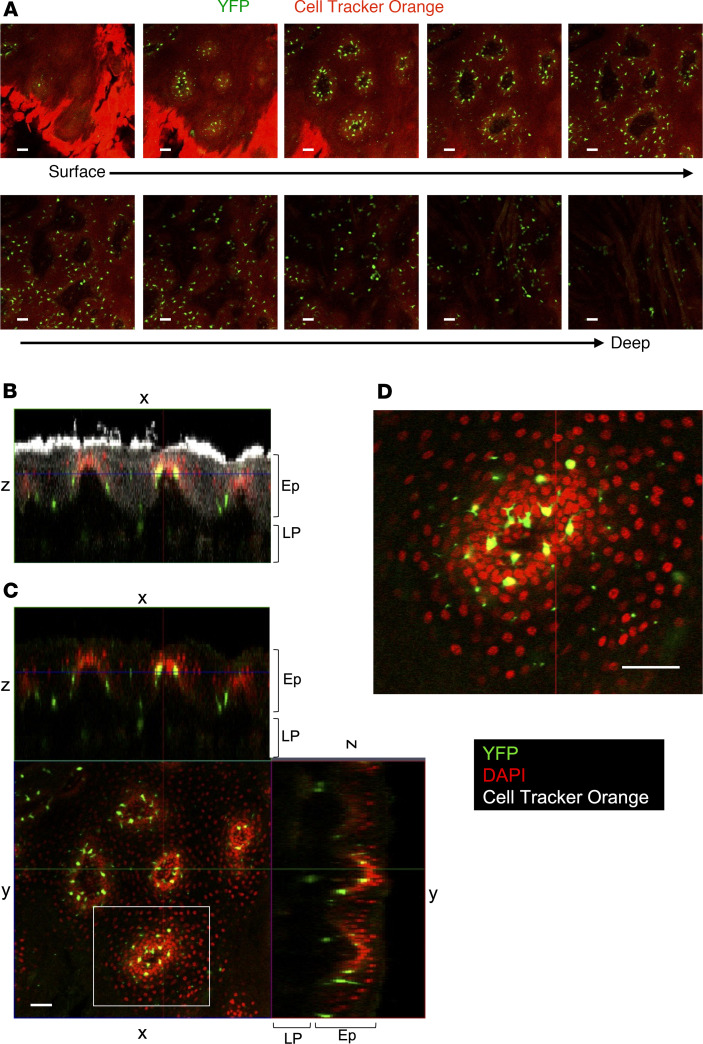
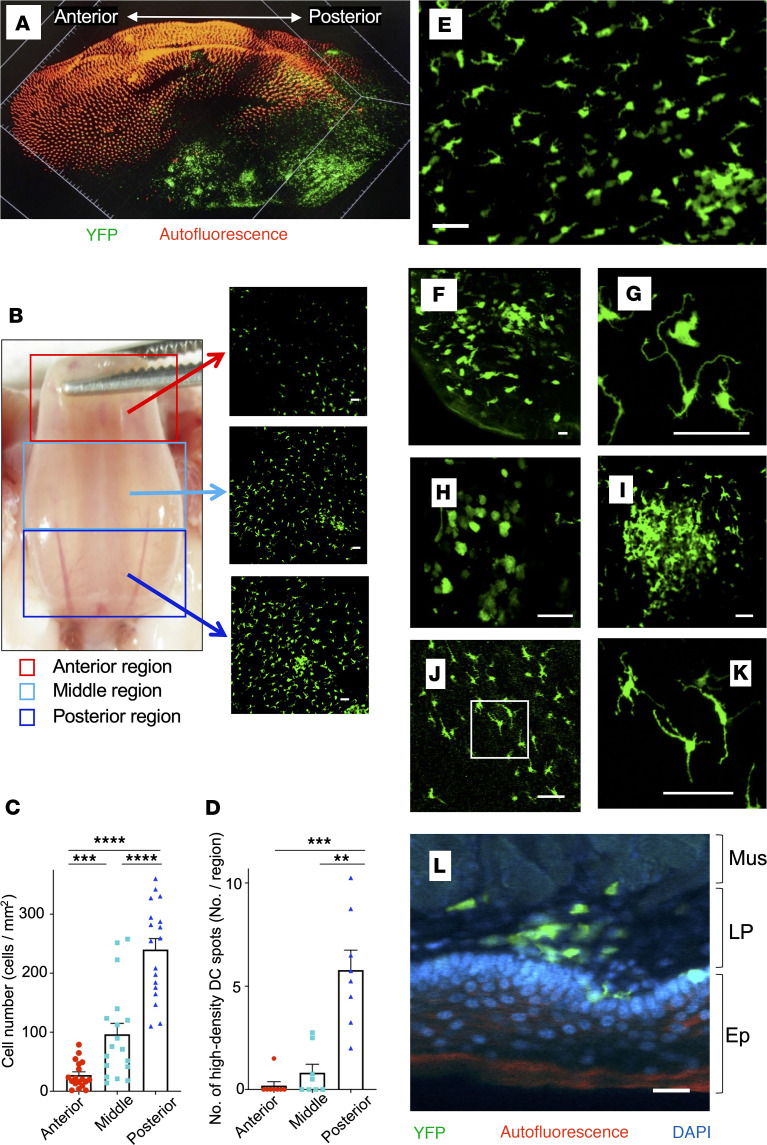
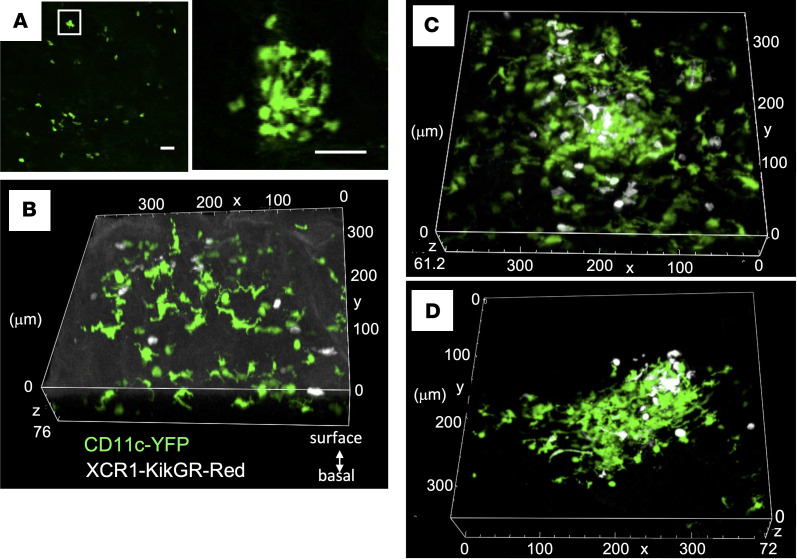
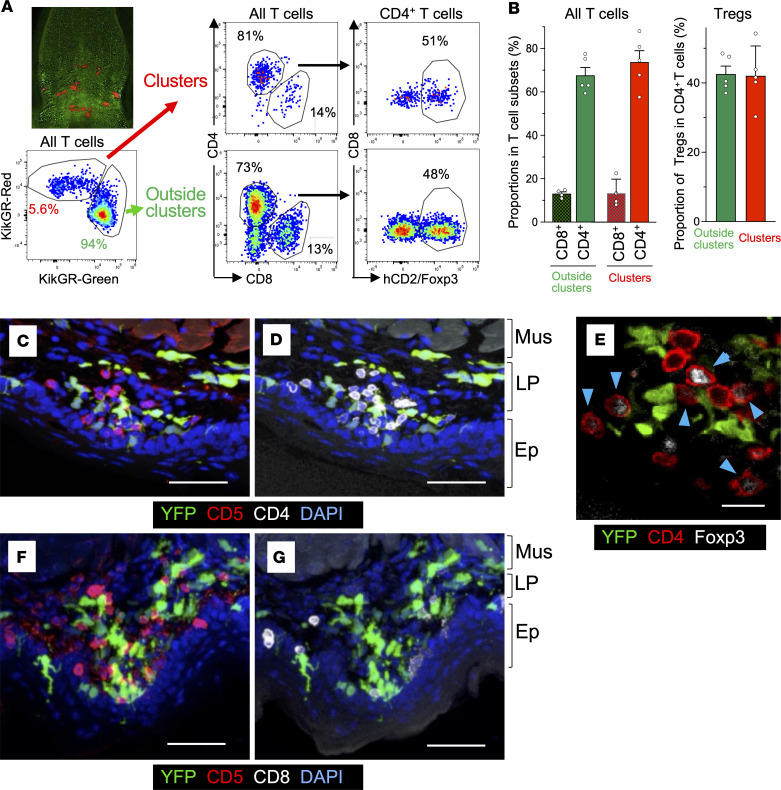
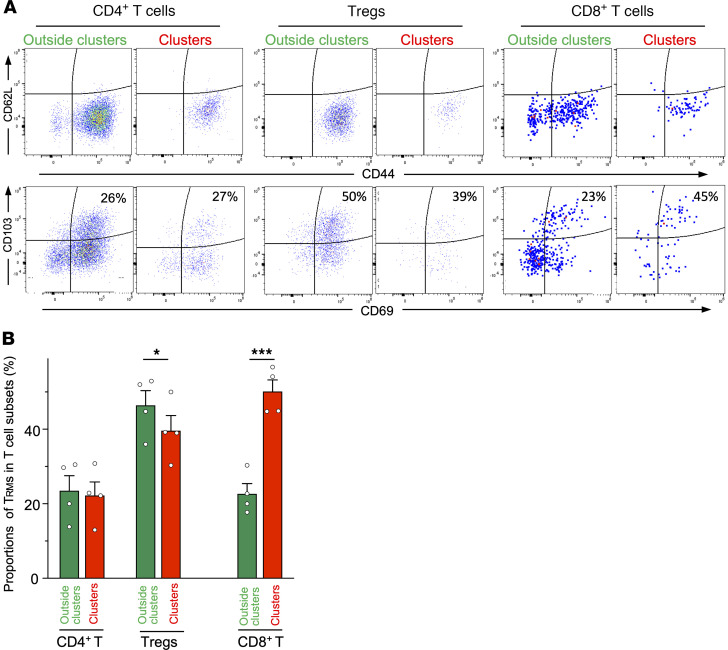
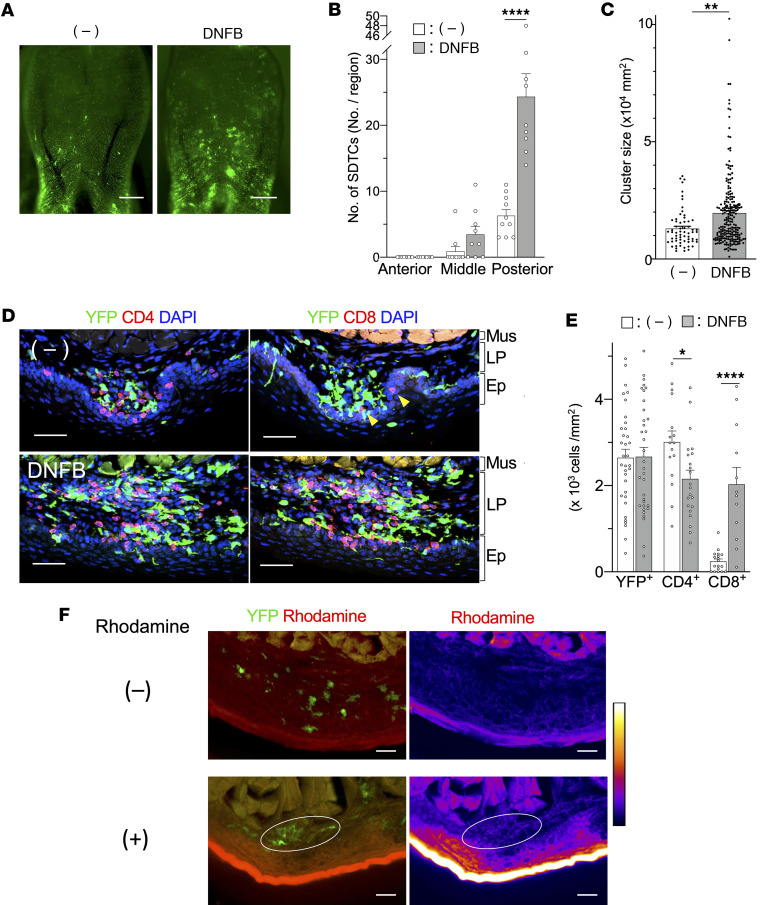
The oral mucosa is the first line of defense against pathogenic bacteria and plays a vital role in maintaining tolerance to food antigens and commensal bacteria. We used CD11c reporter mice to visualize dendritic cells (DCs), a key immune cell population, in the oral cavity. We identified differences in DC density in each oral tissue region. Sublingual immune cell clusters (SLICs) extended from the lamina propria to the epithelium, where DCs and T cells resided in close contact with each other and innate lymphoid cells. Targeted in situ photolabeling revealed that the SLICs comprised mostly CD11c+CD11b+ DCs and were enriched for cDC1s and Langerhans cells. Although the frequency of T cell subsets was similar within and outside the SLICs, tissue-resident memory T cells were significantly enriched within the clusters and cluster size increased in response to inflammation. Collectively, we found that SLICs form a unique microenvironment that facilitates T cell-DC interactions in the steady state and during inflammation. Since the oral mucosa is an important target for needle-free vaccination and sublingual immunotherapy to induce tolerogenic responses, the insight into the localized immunoregulation provided in this study may accelerate the development of these approaches.

Keywords: Dendritic cells; Immunology; T cells.


Conflict of interest statement

Conflict of interest: The authors have declared that no conflict of interest exists.

Figures

Figure 1
Figure 1. Distinct distribution patterns of DCs in the oral cavity of CD11c-YFP mice.
(AC) Bright-field images (upper panels) and fluorescence images (lower panels) acquired using fluorescence stereoscopic microscopy. (A) Upper jaw. White, yellow, and red arrowheads in lower panel point to the oral vestibules, palate folds, and the intermediate region, respectively. (B) Buccal mucosa. The region enclosed by the dotted line indicates the buccal mucosa and arrowheads point to high-density DC spots (lower panel). (C) Sublingual mucosa and oral floor. The region enclosed by the dotted line indicates the sublingual mucosal surface and white, red, and light blue arrowheads point to the vestibules, the alveolar ridge in front of the molars, and the caruncle, respectively (lower panel). Yellow arrowheads point to high-density DC spots in the sublingual region. (DH) Fluorescence images acquired using fluorescence stereoscopic microscopy. (D) Magnified image of the area enclosed in the white box in A. Yellow and red arrowheads point to the palate folds and the intermediate region, respectively. (E) Magnified image of the area enclosed in the white box in C. Light blue arrowhead points to the caruncle. (F) Magnified image of the area enclosed in the yellow box in C. (G) Buccal gingiva. Yellow arrowhead points to the attached gingiva. (H) Lingual gingiva. Yellow and white arrowheads point to the attached gingiva and mucogingival junction, respectively. (I) The number of DCs in each region of the oral cavity in which the DCs accumulated (left) was assessed and calculated as the DC density of each region of the oral cavity (right). Data represent mean ± SEM (n = 5). The data are representative of at least 3 independent experiments. CD11c-YFP is stained green. Scale bars: 1000 μm (A and C) and 500 μm (B and DH).
Figure 2
Figure 2. DCs in the dorsal tongue.
Images of the dorsal tongue acquired using confocal laser microscopy. (A) The posterior dorsal surface of the tissue-cleared tongue was observed. Upper: vertical image. Lower: sagittal image (Supplemental Video 1). (B) The surface of the coronal section of the tissue-cleared tongue was observed. Yellow and red arrowheads in B point to the autofluorescence of epithelium and filiform papillae, respectively. (C) Enlarged image of the area enclosed by the white square in B. Green, CD11c-YFP. Red, autofluorescence. The arrowhead points to the elongated dendrite to the cryptic bottoms on the dorsal surface. Scale bars: 100 μm (B) and 50 μm (C).
Figure 3
Figure 3. Single DCs scattered in the basal layer of rete pegs in the buccal mucosa.
The CD11c+ cells in the buccal mucosa were observed using confocal microscopy. (A) Z-stack images from the mucosal surface to muscle layer. Green, CD11c-YFP. Red, Cell Tracker Orange. (B and C) Orthogonal view of the buccal mucosa: xz image (B) and xz, xy, and yz images (C). (D) High magnification of the image enclosed by the white square in C. Green, YFP. Red, DAPI. White, Cell Tracker Orange. The data are representative of at least 3 independent experiments. Scale bars: 50 μm. LP, lamina propria; Ep, epithelium.
Figure 4
Figure 4. Single DCs and DC clusters in the posterior region of the sublingual mucosa.
(A) Image of the entire tissue-cleared tongue of CD11c-YFP mouse acquired using a light-sheet microscope (orange signal is autofluorescence of surface of tongue). (B) Bright-field (left panel) and fluorescence (right panel) images of the sublingual mucosa of CD11c-YFP mouse. Fluorescence images of the anterior (red square), middle (light-blue square), and posterior (blue square) regions of the sublingual surface. (C and D) Numbers of single DCs and DC clusters in the 3 subdivided regions in B. Data represent mean ± SD, single DCs (n = 18), DC clusters (n = 8). Statistical comparisons were performed using 1-way ANOVA with Tukey’s multiple-comparison test. **P < 0.01; ***P < 0.001; ****P < 0.0001. (EI) Images of tissue-cleared sublingual mucosa of CD11c-YFP mice were acquired using confocal microscopy. Sublingual mucosa (E and F), DCs in the epithelium (G) (Supplemental Video 2), single DCs (H), and a DC cluster (I) (Supplemental Video 3) in the LP. (J and K) Fluorescence images of DCs in the sublingual posterior region in Langerin-Cre/KikGR mice. The white square in J was further magnified and shown in K. (L) Fluorescence image of the coronally cut surface of the sublingual tongue. Green, CD11c-YFP. Red, autofluorescence. Blue, DAPI. The data are representative of at least 3 independent experiments. Scale bars: 50 μm (B and EK) and 25 μm (L). Mus, muscle layer; LP, lamina propria; Ep, epithelium.
Figure 5
Figure 5. DC subsets outside and within sublingual clusters.
(A) Photolabeling of sublingual DC clusters in CD11c-KikGR mouse. KikGR+ clusters in the sublingual region were surrounded with an ROI and irradiated with violet light. (B) Single cells were prepared from sublingual DC clusters labeled with KikGR-Red. (CH) Single-cell suspensions prepared in B were stained with fluorochrome-conjugated antibodies. (C) Representative flow cytometry plots of KikGR+CD11c+ DCs in sublingual mucosa of CD11c-KikGR mice. (D and E) Frequencies of DC subsets in total DCs and in LCs in sublingual mucosa of CD11c-KikGR mice. (F) Representative flow cytometry plots of KikGR+CD11c+ DCs and photolabeled KikGR-Red DCs in clusters and non-photolabeled DCs outside clusters in sublingual mucosa of CD11c-KikGR mice. (G and H) Frequencies of DC subsets in total DCs and in LCs inside or outside clusters of sublingual mucosa of CD11c-KikGR mice. Data in D, E, G, and H represent mean ± SEM (n = 5). Statistical comparisons were performed using 1-way ANOVA with Tukey’s multiple-comparison test. *P < 0.05. The data are representative of at least 3 independent experiments. Scale bars: 50 μm (A) and 500 μm (B).
Figure 6
Figure 6. Distribution of XCR1+ DCs in the sublingual posterior region.
(A) Fluorescence images of XCR1+ DCs in the sublingual posterior region in XCR1-KikGR mice. The white squares in the left panels were further magnified and shown in the right panel. (BD) Confocal images of the sublingual mucosa of CD11c-YFP/XCR1-KikGR mice after exposure to violet light to photoconvert KikGR-expressing cells to KikGR-Red. KikGR-Red cells are shown in white (Supplemental Videos 4–6). The data are representative of at least 3 independent experiments. Scale bars: 50 μm (A).
Figure 7
Figure 7. Foxp3+ and Foxp3 CD4+ T cells and CD8+ T cells in sublingual DC clusters.
(A) Sublingual KikGR+ DC clusters in hCD2/CD52-Foxp3/KikGR mouse bone marrow chimeric mice were photolabeled similarly to those in Figure 5A and single-cell suspensions were stained with fluorochrome-conjugated antibodies. Representative flow cytometry plots of photolabeled KikGR-Red T cells in clusters and non-photolabeled T cells outside clusters. (B) Proportions of CD4+ T cells and CD8+ T cells in all T cells (left) and Foxp3+ cells in CD4+ T cells (right). Data represent mean ± SEM (n = 5). (C, D, F, and G) Images of a frozen section of sublingual tissue of CD11c-YFP mice, stained with anti-CD5 mAb (red), anti-CD4 mAb (white), and DAPI (blue) (C and D) (Supplemental Video 7), or stained with anti-CD5 mAb (red), anti-CD8 mAb (white), and DAPI (blue) (F and G) (Supplemental Video 8). (E) Images of a frozen section of sublingual tissue in CD11c-YFP mice stained with anti-CD4 mAb (red) and anti-Foxp3 mAb (white). The data are representative of at least 3 independent experiments. Scale bars: 50 μm (C, D, F, and G) and 20 μm (E). Mus, muscle layer; LP, lamina propria; Ep, epithelium.
Figure 8
Figure 8. Trm and Treg subsets in the SLICs.
Sublingual KikGR+ DC clusters in hCD2/CD52-Foxp3/KikGR bone marrow chimeric mice were photolabeled as in Figure 5A and single-cell suspensions were stained with fluorochrome-conjugated antibodies. Representative flow cytometry plots of photolabeled KikGR-Red T cells in clusters and non-photolabeled T cells outside clusters. (A) Representative flow cytometry plots of T cells. (B) Proportions of Trm cells in each T cell subset. Data represent mean ± SEM (n = 4). Statistical comparisons were performed using an unpaired, 2-tailed Student’s t test. *P < 0.05, ***P < 0.001.
Figure 9
Figure 9. Inflammation increases the number and size of SLICs.
DNFB was applied to the sublingual mucosa of CD11c-YFP mice. (A) Image of sublingual mucosa before application (left panel) and 1 day after the second application (right panel). Scale bars: 1 mm. (B) Numbers of SLICs before and after application of DNFB. Fluorescence images of sublingual region shown in A were subdivided into the anterior (red square), middle (light-blue square), and posterior (blue square) regions as in Figure 4B and number of SLICs was counted. (C) Size of SLICs in posterior sublingual region before and after application of DNFB. (D) Images of serial frozen sections of sublingual tissue of CD11c-YFP mouse before (upper panels) and after application of DNFB (lower panels). Serial tissue sections were stained with anti-CD4 mAb or anti-CD8 mAb (red) and DAPI (blue) (Supplemental Video 10). Yellow arrowheads in upper right panel point to CD8+ cells. Scale bars: 50 μm. (E) Densities of DCs, CD4+ T cells, and CD8+ T cells in SLICs. Data in B, C, and E represent mean ± SEM. At least 9 samples (B and C) and 12 samples (E) from in each group were analyzed. (F) Fluorescence images of YFP and rhodamine signals (left panels) and rhodamine signal (right panels) of inflamed sublingual region 20 minutes after rhodamine application. White circles indicate SLIC. Scale bars: 50 μm. The data are representative of at least 3 independent experiments. Statistical comparisons were performed using an unpaired, 2-tailed Student’s t test. *P < 0.05, **P < 0.01, ****P < 0.0001. Mus, muscle layer; LP, lamina propria; Ep, epithelium.

References

    1. Challacombe SJ, et al. Chapter 102 - Immunology of Diseases of the Oral Cavity. In: Mestecky J, et al, eds. Mucosal Immunology Fourth Edition. Academic Press; 2015:1943–1983.
    1. Brandtzaeg P, et al. Terminology: nomenclature of mucosa-associated lymphoid tissue. Mucosal Immunol. 2008;1(1):31–37. doi: 10.1038/mi.2007.9. - DOI - PubMed
    1. Holmgren J, Czerkinsky C. Mucosal immunity and vaccines. Nat Med. 2005;11(4 suppl):S45–S53. doi: 10.1038/nm1213. - DOI - PubMed
    1. Lam HY, et al. Mechanisms of allergen-specific immunotherapy for allergic rhinitis and food allergies. Biosci Rep. 2020;40(4):BSR20200256. doi: 10.1042/BSR20200256. - DOI - PMC - PubMed
    1. Drazdauskaitė G, et al. Mechanisms of allergen immunotherapy in allergic rhinitis. Curr Allergy Asthma Rep. 2021;21(1):2. doi: 10.1007/s11882-020-00977-7. - DOI - PMC - PubMed

LinkOut - more resources