. 2024 Oct 1;134(22):e173448.
doi: 10.1172/JCI173448.

Endothelial YAP/TAZ activation promotes atherosclerosis in a mouse model of Hutchinson-Gilford progeria syndrome

Affiliations

Endothelial YAP/TAZ activation promotes atherosclerosis in a mouse model of Hutchinson-Gilford progeria syndrome

Ana Barettino et al. J Clin Invest. .

Abstract

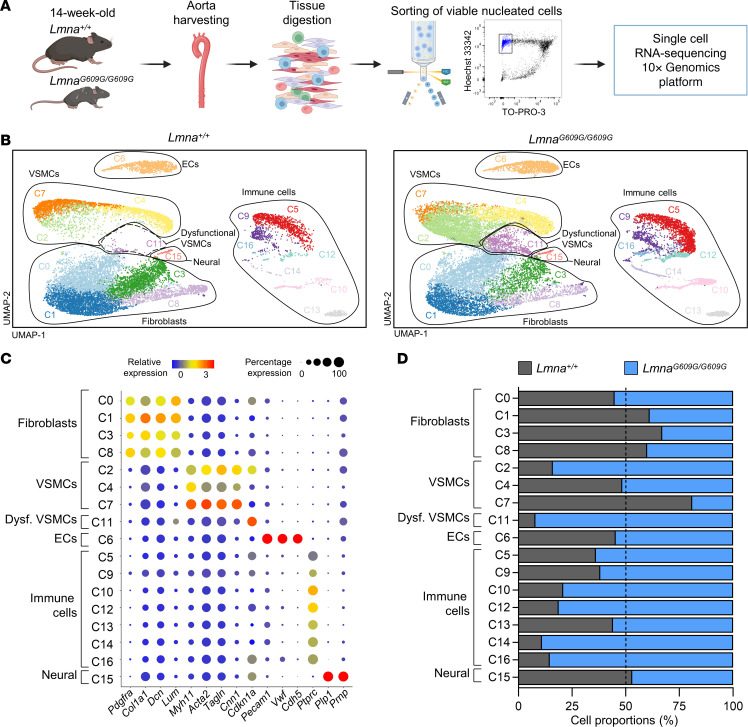
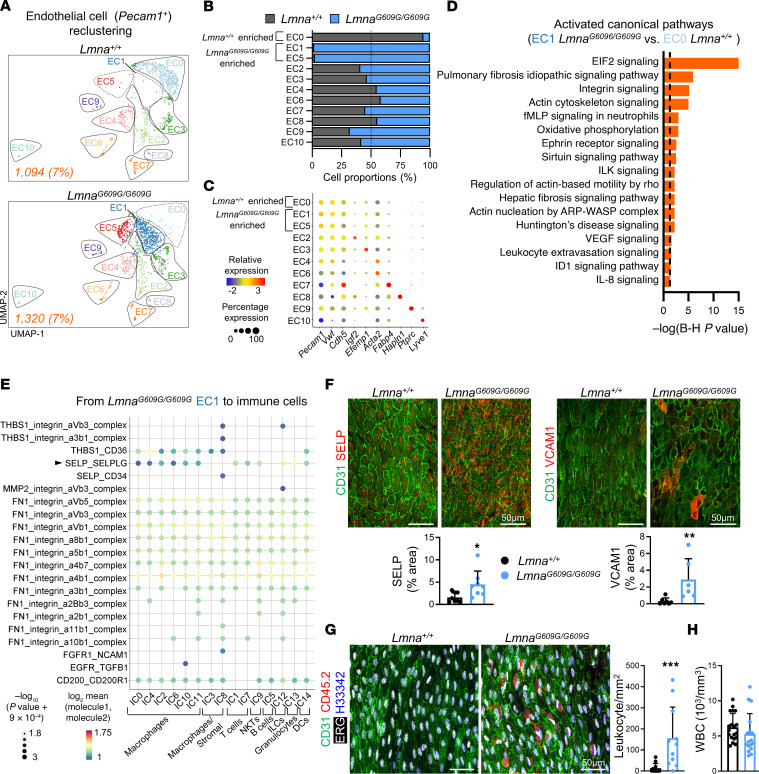
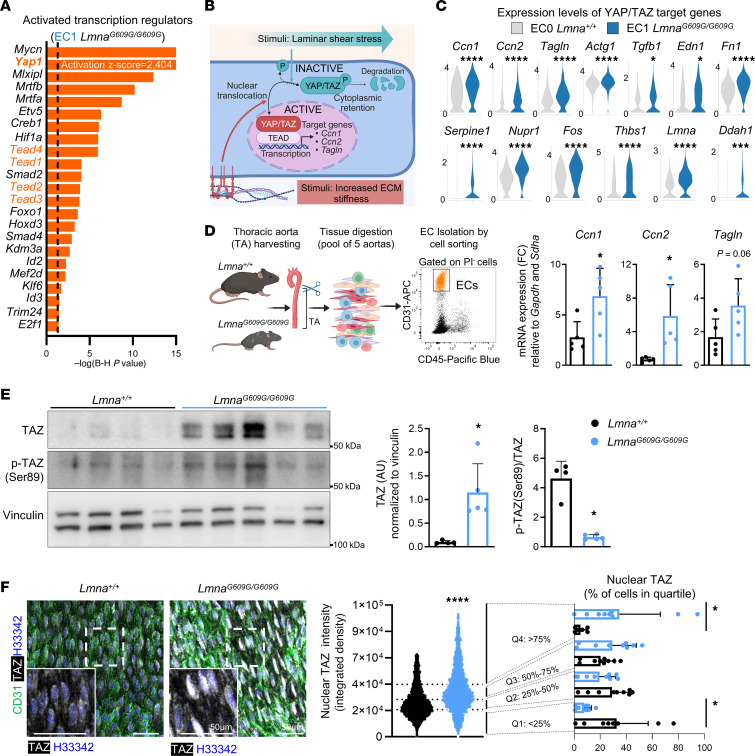
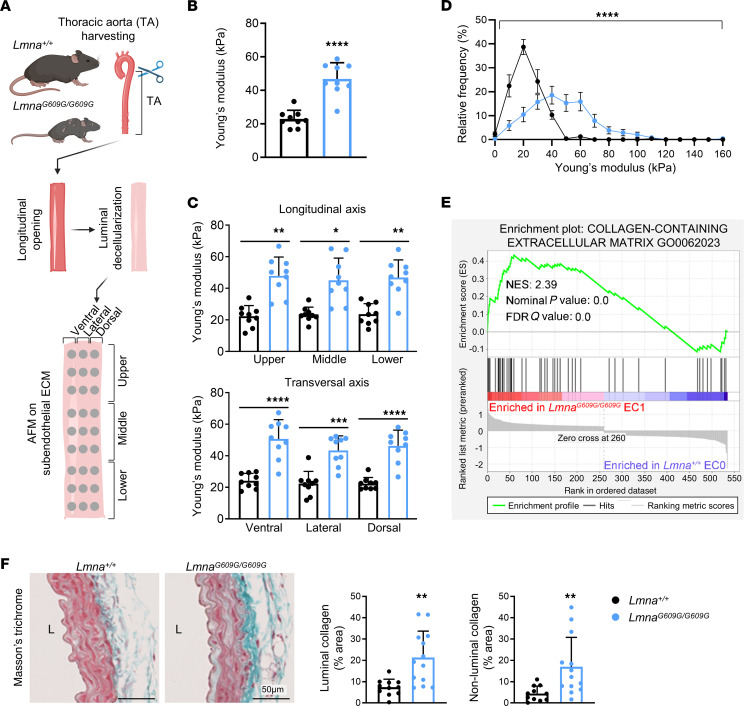
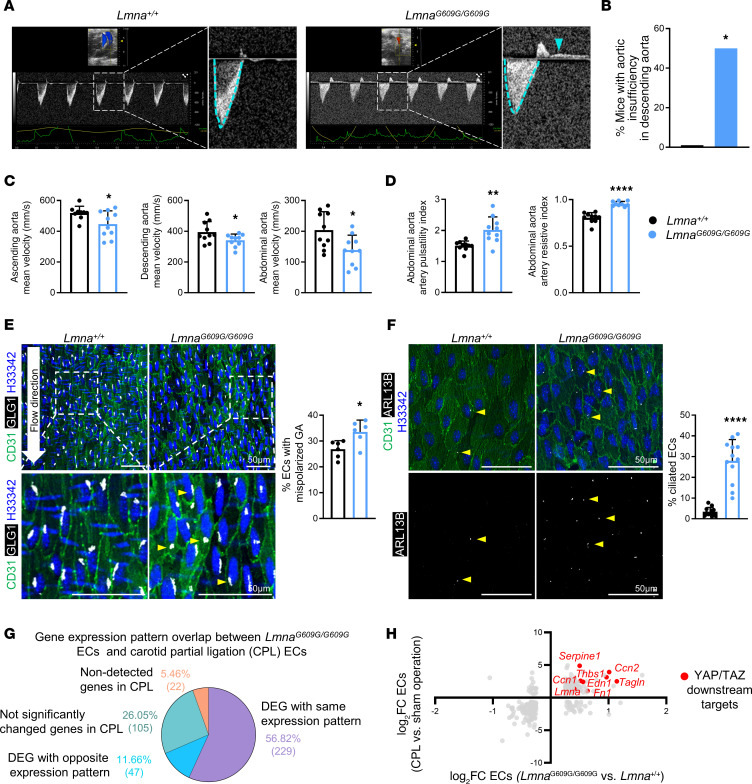
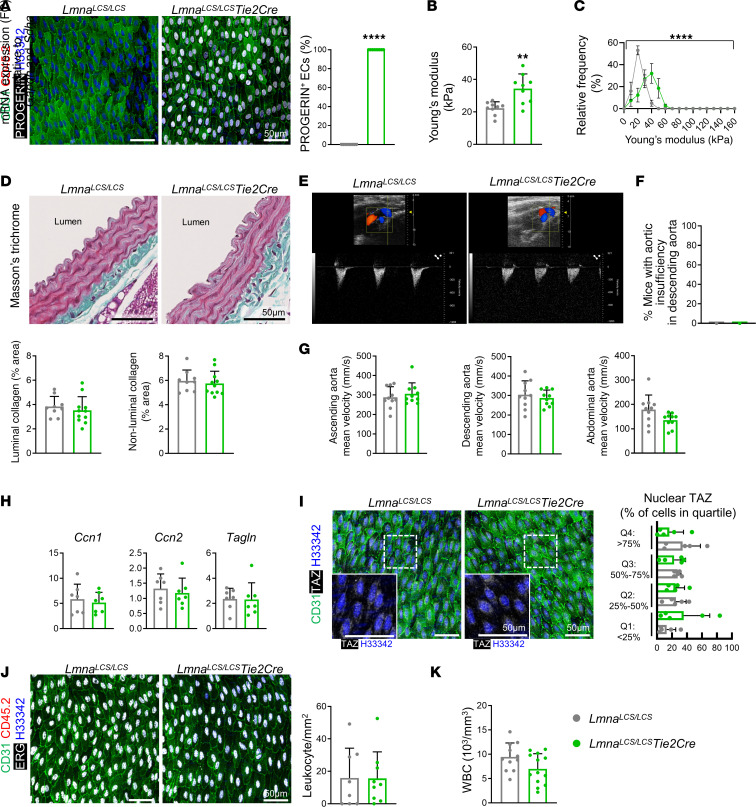
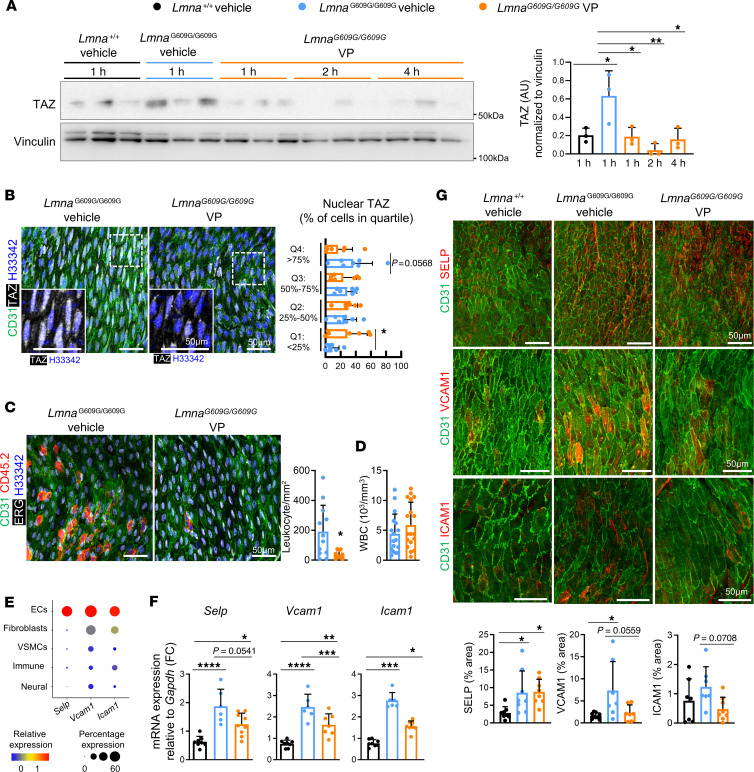
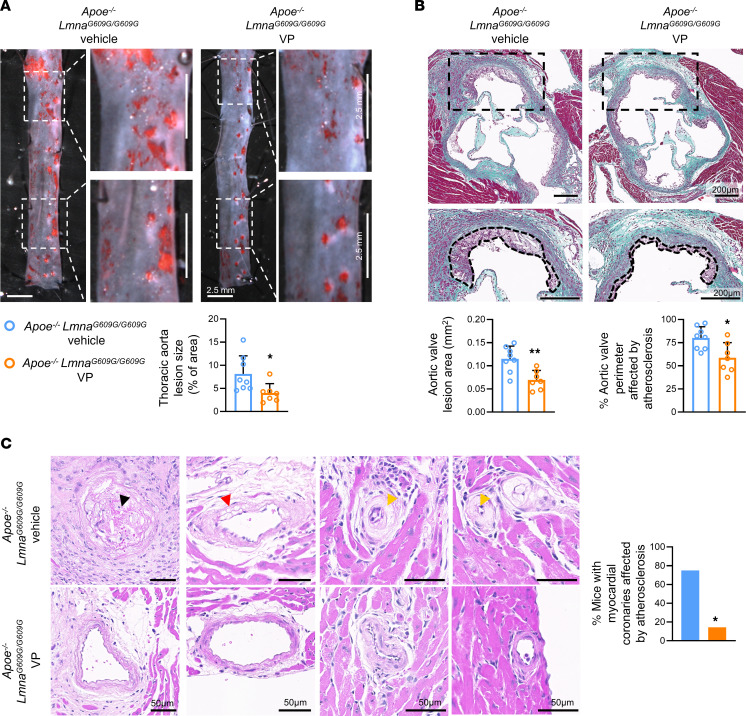
Hutchinson-Gilford progeria syndrome (HGPS) is an extremely rare disease caused by the expression of progerin, an aberrant protein produced by a point mutation in the LMNA gene. HGPS patients show accelerated aging and die prematurely mainly from complications of atherosclerosis such as myocardial infarction, heart failure, or stroke. However, the mechanisms underlying HGPS vascular pathology remain ill-defined. We used single-cell RNA sequencing to characterize the aorta in progerin-expressing LmnaG609G/G609G mice and wild-type controls, with a special focus on endothelial cells (ECs). HGPS ECs showed gene expression changes associated with extracellular matrix alterations, increased leukocyte extravasation, and activation of the yes-associated protein 1/transcriptional activator with PDZ-binding domain (YAP/TAZ) mechanosensing pathway, all validated by different techniques. Atomic force microscopy experiments demonstrated stiffer subendothelial extracellular matrix in progeroid aortae, and ultrasound assessment of live HGPS mice revealed disturbed aortic blood flow, both key inducers of the YAP/TAZ pathway in ECs. YAP/TAZ inhibition with verteporfin reduced leukocyte accumulation in the aortic intimal layer and decreased atherosclerosis burden in progeroid mice. Our findings identify endothelial YAP/TAZ signaling as a key mechanism of HGPS vascular disease and open a new avenue for the development of YAP/TAZ-targeting drugs to ameliorate progerin-induced atherosclerosis.

Keywords: Aging; Atherosclerosis; Cardiovascular disease; Endothelial cells; Vascular biology.


Figures

Figure 1
Figure 1. Single-cell RNA-Seq analysis of the aorta in Lmna+/+ and LmnaG609G/G609G mice.
(A) Experimental approach. (B) Uniform manifold approximation and projection (UMAP) representation of scRNA-Seq data, showing cell clusters and identified cell types. (C) Relative expression and percentage of expression of cell type–specific markers in each cluster. (D) Relative abundance of each cluster in control and progeroid mice. The dashed line indicates 50% proportion (i.e., same number of sequenced cells in both genotypes for each cluster). Dysf., dysfunctional.
Figure 2
Figure 2. Characterization of aortic endothelial cells in Lmna+/+ and LmnaG609G/G609G mice.
(A) UMAP plot of reclustered ECs, showing distinct EC subpopulations. Absolute numbers and percentages of sequenced cells are indicated for each genotype (bottom left corner). (B) Relative abundance of EC subclusters in each genotype. The dashed line indicates 50% proportion (i.e., same number of sequenced cells in both genotypes for each subcluster). (C) Relative levels and percentage of expression of pan-endothelial markers (Pecam1, Vwf, and Cdh5) and selected genes with specifically increased expression in different EC subclusters. (D) Ingenuity Pathway Analysis of activated canonical pathways in LmnaG609G/G609G-enriched EC1 compared with Lmna+/+-enriched EC0. Pathways were filtered according to activation score (z score > 0) and significance (Benjamini-Hochberg P < 0.05). The dashed line indicates Benjamini-Hochberg P = 0.05. (E) CellPhoneDB prediction of selected ligand-receptor interactions between LmnaG609G/G609G EC1 and immune cells. SELP-SELPLG interaction is indicated with an arrowhead. (F) Representative en face immunofluorescence images of thoracic aortae showing ECs (CD31, green), SELP (left images, red), or VCAM1 (right images, red), and percentage of area positive for SELP (n = 8) or VCAM1 (n = 6–7). Mean value for each mouse was determined by averaging of values from 3 fields. (G) Representative en face immunofluorescence images of thoracic aortae showing ECs (CD31, green), EC nuclei (ERG, white), leukocytes (CD45.2, red), and nuclei (Hoechst 33342, blue) and quantification of intimal leukocytes. Mean values for each mouse (n = 11) were determined by averaging of the number of leukocytes present in 3 fields. (H) Circulating white blood cell counts (n = 17–19). Data are presented as mean + SD. Statistical analysis was performed by permutation test in E and Mann-Whitney test in FH. Scale bars: 50 μm. *P < 0.05, **P < 0.01, ***P < 0.001. fMLP, N-formyl-methionyl-leucyl-phenylalanine; H33342, Hoechst 33342; ILCs, innate lymphod cells; ILK, integrin linked kinase; UMAP, uniform manifold approximation and projection; WBC, white blood cells.
Figure 3
Figure 3. YAP/TAZ signaling is activated in aortic endothelial cells from LmnaG609G/G609G mice.
(A) Activated upstream transcriptional regulators in LmnaG609G/G609G-enriched EC1, predicted by Ingenuity Pathway Analysis of scRNA-Seq data (z score > 2, Benjamini-Hochberg P < 0.05). The dashed line indicates Benjamini-Hochberg P = 0.05. (B) Schematic representation of YAP/TAZ pathway regulation. (C) scRNA-Seq–determined expression of YAP/TAZ target genes in Lmna+/+-enriched EC0 and LmnaG609G/G609G-enriched EC1. (D) Protocol outline and gating strategy for the isolation of viable aortic ECs from Lmna+/+ and LmnaG609G/G609G mice by cell sorting (PICD31+CD45 cells). Graphs show the RT-qPCR–determined expression of canonical YAP/TAZ target genes (n = 5). Each dot represents a pool of ECs from 5 thoracic aortae. (E) Western blots showing total TAZ, phosphorylated (inactive) TAZ [p-TAZ(Ser89)], and vinculin levels in thoracic aortae from Lmna+/+ and LmnaG609G/G609G mice (n = 4–5). Graphs show the quantification of total TAZ expression normalized to vinculin and the p-TAZ(Ser89)/total TAZ ratio. (F) Representative en face immunofluorescence images of thoracic aortae showing ECs (CD31, green), TAZ (white), and nuclei (Hoechst 33342, blue). The violin plot represents nuclear TAZ intensity values in thoracic ECs (2,762–3,074 cells per genotype), and the bar graph shows the percentage of cells in each quartile per mouse (n = 9). Boxed areas shown at higher magnification. Data are shown as mean + SD. Statistical analysis was performed by MAST test in C, unpaired 2-tailed Student’s t test in D and F (right, Q2–Q4), and Mann-Whitney test in E and F (left, right Q1). Outliers assessed by ROUT test in F were excluded for analysis. Scale bars: 50 μm. *P < 0.05, ***P < 0.001, ****P < 0.0001. FC, fold change; PI, propidium iodide; Q, quartile.
Figure 4
Figure 4. Increased stiffness and collagen accumulation in the aortic subendothelial ECM from LmnaG609G/G609G mice.
(A) Workflow for atomic force microscopy analysis of subendothelial ECM in decellularized thoracic aortae. (B) Quantification of the Young’s modulus determined by atomic force microscopy (n = 9) to estimate aortic subendothelial ECM stiffness (average of the different analyzed regions). (C) Zone-dependent analysis of Young’s modulus (n = 9). (D) Frequency distribution of Young’s modulus values (n = 9). (E) Gene set enrichment analysis (GSEA) of scRNA-Seq data performed on LmnaG609G/G609G-enriched EC1 compared with Lmna+/+-enriched EC0. (F) Masson’s trichrome staining of thoracic aorta. Graphs show the quantification of collagen area percentage in the luminal region of the aorta (first 10 μm from the lumen) and in the remaining medial aorta (non-luminal) (n = 11–13). Data are shown as mean + SD. Statistical analysis was performed using unpaired 2-tailed Student’s t test in B and F, Mann-Whitney test in F, 1-way ANOVA or Kruskal-Wallis tests in C, 2-way ANOVA in D, and GSEA-calculated nominal P value and FDR in E. Scale bars: 50 μm. *P < 0.05, **P < 0.01, ***P < 0.001, ****P < 0.0001. AFM, atomic force microscopy; FDR, false discovery rate; L, lumen; NES, normalized enrichment score.
Figure 5
Figure 5. Blood flow alterations in the aorta of LmnaG609G/G609G mice.
(A) Representative ultrasound images of descending aorta. Magnified views show pulse-wave Doppler mode graphs, with mean velocity in systole indicated with blue dashed lines (below baseline); in progeroid mice, retrograde flow in diastole is detected as a plateau above baseline (blue arrowhead). (B) Percentage of mice with aortic insufficiency (retrograde flow) in the descending aorta: 0 of 10 Lmna+/+ mice; 5 of 10 LmnaG609G/G609G mice. (C) Blood flow mean velocity values in the indicated aortic regions (n = 9–10). (D) Pulsatility index and resistive index in abdominal aorta (n = 10). (E) Representative en face immunofluorescence images of thoracic aortae, showing ECs (CD31, green), Golgi apparatus (GLG1, white), and nuclei (Hoechst 33342, blue), and percentage of ECs with mispolarized Golgi apparatus (downstream orientation relative to nuclei, arrowheads) (n = 6). Mean values for each mouse were determined by averaging of values from 3 fields. (F) Representative en face immunofluorescence images of thoracic aortae, showing ECs (CD31, green), primary cilia (ARL13B, white), and nuclei (Hoechst 33342, blue), and percentage of ciliated ECs (arrowheads) (n = 12). Mean values for each mouse were determined by averaging of values from 3 fields. (G and H) Overlap between gene expression changes in progeroid aortic ECs (C6 cluster in Figure 1, LmnaG609G/G609G vs. Lmna+/+ mice) and wild-type carotid ECs exposed to disturbed blood flow (carotid partial ligation vs. sham, results reported in ref. 25). Red dots in H highlight YAP/TAZ downstream targets significantly upregulated in both conditions. Data in CF are shown as mean + SD. Statistical analysis was performed by 2-sided Fisher’s exact test (B) and unpaired 2-tailed Student’s t test (CF). Outliers assessed by ROUT test in C and D were excluded for analysis. Scale bars: 50 μm. *P < 0.05, **P < 0.01, ****P < 0.0001. CPL, carotid partial ligation; DEG, differentially expressed genes; FC, fold change; GA, Golgi apparatus.
Figure 6
Figure 6. EC-specific progerin expression is not sufficient to trigger YAP/TAZ activation and leukocyte recruitment.
(A) Representative images of en face immunofluorescence staining in thoracic aorta showing ECs (CD31, green), progerin (white), leukocytes (CD45.2, red), and nuclei (Hoechst 33342, blue), and percentage of progerin+ ECs. Mean value per mouse (n = 8–9) was determined by averaging of cells from 1 field. (B) Young’s modulus determined by atomic force microscopy (n = 9). (C) Frequency distribution of Young’s modulus (n = 9). (D) Masson’s trichrome staining of thoracic aorta to quantify percentage of collagen area in the luminal region (first 10 μm from the lumen) and in the remaining medial aorta (non-luminal) (n = 9–11). (E) Representative ultrasound images of descending aorta. (F) Percentage of mice with aortic insufficiency (retrograde flow) in descending aorta (0 of 10 in LmnaLCS/LCS and LmnaLCS/LCS Tie2Cre). (G) Blood flow mean velocity at indicated aortic regions (n = 10). (H) Expression of YAP/TAZ target genes in thoracic aorta ECs quantified by RT-qPCR (n = 7). (I) Representative en face immunofluorescence images of thoracic aortae showing ECs (CD31, green), TAZ (white), and nuclei (Hoechst 33342, blue). Boxed areas shown at higher magnification. Graph showing the percentage of cells in each quartile per mouse (n = 5). (J) Representative images of en face immunofluorescence staining showing ECs (CD31, green), EC nuclei (ERG, white), leukocytes (CD45.2, red), and nuclei (Hoechst 33342, blue) in thoracic aorta, and quantification of CD45+ cells. Mean value per mouse (n = 8–9) was determined by averaging of cells from 9 fields from 3 regions. (K) Circulating white blood cell counts (n = 11–13). Data in A, B, D, and GK are represented as mean + SD. Statistical analysis was performed by Mann-Whitney test (A and G [ascending aorta]), 2-tailed Student’s t test (B, D, G [descending, abdominal aorta], and HK), 2-way ANOVA (C), and 2-sided Fisher’s exact test (F). Scale bars: 50 μm. **P < 0.01, ****P < 0.0001. WBC, white blood cells.
Figure 7
Figure 7. YAP/TAZ inhibition with verteporfin reduces the accumulation of aortic intimal leukocytes in progeroid mice.
(A) Western blot analysis of thoracic aorta lysates, showing TAZ upregulation in vehicle-treated LmnaG6096/G609G versus Lmna+/+ mice, and its inhibition after verteporfin treatment (n = 3). Vinculin was used as loading control. (B) Representative en face immunofluorescence images of thoracic aortae showing ECs (CD31, green), TAZ (white), and nuclei (Hoechst 33342, blue), and quantification of percentage of cells in each quartile per mouse (n = 7). Boxed areas shown at higher magnification. (C) Representative en face immunofluorescence images of thoracic aortae showing ECs (CD31, green), EC nuclei (ERG, white), leukocytes (CD45.2, red), and nuclei (Hoechst 33342, blue), and quantification of intimal leukocytes. Mean values for individual mice (n = 10–12) were determined by averaging of cells from 9 fields from 3 aortic regions. (D) Circulating white blood cell counts (n = 17–18). (E) scRNA-Seq–determined relative expression of Selp, Vcam1, and Icam1 in different aortic cell types. (F) Selp, Vcam1, and Icam1 expression in aortic arches determined by RT-qPCR (n = 6–9). (G) Representative en face immunofluorescence images of aortae showing ECs (CD31, green) and SELP (top panel, aortic arch, red), VCAM1 (middle panel, thoracic aorta, red), or ICAM1 (bottom panel, thoracic aorta, red). The graph shows the percentage of SELP+ (n = 8), VCAM1+ (n = 7–9), and ICAM1+ (n = 7–8) area. Mean values for individual mice were determined by averaging of values from 3 fields. Data are presented as mean + SD. Statistical analysis was performed using 1-way ANOVA (A, F [Selp and Vcam1], and G), 1-tailed Student’s t test (B [Q1, Q2, Q4]), Mann-Whitney test (B [Q3]), 2-tailed Student’s t test (C and D), and Kruskal-Wallis test (F [Icam1]). Outliers assessed by ROUT test in F (Icam1) were excluded for analysis. Scale bars: 50 μm. *P < 0.05, **P < 0.01, ***P < 0.001, ****P < 0.0001. FC, fold change; VP, verteporfin; WBC, white blood cells.
Figure 8
Figure 8. YAP/TAZ inhibition with verteporfin attenuates atherosclerosis burden in progeroid mice.
(A) Representative images of en face Oil Red O staining of thoracic aortae from vehicle- or verteporfin-treated Apoe–/– LmnaG6096/G609G mice; the graph shows quantification of atherosclerotic lesion size (n = 7–8). Boxed areas are shown at higher magnification. (B) Masson’s trichrome staining of the aortic root from vehicle- or verteporfin-treated Apoe–/– LmnaG6096/G609G mice; the graphs show quantification of plaque area and the percentage of the aortic valve perimeter affected by atherosclerosis (n = 7–8). Boxed areas are shown at higher magnification in the bottom images, where atherosclerotic plaques are indicated by dashed lines. Each point represents the mean of 2 aortic root regions per mouse. (C) Representative images of H&E staining of myocardial coronary arterioles from vehicle- or verteporfin-treated Apoe–/– LmnaG6096/G609G mice, and quantification of the percentage of mice presenting at least 1 myocardial vessel (diameter >50 μm) with signs of atherosclerotic disease. Black, red, and yellow arrowheads show examples of atherosclerotic plaque, medial lipid accumulation, and intimal hypertrophy, respectively. Apoe–/– LmnaG609G/G609G vehicle mice, 6 of 8; Apoe–/– LmnaG609G/G609G VP mice, 1 of 7. Statistical analysis was carried out using 2-tailed Student’s t test (A and B) and 2-sided Fisher’s exact test (C). Scale bars: 2.5 mm (A), 200 μm (B), and 50 μm (C). *P < 0.05, **P < 0.01. VP, verteporfin.

References

    1. Hamczyk MR, et al. Aging in the cardiovascular system: lessons from Hutchinson-Gilford progeria syndrome. Annu Rev Physiol. 2018;80(1):27–48. doi: 10.1146/annurev-physiol-021317-121454. - DOI - PubMed
    1. Eriksson M, et al. Recurrent de novo point mutations in lamin A cause Hutchinson-Gilford progeria syndrome. Nature. 2003;423(6937):293–298. doi: 10.1038/nature01629. - DOI - PMC - PubMed
    1. De Sandre-Giovannoli A, et al. Lamin A truncation in Hutchinson-Gilford progeria. Science. 2003;300(5628):2055. doi: 10.1126/science.1084125. - DOI - PubMed
    1. Benedicto I, et al. Molecular and cellular mechanisms driving cardiovascular disease in Hutchinson-Gilford progeria syndrome: lessons learned from animal models. Cells. 2021;10(5):1157. doi: 10.3390/cells10051157. - DOI - PMC - PubMed
    1. Xu S, et al. Endothelial dysfunction in atherosclerotic cardiovascular diseases and beyond: from mechanism to pharmacotherapies. Pharmacol Rev. 2021;73(3):924–967. doi: 10.1124/pharmrev.120.000096. - DOI - PubMed

MeSH terms