. 2024 Oct 22;43(10):114791.
doi: 10.1016/j.celrep.2024.114791. Epub 2024 Sep 30.

RNA polymerase II transcription initiation in holo-TFIID-depleted mouse embryonic stem cells

Affiliations

RNA polymerase II transcription initiation in holo-TFIID-depleted mouse embryonic stem cells

Vincent Hisler et al. Cell Rep. .

Abstract

The recognition of core promoter sequences by TFIID is the first step in RNA polymerase II (Pol II) transcription initiation. Metazoan holo-TFIID is a trilobular complex, composed of the TATA binding protein (TBP) and 13 TBP-associated factors (TAFs). Why and how TAFs are necessary for the formation of TFIID domains and how they contribute to transcription initiation remain unclear. Inducible TAF7 or TAF10 depletion, followed by comprehensive analysis of TFIID subcomplex formation, chromatin binding, and nascent transcription in mouse embryonic stem cells, result in the formation of a TAF7-lacking TFIID or a minimal core-TFIID complex, respectively. These partial complexes support TBP recruitment at promoters and nascent Pol II transcription at most genes early after depletion, but importantly, TAF10 is necessary for efficient Pol II pausing. We show that partially assembled TFIID complexes can sustain Pol II transcription initiation but cannot replace holo-TFIID over several cell divisions and/or development.

Keywords: CP: Molecular biology; RNA polymerase II; TAF10; TAF7; TATA binding protein; TBP; TBP-associated factor; TFIID; complex assembly; mouse embryonic stem cells; nascent transcription.


Conflict of interest statement

Declaration of interests The authors declare that they have no competing interests.

Figures
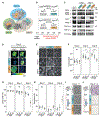
Figure 1.
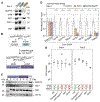
Figure 1.. Phenotypic analysis of the conditional depletion of TAF7 or TAF10 in mESCs
(A) Trilobular structure of TFIID. (B) Deletion of Taf7 (−Taf7) in R26CreERT2/+;Taf7f/f (RT7) and Taf10 (−Taf10) in R26CreERT2/+;Taf10f/f (RT10) mESCs. Control cells were treated with EtOH. (C) Western blot analyses of TAF4, TAF5, TAF6, TAF7, TAF8, TAF10, and TAF12 protein expression after Taf7 or Taf10 deletion at day (D) 2 and D4. As a control (Ctrl), RT7 cells were treated for 2 days. The Ponceau staining is displayed at the bottom. (D) Immunolocalization of TAF7 and TAF10 in RT7 and RT10 cells at D3. As a control, RT10 cells were treated for 3 days. Color scale: Green Fire Blue LUT. (E) Colony growth at D2, D4, and D6. (F–H) Total number of cells (F), percentage of living cells (G), and percentage of apoptotic cells (H) at D2, D4, and D6. (E) Ctrl, n = 5; −Taf7, n = 2; D4: −Taf10, n = 3 biological replicates for each day. (F and G) Ctrl: D2, n = 20; D4, n = 20; D6, n = 15. –Taf7: D2, n = 13; D4, n = 13; D6, n = 8. –Taf10: D2, n = 7; D4, n = 7; D6, n = 7 biological replicates. (H) Ctrl, n = 9; Taf7, n = 4; Taf10, n = 5 biological replicates for each day). Two independent experiments were conducted. The bars correspond to the mean ± SD. Kruskal-Wallis test followed by Dunn post hoc test: ns, not significant; *p < 0.05, **p < 0.01, ***p < 0.001, and ****p < 0.0001. (I) Cell density after passage at D2 and 1 day of extra culture. (J) Cell density evaluated by crystal violet staining after passage at D4 and 2 days of culture. The control conditions correspond to RT7 cells (E, I, and J). Scale bars, 15 μm (D), 50 μm (E), and 150 μm (I and J).
Figure 2.
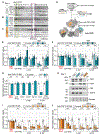
Figure 2.. The more severe phenotype in TAF10-depleted mESCs is not due to SAGA assembly defect
(A) Western blot analyses of SUPT7L, TAF7, TAF8, TAF10, and TBP expression in TAF7- or TAF10- depleted cells after 3 days of treatment. Control RT7 cells were treated with EtOH. (B) Generation of the R26CreERT2/+;Taf7f/f;Supt7l−/− (RT7;Supt7l−/−) mESCs. (C) Western blot analyses of SUPT7L, TAF7, TBP, and TAF10 expression in RT7;Supt7l−/− cells after 2, 4, and 6 days of treatment with EtOH (Control;Supt7l−/−) or 4-OHT (–Taf7;Supt7l−/−). Control RT7 cells were treated 6 days. M, molecular weight marker. (D) Anti-SUPT20H IP-MS analyses on nuclear-enriched lysates from RT10 and RT7 cells treated 4 days with EtOH (Control, RT7, and RT10 data merged), RT10 mESCs with 4-OHT (–Taf10), and RT7;Supt7l−/− cells with EtOH (Control;Supt7l−/−). For each protein, the XIC (extracted ion chromatograms) values of Control;Supt7l−/− and –Taf10 lysates were normalized to those of RT7 and RT10 control cells treated with EtOH, respectively. Control, n = 2 biological replicates × 3 technical replicates; –Taf10, n = 1 × 3; Control;Supt7l−/−, n = 1 × 3. (E) Total number of cells at day (D) 4 and D6. RT7 and RT10 cells treated with EtOH were merged as control (Ctrl). The impact on TFIID and SAGA assembly is indicated at the bottom. D4 and D6: Ctrl, n = 6; Ctrl;Supt7l−/−, n = 4; −Taf7;Supt7l−/−, n = 4; -Taf7, n = 3; –Taf10, n = 3 biological replicates. Kruskal-Wallis test: ns, not significant; *p < 0.05 and **p < 0.01 (D and E). Means ± SD are shown (D and E).
Figure 3.
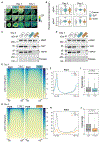
Figure 3.. Depletion of TAF7 or TAF10 differentially affects TFIID assembly
(A–C) Gel filtration coupled to western blot analysis of TAF4, TAF5, TAF6, TAF7, TAF10, and TBP expression in RT10 mESCs treated with EtOH (Control) (A) and TAF7- and TAF10-depleted mESCs treated with 4-OHT (B and C) for 3 days (n = 1). Letters on the top correspond to the fractions. Positions of the complexes are indicated by colored boxes. (D) Detection of holo-TFIID and TFIID submodules by the different antibodies. (E and F) Relative normalized XIC values of TFIID subunits from anti-TBP (E) and anti-TAF12 (F) IP-MS from RT7 mESCs at day (D) 2, D3, and D4 after EtOH (Control) or 4-OHT (–Taf7) treatment. (G) Normalized relative XIC values for TFIID subunits from anti-TAF1 IP-MS in control and TAF7-depleted cells at D3. (H) Western blot analyses of TAF1, TAF7, TAF10, and TBP expression after TAF7 (–Taf7) or TAF10 (–Taf10) depletion at D3. M, molecular weight marker. (I and J) Relative normalized XIC values of TFIID subunits from anti-TBP (I) and anti-TAF12 (J) IP-MS from RT10 mESCs at D2, D3, and D4 after EtOH (Control) or 4-OHT (–Taf10) treatment. In (E)–(G), (I), and (J), subunits of the same submodules (see D) were merged, except for the bait proteins and TAF2, TAF7, TAF8, and TAF10. TAF2 data were not taken into account because TAF2 was poorly detected in the IP-MS from controls. Core-TFIID: TAF4/4B, TAF5, TAF6, TAF9/9B, and TAF12. S-TAF: TAF1, TAF3, TAF11, TAF13, and TBP. D2, n = 1 biological replicate × 3 technical replicates; D3, n = 3 × 3; D4, n = 2 × 3 (E, F, I, and J); n = 3 technical replicates (G). Each dot corresponds to one measure of one subunit. Red crosses indicate proteins not detected in the control condition. Means ± SD are shown, Kruskal-Wallis test: ns, not significant; *p < 0.05, **p < 0.01, ***p < 0.001, and ****p < 0.0001.
Figure 4.
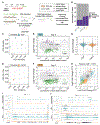
Figure 4.. TBP is recruited at promoters in TAF7- or TAF10-depleted mESCs
(A and B) TBP distribution at the position of the top 10% (fold enrichment) anti-TBP CUT&RUN peaks (±2 kb) detected in the control condition and in RT7 control and TAF7-depleted (A) and RT10 control and TAF10-depleted (B) mESCs at D3. (C–J) Mean profiles of TBP (C and G), TAF7 (D and H), TAF10 (E and I), and TAF12 (F and J) protein accumulation at the TBP control peaks in control (black line) and TAF7-depleted (blue line) (C–F) and in control (black line) and TAF10-depleted (orange line) (G–J) mESCs. (K and L) MA plots of differential peak analyses in TAF7-depleted (K) and TAF10-depleted (L) mESCs at D3, with the number of significantly down- (green) or upregulated (purple) TBP peaks (adjusted p ≤ 0.05, |log2 fold change| ≥ 0.5). No significant peaks were detected in the TAF7-depleted cells.
Figure 5.
Figure 5.. Depletion of holo-TFIID in the absence of TAF7 or TAF10 has only limited defects on Pol II global transcription
(A) Representative views of immunofluorescence using anti-RPB1, anti-RPB1pSer2, and anti-RPB1pSer5 antibodies on RT7 and RT10 mESCs treated with 4-OHT (–Taf7 or –Taf10) and with EtOH (Ctrl) at day (D) 3 and D4. Color scale: Green Fire Blue LUT. Scale bars: 50 μm. (B) Quantification of RPB1pSer5 and RPB1pSer2 nuclear signal represented as violin plots. D3 and D4, n = 1 biological replicate. Kruskal-Wallis test: ns, not significant; *p < 0.05, **p < 0.01, and ***p < 0.001. (C and D) Western blot analyses of TAF7, TAF10, and RPB1pSer5 (C) and RPB1pSer2 (D) expression in RT7 and RT10 mESCs treated with EtOH (Ctrl) and TAF7- (−Taf7) and TAF10- (−Taf10) depleted mESCs at D3. The Ponceau staining is displayed at the bottom. M, molecular weight marker. (E–H) Heatmaps (E and G) and mean profiles (F and H) of Pol II distribution on protein-coding genes (from −1 kb upstream of the TSS to +1 kb downstream of the TES) in RT7 control (Ctrl) and TAF7-depleted (–Taf7) (E and F) and RT10 control (Ctrl) and TAF10-depleted (–Taf10) (G and H) mESCs at D3. TSS, transcription start site; TES, transcription end site. (I and J) Pausing index calculated in RT7 control (Ctrl) and TAF7-depleted (–Taf7) mESCs (I) and in RT0 control (Ctrl) and TAF10-depleted (–Taf10) mESCs (J) at D3. Kolmogorov-Smirnov test. The p values and maximal distances (max dist) are indicated.
Figure 6.
Figure 6.. TAF7 loss has a milder impact on RNA Pol II gene transcription than TAF10 loss after 3 days of treatment
(A) Experimental strategy. (B) Percentage of mouse (gray), Drosophila (purple), and yeast (pink) reads. (C and D) Principal-component analysis (PCA) of RT7 (C) and RT10 (D) control (white dot) and mutant (colored dot) mESC nascent transcriptomes. (E and F) MA plots of mutant versus control RT7 (E) and RT10 (F) mESCs, with the numbers and percentages of significantly down- (green) or upregulated (purple) protein-coding transcripts displayed on the right and total transcripts shown at the bottom (20 normalized reads per gene length in kilobases threshold, adjusted p ≤ 0.05 (FDR-corrected Wald test) and |log2 fold change| ≥ 1). (G) Global log2 fold change comparisons in TAF7- and TAF10-depleted mESCs. (H) Correlation plot of the log2 fold changes in TAF7- and TAF10-depleted mESCs. Significantly differentially regulated transcripts are highlighted as follows: only in TAF7-depleted cells (blue), only in TAF10-depleted cells (orange), and downregulated (green) or upregulated (purple) in both depleted mESCs. (I and J) UCSC genome browser views of nascent RNA, TBP distribution, and Pol II at Prmt5 (I) and Hes1 (J) loci between control (Ctrl RT7 and Ctrl RT10), TAF7-depleted (−Taf7), and TAF10-depleted (−Taf10) mESCs. The y axes indicate the genomic coverage, and arrows indicate direction of transcription.
Figure 7.
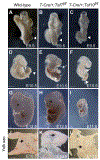
Figure 7.. Conditional deletion of Taf7 or Taf10 in the early mesoderm results in similar yet different phenotypes
(A–I) Whole-mount views of wild-type (A, D, and G) and Tg(T-Cre/+);Taf7f/f (B, E, and H) and Tg(T-Cre/+);Taf10f/f (C, F, and I) mutant embryos at E9.5 (A–C, n > 4), E10.5 (D–F, n > 4), and E12.5 (G and H, n > 2). As no Tg(T-Cre/+);Taf10f/f mutant embryos could be recovered at E12.5, an E11.5 Tg(T-Cre/+);Taf10f/f mutant embryo is shown (I). White arrowheads, forelimbs (A–C) and hindlimbs (D–F); white arrows, heart (D–F); dashed lines, limb buds (G and H). (J–L) Whole-mount views of wild-type (J), Tg(T-Cre/+);Taf7f/f (K), and Tg(T-Cre/+);Taf10f/f (L) embryo yolk sacs (n > 3). Black arrows, blood vessels. Scale bars, 1 mm.

References

    1. Roeder RG (2019). 50+ years of eukaryotic transcription: an expanding universe of factors and mechanisms. Nat. Struct. Mol. Biol 26, 783–791. 10.1038/s41594-019-0287-x. - DOI - PMC - PubMed
    1. Bieniossek C, Papai G, Schaffitzel C, Garzoni F, Chaillet M, Scheer E, Papadopoulos P, Tora L, Schultz P, and Berger I (2013). The architecture of human general transcription factor TFIID core complex. Nature 493, 699–702. 10.1038/nature11791. - DOI - PubMed
    1. Patel AB, Louder RK, Greber BJ, Grünberg S, Luo J, Fang J, Liu Y, Ranish J, Hahn S, and Nogales E (2018). Structure of human TFIID and mechanism of TBP loading onto promoter DNA. Science 362, eaau8872. 10.1126/science.aau8872. - DOI - PMC - PubMed
    1. Jacobson RH, Ladurner AG, King DS, and Tjian R (2000). Structure and Function of a Human TAFII250 Double Bromodomain Module. Science 288, 1422–1425. 10.1126/science.288.5470.1422. - DOI - PubMed
    1. Vermeulen M, Mulder KW, Denissov S, Pijnappel WWMP, van Schaik FMA, Varier RA, Baltissen MPA, Stunnenberg HG, Mann M, and Timmers HTM (2007). Selective anchoring of TFIID to nucleosomes by trimethylation of histone H3 lysine 4. Cell 131, 58–69. 10.1016/j.cell.2007.08.016. - DOI - PubMed

Publication types

MeSH terms