. 2024 Oct 1;35(10):1312-1329.
doi: 10.1681/ASN.0000000000000428. Epub 2024 Jun 10.

METTL3-Mediated N 6 -Methyladenosine mRNA Modification and cGAS-STING Pathway Activity in Kidney Fibrosis

Affiliations

METTL3-Mediated N 6 -Methyladenosine mRNA Modification and cGAS-STING Pathway Activity in Kidney Fibrosis

Yu-Cheng Tsai et al. J Am Soc Nephrol. .

Abstract

Background: Chemical modifications on RNA profoundly affect RNA function and regulation. m6A, the most abundant RNA modification in eukaryotes, plays a pivotal role in diverse cellular processes and disease mechanisms. However, its importance is understudied in human CKD samples regarding its influence on pathological mechanisms.

Methods: Liquid chromatography–tandem mass spectrometry and methylated RNA immunoprecipitation sequencing were used to examine alterations in m6A levels and patterns in CKD samples. Overexpression of the m6A writer METTL3 in cultured kidney tubular cells was performed to confirm the effect of m6A in tubular cells and explore the biological functions of m6A modification on target genes. In addition, tubule-specific deletion of Mettl3 (Ksp-Cre Mettl3f/f) mice and antisense oligonucleotides inhibiting Mettl3 expression were used to reduce m6A modification in an animal kidney disease model.

Results: By examining 127 human CKD samples, we observed a significant increase in m6A modification and METTL3 expression in diseased kidneys. Epitranscriptomic analysis unveiled an enrichment of m6A modifications in transcripts associated with the activation of inflammatory signaling pathways, particularly the cyclic guanosine monophosphate–AMP synthase (cGAS)-stimulator of IFN genes (STING) pathway. m6A hypermethylation increased mRNA stability in cGAS and STING1 as well as elevated the expression of key proteins within the cGAS-STING pathway. Both the tubule-specific deletion of Mettl3 and the use of antisense oligonucleotides to inhibit Mettl3 expression protected mice from inflammation, reduced cytokine expression, decreased immune cell recruitment, and attenuated kidney fibrosis.

Conclusions: Our research revealed heightened METTL3-mediated m6A modification in fibrotic kidneys, particularly enriching the cGAS-STING pathway. This hypermethylation increased mRNA stability for cGAS and STING1, leading to sterile inflammation and fibrosis.


Conflict of interest statement

Disclosure forms, as provided by each author, are available with the online version of the article at http://links.lww.com/JSN/E734.

Figures

None
Graphical abstract
Figure 1
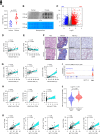
Figure 1
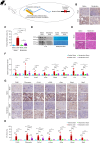
METTL3 and m6A modification level are upregulated in human CKD. (A) m6A/A ratio quantified by LC-MS/MS in normal (fibrosis rate ≤10%) and fibrotic (fibrosis rate >10%) kidneys. (B) Detection of m6A levels displayed in the m6A dot plot. (C) Volcano plot illustrating gene expression changes in 127 microdissected kidney samples. (D) Correlation between METTL3 expression and the percentage of tubular interstitial fibrosis. (E) Correlation between METTL3 expression and eGFR. (F) Representative images of H&E staining, Masson staining, and METTL3 IHC in control and fibrotic kidneys. Scale bar=250 μm. (G) Correlation between kidney fibrosis rate and the expression of genes that previously reported to activate METTL3. (H) Correlation between METTL3 expression and its regulatory genes in the kidneys. (I) Chromatin accessibility of METTL3 analyzed by scATAC-seq in control and diseased proximal tubular cells in human kidneys. (J) Violin plots quantify the METTL3 promoter accessibility in normal and diseased human kidneys. (K) Correlation between METTL3 and kidney fibrosis marker genes in human kidneys. Data are presented as mean±SD. Significance is determined by Student's t test (A and J) and Pearson linear correlation (D, E, H, and K). In (A), (B), and METTL3 IHC stain in (F), a total of 19 patients were included, with ten patients in the control group and nine patients in the fibrosis group. We maintained equal gender distribution across both groups. HDAC, histone deacetylase; H&E, hematoxylin and eosin; IHC, immunohistochemistry; JUN, jun proto-oncogene; LC-MS/MS, liquid chromatography–tandem mass spectrometry; PTs, proximal tubule cells; scATAC-seq, single-cell Assay for Transposase-Accessible Chromatin sequencing.
Figure 2
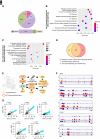
Figure 2
Integrated epitranscriptomic and transcriptomic analysis reveals m6A peaks in the cGAS-STING DNA sensing pathway in the diseased kidney. (A) Distribution of m6A-hypermethylated regions in different mRNA motifs in human kidney samples. (B) IPA determines the top ten pathways enriched with differential m6A modifications in CKD. (C) IPA identifies the top ten significantly activated pathways in CKD. (D) Integration of MeRIP-seq and RNA sequencing revealed 64 genes concurrently upregulated in both m6A methylation and RNA expression within the pathogen-induced cytokine storm signaling pathway. (E) An illustrating figure marked m6A-enriched transcripts in the cGAS-STING DNA sensing pathway. (F) Genome browser snapshots display m6A DMRs in the five cGAS-STING genes in normal control (N) and high fibrotic (H) human kidneys. The track boxes corresponding to the target gene locus depict RNA sequence motifs that have been predicted using SRAMP. (G) Correlation between kidney expression of METTL3 and key genes within the cGAS-STING pathways. Significance is determined by Pearson linear correlation (G). CDS, coding sequence; cGAS, cyclic guanosine monophosphate–AMP synthase; DMR, differential methylated region; IPA, ingenuity pathway analysis; MeRIP-seq, methylated RNA immunoprecipitation sequencing; NLRP3, NOD-, LRR-, and pyrin domain–containing protein 3; SRAMP, sequence-based RNA adenosine methylation site predictor; STING, stimulator of IFN genes; TSS, transcription starting site; UTR, untranslated region.
Figure 3
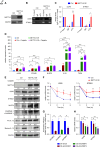
Figure 3
m6A modification increases cGAS and STING1 mRNA stability through IGF2BP proteins. (A) Western blotting of METTL3 in control and METTL3-overexpressing human kidney tubular cells. (B and C) Representative figures illustrate immunoprecipitation of m6A-modified cGAS and STING1 mRNA, along with their quantification in control or METTL3-overexpressing cells (n=3 per group). (D) qRT-PCR quantification of cGAS-STING pathway marker gene expression in control and METTL3-overexpressing cells after cisplatin stimulation (n=3 per group). (E) Representative Western blots of cGAS-STING components in control and METTL3-overexpressing cells after cisplatin stimulation. (F) Decay rate of cGAS and STING1 mRNA after administration of actinomycin D (5 µg/ml) in METTL3-overexpressing cells (n=3 per group). (G) Individual knockdowns of IGF2BP1/2/3 genes in METTL3-overexpressing cells, with knockdown efficiency assessed by qRT-PCR. (H) Decay rate of cGAS and STING1 mRNA after knockdown of IGF2BP1/2/3 is investigated by qRT-PCR (n=3 per group). Data are presented as mean±SD. Significance is determined by Student t test (C, F, G, and H) and one-way ANOVA followed by a Tukey's post hoc test for multiple comparisons (D). *P < 0.05, **P < 0.01, ***P < 0.001, ****P < 0.0001. CASPASE, cysteine-aspartic proteases; IGF2BP, insulin-like growth factor 2 mRNA-binding protein; qRT-PCR, quantitative real-time PCR; TNFA, tumor necrosis factor alpha.
Figure 4
Figure 4
Epitranscriptomic analysis reveals m6A peaks in the cGAS-STING DNA-sensing pathway in a mouse CKD model. (A) qRT-PCR analysis of Mettl3 expression in the kidneys of mice received sham or UUO surgery (n=5 per group). (B) Representative IHC stains illustrate the Mettl3 expression in the kidneys of mice received sham or UUO surgery. Scale bar=100 μm. (C) m6A/A ratio is quantified using LC-MS/MS (n=8 per group). (D) m6A modification is detected in the dot plot. (E) Distribution of m6A-hypermethylated regions in different mRNA motifs in mouse kidney samples. (F) IPA determines the top ten pathways enriched with m6A-hypermethylated genes in the mouse UUO model. (G) Genome browser snapshots display m6A DMRs in the five cGas-Sting genes in control (C) and UUO (U) mouse model. The track boxes corresponding to the target gene locus depict RNA sequence motifs that have been predicted using SRAMP. (H) Heatmap demonstrates the differential expression pattern of key genes in cGas-Sting pathway and its downstream genes in sham and UUO mice. (I) Representative IHC staining illustrates the expression status of cGas, STING1, and Nlrp3 in sham and UUO kidneys. Scale bar=100 μm. (J) Quantification of IHC images. Data are presented as mean±SD. Significance is determined by Student's t test (A and C). ** P < 0.01, ****P <0.0001. UUO, unilateral ureteral obstruction.
Figure 5
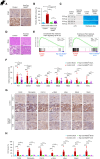
Figure 5
Tubular cell–specific Mettl3 knockout mitigates inflammation and kidney fibrosis progression. (A) Representative IHC staining displays Mettl3 expression in control and Ksp-Cre Mettl3f/f mice before and 14 days after UUO surgery. (B) Quantification of Mettl3 IHC staining in mouse kidneys (C) m6A dot plot compares the m6A levels in kidney tissues from control and Ksp-Cre Mettl3f/f mice 14 days after UUO surgery. (D) Representative images of H&E staining in the two groups 14 days after UUO surgery. (E) GSEA assesses the activity of the inflammation and TNF-α pathways in the control and Ksp-Cre Mettl3f/f groups 14 days following UUO. (F) qRT-PCR reveals differential expression of key genes in the cGas-Sting pathway, downstream inflammation cytokines, and fibrosis markers across four groups of mice. (G) Representative IHC stains of cGas-Sting pathway proteins and fibrosis markers. (H) Quantification of IHC staining of the cGas-Sting pathway proteins and fibrosis markers in mouse kidneys. Mouse number=10 in each group. Scale bar=100 μm. Data are presented as mean±SD. Significance was determined by one-way ANOVA followed by a Tukey's post hoc test for multiple comparisons (F). *P < 0.05, **P < 0.01, ***P < 0.001, ****P < 0.0001. GSEA, gene set enrichment analysis.
Figure 6
Figure 6
Antisense oligo interfering Mettl3 expression prevents kidney inflammation and fibrosis in a mouse model. (A) Schematic representation demonstrates the mechanism of antisense oligo in the mouse model. (B) Representative IHC staining displays Mettl3 expression in mice received either saline or Morpholino injection 14 days after sham or UUO surgery. (C) Quantification of Mettl3 nuclear expression. (D) A representative m6 A dot plot evaluated m6 A status of mouse kidney samples 14 days after UUO surgery. (E) Representative H&E staining images display kidney morphology changes in mice treated with either saline or Mettl3-targeting Morpholino in the UUO model. (F) qRT-PCR reveals differential expression of key genes in the cGas-Sting pathway, downstream inflammation cytokines, and fibrosis markers across four groups of mice. (G) Representative IHC staining detects cGas-Sting pathway proteins and fibrosis markers. Mouse number=8 in each group. Scale bar=100 μm. (H) Quantification of IHC staining. Data are presented as mean±SD. Significance was determined by one-way ANOVA followed by a Tukey's post hoc test for multiple comparisons (C, F, and H). *P < 0.05, **P < 0.01, ***P < 0.001, ****P < 0.0001.
Figure 7
Figure 7
Epitranscriptomic regulation of the cGAS-STING pathway in CKD. CKD is marked by impaired mitochondrial function and activation of the innate immune system. This activation is triggered by factors such as the leakage of mitochondrial DNA into the cytosol, which can lead to the activation of the cGAS-STING pathway, initiating an innate immune response. Our analysis of 127 human kidney samples revealed increased expression of the m6A writer METTL3 in diseased kidneys. Moreover, we observed heightened m6A modifications in transcripts related to the cGAS-STING pathway, which enhanced their stability. This phenomenon contributed to the exacerbation of the inflammatory response and fibrosis observed in CKD.

References

    1. Dominissini D Moshitch-Moshkovitz S Schwartz S, et al. Topology of the human and mouse m6A RNA methylomes revealed by m6A-seq. Nature. 2012;485(7397):201–206. doi: 10.1038/nature11112 - DOI - PubMed
    1. Liu J Yue Y Han D, et al. A METTL3-METTL14 complex mediates mammalian nuclear RNA N6-adenosine methylation. Nat Chem Biol. 2014;10(2):93–95. doi: 10.1038/nchembio.1432 - DOI - PMC - PubMed
    1. Jia G Fu Y Zhao X, et al. N6-methyladenosine in nuclear RNA is a major substrate of the obesity-associated FTO. Nat Chem Biol. 2011;7(12):885–887. doi: 10.1038/nchembio.687 - DOI - PMC - PubMed
    1. Oerum S, Meynier V, Catala M, Tisne C. A comprehensive review of m6A/m6Am RNA methyltransferase structures. Nucleic Acids Res. 2021;49(13):7239–7255. doi: 10.1093/nar/gkab378 - DOI - PMC - PubMed
    1. Kovesdy CP. Epidemiology of chronic kidney disease: an update 2022. Kidney Int Suppl (2011). 2022;12(1):7–11. doi: 10.1016/j.kisu.2021.11.003 - DOI - PMC - PubMed

LinkOut - more resources