. 2024 Dec:50:102129.
doi: 10.1016/j.tranon.2024.102129. Epub 2024 Sep 30.

GDF15 and LCN2 for early detection and prognosis of pancreatic cancer

Affiliations

GDF15 and LCN2 for early detection and prognosis of pancreatic cancer

Xinxia Zhu et al. Transl Oncol. 2024 Dec.

Abstract

Background: The prognosis of pancreatic ductal adenocarcinomas (PDAC) remains very poor, emphasizing the critical importance of early detection, where biomarkers offer unique potential. Although growth differentiation factor 15 (GDF15) and Lipocalin 2 (LCN2) have been linked to PDAC, their precise roles as biomarkers are uncertain.

Methods: Circulating levels of GDF15 and LCN2 were examined in human PDAC patients, heathy controls, and individuals with benign pancreatic diseases. Circulating levels of IL-6, CA19-9, and neutrophil-to-lymphocyte ratio (NLR) were measured for comparisons. Correlations between PDAC progression and overall survival were assessed. A mouse PDAC model was employed for comprehensive analyses, complementing the human studies by exploring associations with various metabolic and inflammatory parameters. Sensitivity and specificity of the biomarkers were evaluated.

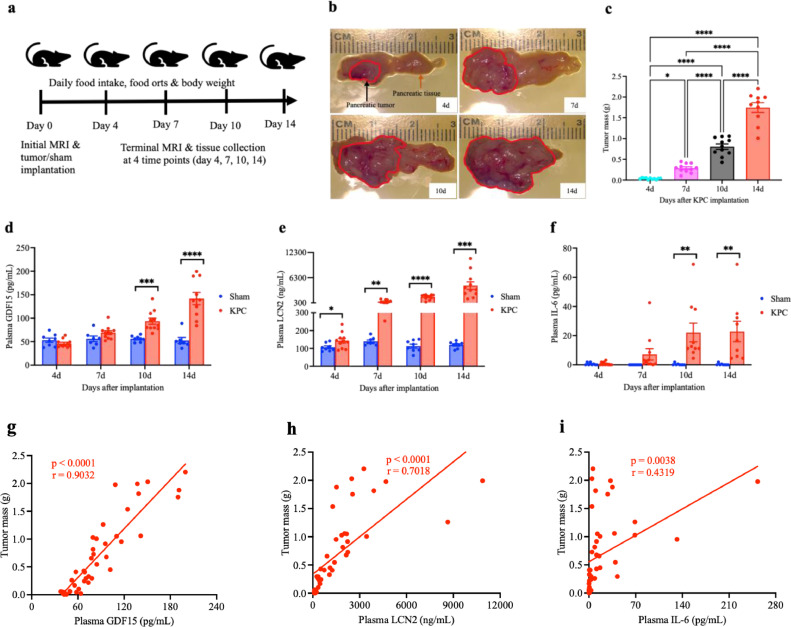
Findings: Our results demonstrated elevated levels of circulating GDF15 and LCN2 in PDAC patients compared to both healthy controls and individuals with benign pancreatic diseases, with higher GDF15 levels associated with disease progression and increased mortality. In PDAC mice, circulating GDF15 and LCN2 progressively increased, correlating with tumor growth, behavioral manifestations, tissue and molecular pathology, and cachexia development. GDF15 exhibited highly sensitive and specific for PDAC patients compared to CA19-9, IL-6, or NLR, while LCN2 showed even greater sensitivity and specificity in PDAC mice. Combining GDF15 and LCN2, or GDF15 and CA19-9, enhanced sensitivity and specificity.

Interpretation: Our findings indicate that GDF15 holds promise as a biomarker for early detection and prognosis of PDAC, while LCN2 could strengthen diagnostic panels.

Keywords: Biomarker; Early detection; GDF15; LCN2; Pancreatic cancer; Prognosis.


Conflict of interest statement

Declaration of competing interest The authors declare the following financial interests/personal relationships which may be considered as potential competing interests: Daniel L Marks reports financial support was provided by NIH NCI. Daniel L Marks reports a relationship with Endevica Bio, Inc that includes: equity or stocks and funding grants. Daniel L Marks reports a relationship with Alkermes Inc that includes: consulting or advisory. Daniel L Marks reports a relationship with Pfizer Inc that includes: consulting or advisory. If there are other authors, they declare that they have no known competing financial interests or personal relationships that could have appeared to influence the work reported in this paper. Xinxia Zhu reports a relationship with Endevica Bio, Inc that includes: equity or stocks. If there are other authors, they declare that they have no known competing financial interests or personal relationships that could have appeared to influence the work reported in this paper. The authors declare that they have no known competing financial interests or personal relationships that could have appeared to influence the work reported in this paper. Brennan Olson, Dove Keith, Mason A Norgard, Peter R Levasseur, Parham Diba, Sara Protzek, Ju Li, Xiaolin Li, Tetiana Korzun, Ariana L Sattler, Abigail C Buenafe, Aaron J Grossberg

Figures

Image, graphical abstract
Graphical abstract
Fig. 1
Fig. 1
Circulating GDF15 and LCN2 are elevated and associated in patients with PDAC. Serum concentrations of GDF15 (a), LCN2 (b), and IL-6 (c) in patients with PDAC or benign pancreatic diseases (PD), and healthy controls. (d) Serum CA19-9 concentrations in PDAC patients and healthy controls. (e) Serum GDF15 level changes in PDAC patients with multiple follow-up blood draws. Data in (a-e) are expressed with each dot representing one sample. (a-d) Healthy control group, n = 42, benign PD group, n = 138, PDAC groups, n = 249. (e) PDAC group, n = 9–39. *P < 0.05; **P < 0.01; ****P < 0.0001. One-way ANOVA (a-c) and (e). Mann-Whitney test (d).
Fig. 2
Fig. 2
Circulating GDF15 levels are correlated to poor survival in patients with PDAC. Overall survival probability in patients with pancreatic cancer dichotomized by levels of 535.9 pg/mL GDF15 (a), 112.3 ng/mL LCN2 (b), 25.73 pg/mL IL-6 (c), 56.9 U/mL CA19-9 (d), and 5.25 NLR (e) at diagnosis. n = 137 (a-d), n = 44 (e). All data in (a-e) are analyzed by the Log-rank Mantel-Cox test (two sided).
Fig. 3
Fig. 3
Association of circulating GDF15 and LCN2 with pancreatic tumor growth in mice. (a) Schematic of experimental procedures: orthotopic implantation of KPC tumor cells or sham-operation, time points for measurement of food intake, orts (food spillage), body weight, and body composition by MRI, and for euthanasia and tissue collection. (b) Tumor size, and (c) Tumor mass at 4 time points (day 4, 7, 10, and 14) after implantation of KPC cells. Plasma levels of GDF15 (d), LCN2 (e), and IL-6 (f). (g-i) Correlations between plasma GDF15, LCN2, IL-6 levels and tumor mass. All data in (c-i) are expressed with each dot representing one sample. (c-f) Sham group, n = 7–8, KPC tumor group, n = 10–11. (g-i) Sham group, n = 30, KPC tumor group, n = 43. *P < 0.05; **P < 0.01; ***P < 0.001; ****P < 0.0001. One-way ANOVA (c). Unpaired Student's t-test for each pair (KPC vs sham) at each time point (d-f). Pearson correlation coefficient and linear regression-fitting curves (g-i).
Fig. 4
Fig. 4
Elevation of circulating GDF15 and LCN2 is linked to the severity of anorexia, body mass loss, and fatigue in PDAC mice. (a) Daily food intake after orthotopic implantation of KPC tumor cells or sham-operation. (b) Total food intake in sham and KPC tumor mice. (c) Correlations between plasma GDF15, LCN2, IL-6 levels and total food intake at each time point. (d) Fat mass net gain. (e) Correlations between plasma GDF15, LCN2, IL-6 levels and fat mass net gain. (f) Lean mass net gain. (g) Correlations between plasma GDF15, LCN2, IL-6 levels and lean mass net gain. (h) In a separate experiment for locomotor activity measurement, locomotor activity in dark (active) phase and light (inactive) phase before and after KPC tumor implantation or sham-operation. 12-hour movement counts were summed for dark phase and light phase of each day. (i) Locomotor activity changes in dark and light phase. (j) Correlations between plasma GDF15, LCN2, IL-6 levels and dark phase movement. All data in (a), (h), and (i) are expressed as mean ± SEM for each group, and all data in (b-g) and (j) are expressed with each dot representing one sample. (a-d) and (f), sham group, n = 7–8, KPC group, n = 10–11. (e), (g), and (j), sham group, n = 30, KPC group, n = 43. (h) and (i), sham group, n = 10, KPC group, n = 10. *P < 0.05; **P < 0.01; ***P < 0.001; ****P < 0.0001. Two-way ANOVA (a), (h), and (i). Unpaired Student's t-test for each pair (KPC vs sham) at each time point (b), (d), and (f). Pearson correlation coefficient and linear regression-fitting curves (c), (e), (g), and (j).
Fig. 4
Fig. 4
Elevation of circulating GDF15 and LCN2 is linked to the severity of anorexia, body mass loss, and fatigue in PDAC mice. (a) Daily food intake after orthotopic implantation of KPC tumor cells or sham-operation. (b) Total food intake in sham and KPC tumor mice. (c) Correlations between plasma GDF15, LCN2, IL-6 levels and total food intake at each time point. (d) Fat mass net gain. (e) Correlations between plasma GDF15, LCN2, IL-6 levels and fat mass net gain. (f) Lean mass net gain. (g) Correlations between plasma GDF15, LCN2, IL-6 levels and lean mass net gain. (h) In a separate experiment for locomotor activity measurement, locomotor activity in dark (active) phase and light (inactive) phase before and after KPC tumor implantation or sham-operation. 12-hour movement counts were summed for dark phase and light phase of each day. (i) Locomotor activity changes in dark and light phase. (j) Correlations between plasma GDF15, LCN2, IL-6 levels and dark phase movement. All data in (a), (h), and (i) are expressed as mean ± SEM for each group, and all data in (b-g) and (j) are expressed with each dot representing one sample. (a-d) and (f), sham group, n = 7–8, KPC group, n = 10–11. (e), (g), and (j), sham group, n = 30, KPC group, n = 43. (h) and (i), sham group, n = 10, KPC group, n = 10. *P < 0.05; **P < 0.01; ***P < 0.001; ****P < 0.0001. Two-way ANOVA (a), (h), and (i). Unpaired Student's t-test for each pair (KPC vs sham) at each time point (b), (d), and (f). Pearson correlation coefficient and linear regression-fitting curves (c), (e), (g), and (j).
Fig. 5
Fig. 5
Elevation of circulating GDF15 and LCN2 is associated with fat and muscle wasting in PDAC mice. (a) Brown adipose tissue (BAT), (b) Inguinal adipose tissue (iWAT), and (c) Gonadal adipose tissue (gWAT) weights. (d) Correlation between plasma GDF15, LCN2, IL-6 levels and gWAT mass. (e) Heart mass. (f) Correlations between plasma GDF15, LCN2, IL-6 levels and heart mass. (g) Quadriceps. (h)Tibialis. (i) Soleus mass. (j) Gastrocnemius mass. (k) Correlations between plasma GDF15, LCN2, IL-6 levels and gastrocnemius mass. (l) Gene expression in gastrocnemii. (m) Terminal blood glucose levels. (n) Correlations between plasma GDF15, LCN2, IL-6 levels and blood glucose levels. All data in (a-n) are expressed with each dot representing one sample. *P < 0.05; **P < 0.01; ***P < 0.001; ****P < 0.0001. Unpaired Student's t-test for each pair (KPC vs sham) at each time point in (a-c), (e), (g-j), (l), and (m), sham group, n = 7–8, KPC group, n = 10–11. Pearson correlation coefficient and linear regression-fitting curves in (d), (f), (k), and (n), sham group, n = 30, KPC group, n = 43.
Fig. 5
Fig. 5
Elevation of circulating GDF15 and LCN2 is associated with fat and muscle wasting in PDAC mice. (a) Brown adipose tissue (BAT), (b) Inguinal adipose tissue (iWAT), and (c) Gonadal adipose tissue (gWAT) weights. (d) Correlation between plasma GDF15, LCN2, IL-6 levels and gWAT mass. (e) Heart mass. (f) Correlations between plasma GDF15, LCN2, IL-6 levels and heart mass. (g) Quadriceps. (h)Tibialis. (i) Soleus mass. (j) Gastrocnemius mass. (k) Correlations between plasma GDF15, LCN2, IL-6 levels and gastrocnemius mass. (l) Gene expression in gastrocnemii. (m) Terminal blood glucose levels. (n) Correlations between plasma GDF15, LCN2, IL-6 levels and blood glucose levels. All data in (a-n) are expressed with each dot representing one sample. *P < 0.05; **P < 0.01; ***P < 0.001; ****P < 0.0001. Unpaired Student's t-test for each pair (KPC vs sham) at each time point in (a-c), (e), (g-j), (l), and (m), sham group, n = 7–8, KPC group, n = 10–11. Pearson correlation coefficient and linear regression-fitting curves in (d), (f), (k), and (n), sham group, n = 30, KPC group, n = 43.
Fig. 6
Fig. 6
Severity of systemic, local, and central inflammation is linked to the elevation of circulating GDF15 and LCN2 in PDAC mice. (a) Blood leukocyte counts. (b) Blood neutrophil-to-lymphocyte ratio (NLR). (c) Correlation between plasma GDF15, LCN2, IL-6 levels and blood NLR. (d) Spleen weight. (e) Representative pancreatic tumor sections with H&E staining. 40X magnification with a light microscope, arrows in cyan indicate normal neutrophils and arrows in red indicate inflamed neutrophils. (f) Infiltrated neutrophil counts in tumor site. Summed neutrophil counts of three tumor tissue sections in each animal were quantified and averaged, and 3 animals from each group (each time point) were evaluated. (g) Gene expression in pancreatic tissue and pancreatic tumor at day 14 time point. (h) Gene expression in the hypothalamus. Sham group, n = 7–8, KPC group, n = 10–11. All data in (a-d) and (f-h) are expressed with each dot representing one sample. (a), (b), (d), and (h), sham group, n = 7–8, KPC group, n = 10–11. (c) sham group, n = 30, KPC group, n = 43. (f), KPC group, n = 3. (g) Sham-pancreas group, KPC-pancreas group, KPC-tumor group, n = 7. *P < 0.05; **P < 0.01; ***P < 0.001; ****P < 0.0001. Unpaired Student's t-test for each pair (KPC vs sham) at each time point (a), (b), (d), and (h). Pearson correlation coefficient and linear regression-fitting curves (c). One-way ANOVA (f) and (g).
Fig. 6
Fig. 6
Severity of systemic, local, and central inflammation is linked to the elevation of circulating GDF15 and LCN2 in PDAC mice. (a) Blood leukocyte counts. (b) Blood neutrophil-to-lymphocyte ratio (NLR). (c) Correlation between plasma GDF15, LCN2, IL-6 levels and blood NLR. (d) Spleen weight. (e) Representative pancreatic tumor sections with H&E staining. 40X magnification with a light microscope, arrows in cyan indicate normal neutrophils and arrows in red indicate inflamed neutrophils. (f) Infiltrated neutrophil counts in tumor site. Summed neutrophil counts of three tumor tissue sections in each animal were quantified and averaged, and 3 animals from each group (each time point) were evaluated. (g) Gene expression in pancreatic tissue and pancreatic tumor at day 14 time point. (h) Gene expression in the hypothalamus. Sham group, n = 7–8, KPC group, n = 10–11. All data in (a-d) and (f-h) are expressed with each dot representing one sample. (a), (b), (d), and (h), sham group, n = 7–8, KPC group, n = 10–11. (c) sham group, n = 30, KPC group, n = 43. (f), KPC group, n = 3. (g) Sham-pancreas group, KPC-pancreas group, KPC-tumor group, n = 7. *P < 0.05; **P < 0.01; ***P < 0.001; ****P < 0.0001. Unpaired Student's t-test for each pair (KPC vs sham) at each time point (a), (b), (d), and (h). Pearson correlation coefficient and linear regression-fitting curves (c). One-way ANOVA (f) and (g).
Fig. 7
Fig. 7
Assessment of sensitivity and specificity of circulating GDF15 and LCN2 for patients and mice with PDAC. (a-c) ROC curves of GDF15, LCN2, and CA19-9 in PDAC patients vs healthy controls. (d) Integrated ROC curves of GDF15-CA19-9, GDF15-LCN2, and ROC curves of GDF15 alone, LCN2 alone and CA19-9 alone in PADC patients vs healthy controls. (e) and (f) ROC curves of GDF15 and LCN2 in KPC vs sham mice. (g) Integrated ROC curve of GDF15-LCN2, and ROC curves of GDF15 alone and LCN2 alone in KPC vs sham mice. (a-d) PDAC patients, n = 249, healthy controls, n = 42. (e-g) Sham mice, n = 30, KPC mice, n = 43.

References

    1. Grossberg A.J., Chu L.C., Deig C.R., Fishman E.K., Hwang W.L., Maitra A., Marks D.L., Mehta A., Nabavizadeh N., Simeone D.M., et al. Multidisciplinary standards of care and recent progress in pancreatic ductal adenocarcinoma. CA Cancer J. Clin. 2020;70:375–403. doi: 10.3322/caac.21626. - DOI - PMC - PubMed
    1. Mizrahi J.D., Surana R., Valle J.W., Shroff R.T. Pancreatic cancer. Lancet. 2020;395:2008–2020. doi: 10.1016/s0140-6736(20)30974-0. - DOI - PubMed
    1. Zhou Z., Edil B.H., Li M. Combination therapies for cancer: challenges and opportunities. BMC Med. 2023;21:171. doi: 10.1186/s12916-023-02852-4. - DOI - PMC - PubMed
    1. Halbrook C.J., Lyssiotis C.A., Pasca di Magliano M., Maitra A. Pancreatic cancer: advances and challenges. Cell. 2023;186:1729–1754. doi: 10.1016/j.cell.2023.02.014. - DOI - PMC - PubMed
    1. Siegel R.L., Miller K.D., Wagle N.S., Jemal A. Cancer statistics, 2023. CA Cancer J. Clin. 2023;73:17–48. doi: 10.3322/caac.21763. - DOI - PubMed

LinkOut - more resources