. 2024 Oct:108:105364.
doi: 10.1016/j.ebiom.2024.105364. Epub 2024 Sep 30.

PfSPZ Vaccine induces focused humoral immune response in HIV positive and negative Tanzanian adults

Affiliations

PfSPZ Vaccine induces focused humoral immune response in HIV positive and negative Tanzanian adults

Anneth Tumbo et al. EBioMedicine. 2024 Oct.

Abstract

Background: PfSPZ Vaccine, a promising pre-erythrocytic stage malaria vaccine candidate based on whole, radiation-attenuated Plasmodium falciparum (Pf) sporozoites (SPZ), has proven safe and effective in mediating sterile protection from malaria in malaria-naïve and exposed healthy adults. Vaccine-induced protection presumably depends on cellular responses to early parasite liver stages, but humoral immunity contributes.

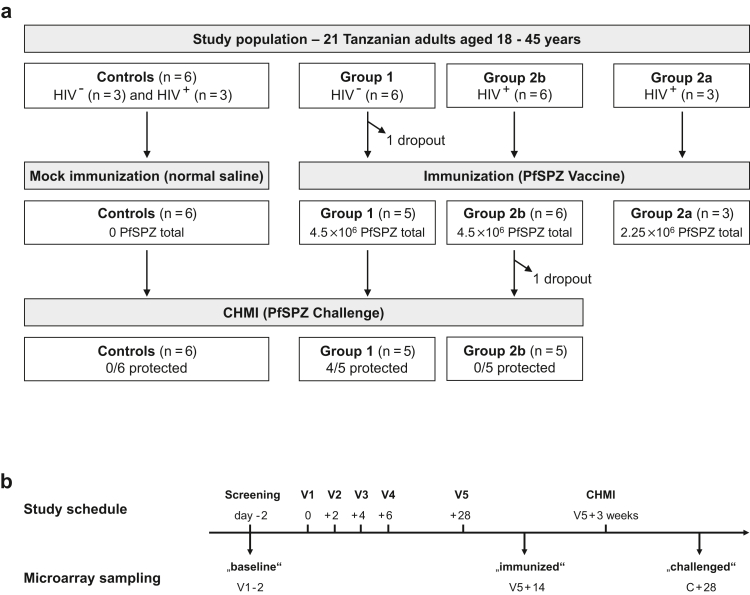
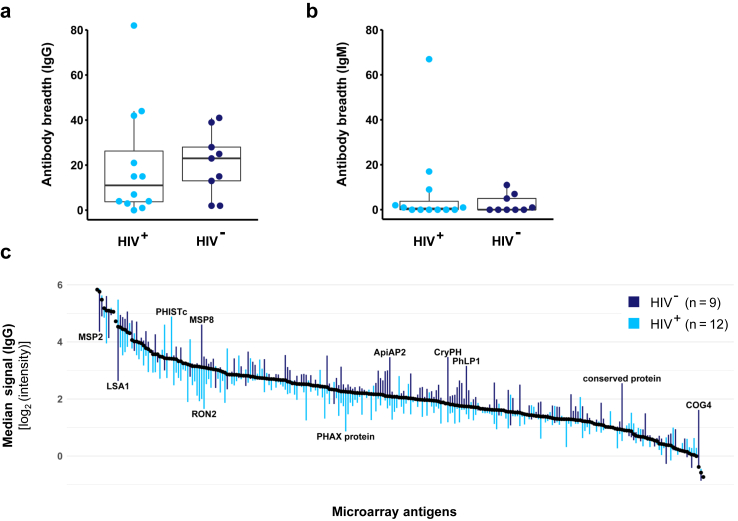
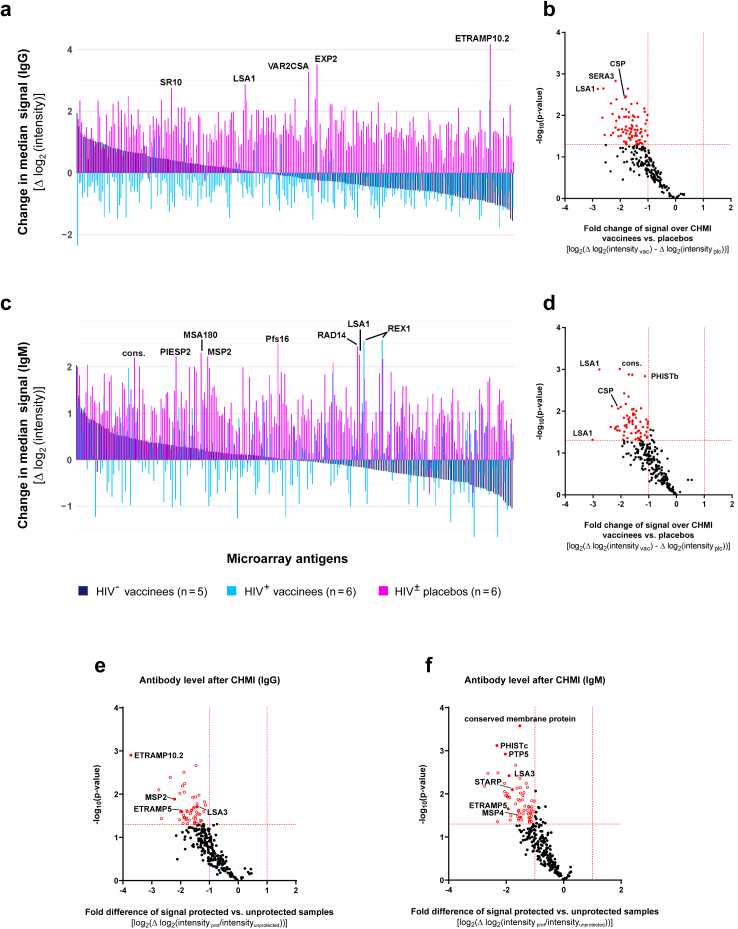
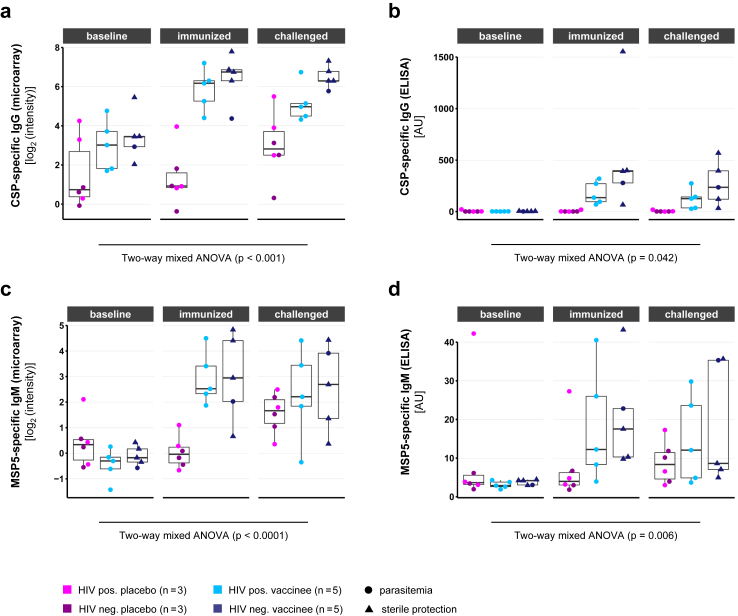
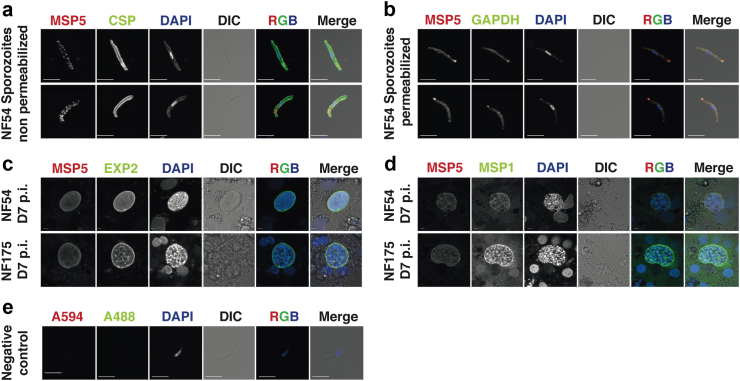
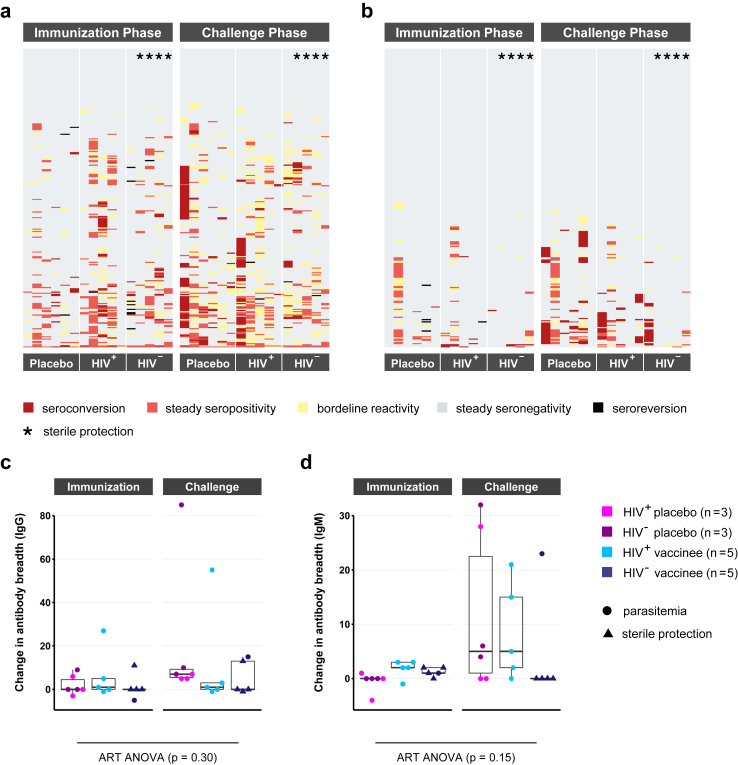
Methods: On custom-made Pf protein microarrays, we profiled IgG and IgM responses to PfSPZ Vaccine and subsequent homologous controlled human malaria infection (CHMI) in 21 Tanzanian adults with (n = 12) or without (n = 9) HIV infection. Expression of the main identified immunogens in the pre-erythrocytic parasite stage was verified by immunofluorescence detection using freshly purified PfSPZ and an in vitro model of primary human hepatocytes.

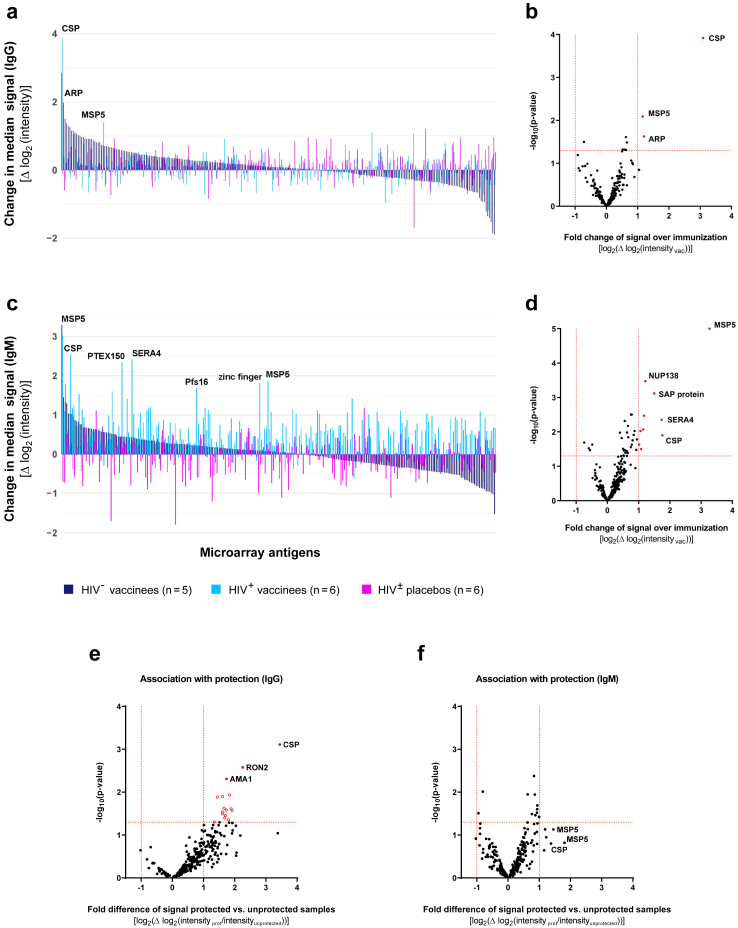
Findings: Independent of HIV infection status, immunisation induced focused IgG and IgM responses to circumsporozoite surface protein (PfCSP) and merozoite surface protein 5 (PfMSP5). We show that PfMSP5 is detectable on the surface and in the apical complex of PfSPZ.

Interpretation: Our data demonstrate that HIV infection does not affect the quantity of the total IgG and IgM antibody responses to PfCSP and PfMSP5 after immunization with PfSPZ Vaccine. PfMSP5 represents a highly immunogenic, so far underexplored, target for vaccine-induced antibodies in malaria pre-exposed volunteers.

Funding: This work was supported by the Equatorial Guinea Malaria Vaccine Initiative (EGMVI), the Clinical Trial Platform of the German Center for Infection Research (TTU 03.702), the Swiss Government Excellence Scholarships for Foreign Scholars and Artists (grant 2016.0056) and the Interdisciplinary Center for Clinical Research doctoral program of the Tübingen University Hospital. The funders had no role in design, analysis, or reporting of this study.

Keywords: HIV; PfSPZ Vaccine; Plasmodium falciparum; Plasmodium falciparum circumsporozoite protein; Plasmodium falciparum merozoite surface protein 5; Protein microarray.


Conflict of interest statement

Declaration of interests Sanaria Inc. manufactured PfSPZ Vaccine and PfSPZ Challenge and was the sponsor of the clinical trial. YA, BKLS, TLR, TM, and SLH are salaried, full-time employees of Sanaria, and LWPC and PFB were full-time, salaried employees of Sanaria at the time the trial was conducted. All authors associated with Sanaria have potential conflicts of interest. All other authors declare that they have no competing interests.

Figures

Fig. 1
Fig. 1
Study design and sampling time points for microarray analysis. (a) Volunteer group allocation. The trial included an HIV positive pilot group (group 2a) that received 4.5 × 105 PfSPZ of PfSPZ Vaccine in each inoculation and did not undergo CHMI. Group 1 and group 2b comprised each six HIV negative and HIV positive volunteers that received five times 9 × 105 of PfSPZ Vaccine in direct venous inoculation. The placebo control group had six volunteers that were HIV negative (n = 3) or HIV positive (n = 3). (b) Serum sample collection and study flow chart. Serum samples for microarray analysis were collected at baseline (V1–2), 14 days after the fifth injection (V5 + 14) and 28 days after CHMI (C + 28).
Fig. 2
Fig. 2
Baseline immunity of study population stratified by HIV infection status. Serum samples of HIV negative (n = 9) and HIV positive (n = 12) study participants were collected at baseline and probed on a protein microarray (see Table S1 for array design and antigen abbreviations). Individual breadths of IgG (a) and IgM (b) antibody responses were compared between HIV positive and HIV negative participants. Antibody breadth was defined as number of seropositive antigens exceeding a signal intensity threshold of 3 log2-levels above a malaria-naïve control. The boxplots give median antibody breadths, interquartile ranges (IQR) and whiskers of length 1.5 × IQR. (c) Antigens are sorted according to their overall median signal intensity, weighted for the different sizes of the HIV positive and HIV negative group. Bars give the deviation of the median signal intensities in the HIV negative (dark blue) and HIV positive group (light blue) from the overall median (see Table S2 list of antigens).
Fig. 3
Fig. 3
Antibody responses aftervaccination usingPfSPZVaccine. To identify vaccination-induced antibodies, microarray reactivity in samples collected after the completed immunisation phase were compared to their individual baseline reactivity. (a, c) Median changes in IgG (a) and IgM (c) signal intensities across 262 microarray antigens over the immunisation phase were assessed amongst placebo recipients (n = 6), HIV negative (n = 5) and HIV positive vaccinees (n = 6). Antigens are sorted by median intensity changes in the HIV negative vaccinees´ group. (b, d) Volcano plots of fold change in IgG (b) and IgM (d) and p-values (paired Student's t-test) of average signal intensity in all vaccinees (n = 11) compared to their baseline for all microarray antigens. In addition, antibodies correlating with sterile protection (protected group: n = 4; unprotected group: n = 12) against CHMI were analysed for both IgG (e) and IgM (f). Differentially recognized antigens (p-value <0.05 and fold change >2) are depicted in red (see Table S1 for antigen abbreviations and Table S3–S8 for summary of data).
Fig. 4
Fig. 4
Changes in antibody responses after homologous challenge. Changes of microarray reactivity due to CHMI were identified by comparing signal intensities in samples collected before and four weeks after inoculation. Study participants were grouped into placebos (n = 6) and recipients of PfSPZ Vaccine (n = 10) with both groups containing equal numbers of HIV positive and HIV negative subjects. (a, c) Median changes of IgG (a) and IgM (c) signal intensities over challenge given for the 262 microarray antigens. Antigens are sorted by median intensity changes in the vaccinees´ group. (b, d) Volcano plot of mean changes in microarray IgG (b) and IgM (d) signal intensities over CHMI in the vaccinees compared to placebo group, as well as in the protected individuals (n = 4) compared to the unprotected individuals (n = 12) for IgG (e) and IgM (f). Fold change and p-values (Welch-corrected Student's t-test) are given for all microarray antigens. Significantly differentially recognized reactive antigens (p-value <0.05 and fold change >2) are depicted in red (see Table S1 for antigen abbreviations and Table S9–S12 for summary of data).
Fig. 5
Fig. 5
Antibody kinetics of vaccine-induced antibodies. Individual protein microarray and quantitative ELISA for anti-PfCSP-IgG (a, b) as well as for anti-PfMSP5-IgM (c, d) results are compared at baseline, 14 days after immunisation and 28 days after challenge. Protein microarray data are represented as normalised, log2-transformed signal intensities (a, c). Antibody concentrations were estimated quantitatively by ELISA in comparison to human IgG and IgM controls, respectively (b, d). Samples included placebos (n = 6), HIV positive (n = 5) and HIV negative vaccinees (n = 5). The influence of intervention group and sampling time point on the measured microarray antigen signal intensity was evaluated using a two-way mixed ANOVA model. The boxplots give median antibody breadths, interquartile ranges (IQR) and whiskers of length 1.5 × IQR.
Fig. 6
Fig. 6
Immunofluorescence of PfMSP5 on pre-erythrocytic stages. Non-permeabilized (a) and permeabilized (b) PfNF54 PfSPZ were stained with rabbit polyclonal antibodies against PfMSP5, the nuclear stain DAPI, and either PfCSP or PfGAPDH respectively. Liver stage forms of PfNF54 and PfNF175 (7 days post invasion) were stained with PfMSP5 and PfEXP2 (c) and PfMSP5 and PfMSP1 (d). The negative control against the secondary antibody used for the PfMSP5 antibodies is shown in (e). Scale bar of 5 microns.
Fig. 7
Fig. 7
Antibody acquisition and change in antibody breadth. Changes in antibody repertoire over the immunisation and challenge phase were compared between placebo recipients (n = 6), HIV positive (n = 5) and HIV negative vaccinees (n = 5). The individual antibody breadth gives the number of seropositive antigens at a certain time point (signal intensity of >3 log2-levels above a malaria-naïve control). Seroconversion, the acquisition of a novel antigen, was defined as exceeding the seropositivity threshold accompanied by a signal increase of >2 log2-levels between the time points compared. Seroreversion was defined as drop below the threshold with a signal decrease of >2 log2-levels. Smaller signal fluctuations around the threshold were designated as borderline reactivity. (a, b) Changes in antigen recognition after immunisation and challenge are shown as heatmap for IgG (a) and IgM (b) with antigens depicted in rows and samples in columns. (c, d) Changes in the IgG (c) and IgM (d) antibody breadth over immunisation and challenge are compared between the three study groups of placebos, HIV positive and negative vaccinees. The influence of study group and phase on the change in antibody breadth was evaluated using an Aligned Rank Transform (ART) ANOVA model. The boxplots give median antibody breadths, interquartile ranges (IQR) and whiskers of length 1.5 × IQR.

References

    1. World Health Organization . 2013. World malaria report 2013.
    1. World Health Organization . 2023. World malaria report 2023.
    1. Phillips M.A., Burrows J.N., Manyando C., van Huijsduijnen R.H., Van Voorhis W.C., Wells T.N.C. Malaria. Nat Rev Dis Prim. 2017;3 - PubMed
    1. mal ERARCPoBS, Enabling T. malERA: an updated research agenda for basic science and enabling technologies in malaria elimination and eradication. PLoS Med. 2017;14(11) - PMC - PubMed
    1. WHO Weekly epidemiological record, 2022, vol. 97, 09 [full issue] Wkly Epidemiol Rec. 2022;97(09):61–80.

MeSH terms

LinkOut - more resources