. 2024 Oct 1;15(1):8476.
doi: 10.1038/s41467-024-52583-0.

The genetic landscape of basal ganglia and implications for common brain disorders

Affiliations

The genetic landscape of basal ganglia and implications for common brain disorders

Shahram Bahrami et al. Nat Commun. .

Abstract

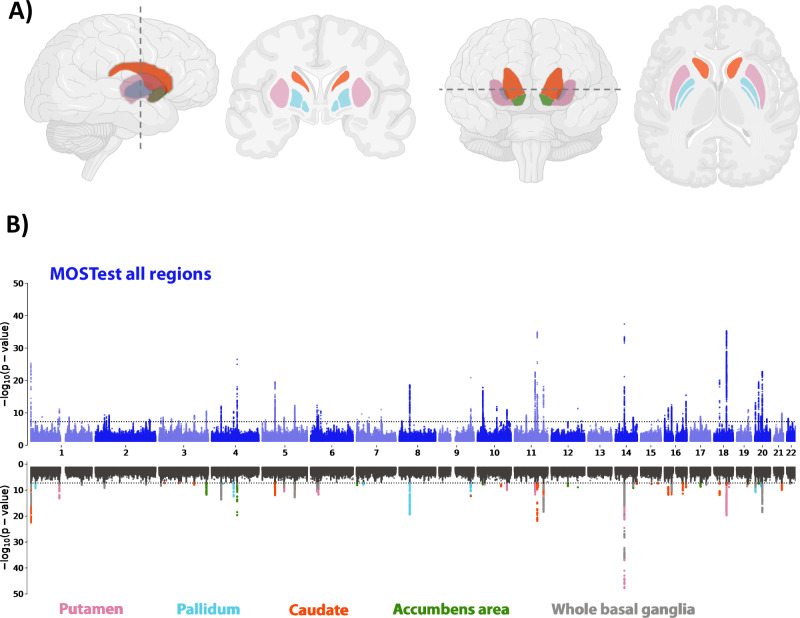
The basal ganglia are subcortical brain structures involved in motor control, cognition, and emotion regulation. We conducted univariate and multivariate genome-wide association analyses (GWAS) to explore the genetic architecture of basal ganglia volumes using brain scans obtained from 34,794 Europeans with replication in 4,808 white and generalization in 5,220 non-white Europeans. Our multivariate GWAS identified 72 genetic loci associated with basal ganglia volumes with a replication rate of 55.6% at P < 0.05 and 87.5% showed the same direction, revealing a distributed genetic architecture across basal ganglia structures. Of these, 50 loci were novel, including exonic regions of APOE, NBR1 and HLAA. We examined the genetic overlap between basal ganglia volumes and several neurological and psychiatric disorders. The strongest genetic overlap was between basal ganglia and Parkinson's disease, as supported by robust LD-score regression-based genetic correlations. Mendelian randomization indicated genetic liability to larger striatal volume as potentially causal for Parkinson's disease, in addition to a suggestive causal effect of greater genetic liability to Alzheimer's disease on smaller accumbens. Functional analyses implicated neurogenesis, neuron differentiation and development in basal ganglia volumes. These results enhance our understanding of the genetic architecture and molecular associations of basal ganglia structure and their role in brain disorders.


Conflict of interest statement

Dr. Andreassen has received a speaker’s honorarium from Lundbeck, Janssen and a consultant for Cortechs.ai. Other authors report no conflicts.

Figures

Fig. 1
Fig. 1. The univariate signatures of basal ganglia volumes indicate high heritability and significant phenotypic and genetic correlations.
A Heritability of basal ganglia volumes (n = 34,794), where the numbers depict SNP-heritability estimates (h2). In the plot, the dots represent mean heritability for each subregion of the basal ganglia, while the error bars represent the standard error (SEM): Putamen in pink (h2 = 0.296, SEM = 0.0.026), Pallidum in light blue (h2 = 0.253, SEM = 0.021), Caudate in red (h2 = 0.342, SEM = 0.025), Accumbens area in green (h2 = 0.261, SEM = 0.02) and whole basal ganglia in gray (h2 = 0.304, SEM = 0.026). B LD-score regression-based genetic correlations (in lower-right section) and phenotypic correlation (in upper-left section) between each pair of regions, using the univariate GWAS summary statistics.
Fig. 2
Fig. 2. The genetic architecture of basal ganglia.
A Schematic illustration of the basal ganglia regions, comprising the anatomically distinguishable subfields of putamen (pink), pallidum (light blue), caudate (red) and accumbens (green). Created with BioRender.com released under a Creative Commons Attribution-NonCommercial-NoDerivs 4.0 International license B The upper part of the Miami plot illustrates the −log10(P) statistic from the multivariate GWAS across the entire basal ganglia (Multivariate Omnibus Statistical Test (MOSTest)), with 72 significant loci. For comparison, the lower part depicts for each of the 72 unique loci the corresponding −log10(P) statistics from univariate GWASs of single subregions (one color per subregion, black indicates non-significant SNPs, p-values are two-tailed), supporting a distributed genetic architecture across the basal ganglia structure. The color codes for the schematic illustration (A) and the Miami plot (B) are consistent and given in the bottom part of the figure.
Fig. 3
Fig. 3. Mapped genes to the significant loci.
Gene mapping of the 72 loci associated with the basal ganglia implied 73 genes by Open target.
Fig. 4
Fig. 4. Genetic overlap between basal ganglia and common brain disorders.
Conjunctional FDR Manhattan plots, showing the –log10 transformed conjunctional FDR values for each SNP on the y-axis and chromosomal positions along the x-axis. The dotted horizontal line represents the threshold for significant shared associations (conjFDR  <  0.05). Independent lead SNPs are encircled in black. ASD autism spectrum disorder, ADHD attention deficit hyperactivity disorder, SCZ schizophrenia, BIP bipolar disorder, MIG migraine, MDD, major depression, PD Parkinson’s disease, ALZ Alzheimer’s disease.
Fig. 5
Fig. 5. Various genes mapped from the conjunctional FDR analysis were implied to overlap between basal ganglia and multiple disorders.
A The figure shows the total number of genes overlapping for each combination of disorders. For example, 8 of the genes overlapping between basal ganglia and SCZ were also found to overlap between basal ganglia and MDD. B All mapped genes to overlapped loci between basal ganglia and disorders and genes that were implied for more than 4 disorders (shown in red). Genes TMEM161B and HP were mapped for four disorders. ASD autism spectrum disorder, ADHD attention deficit hyperactivity disorder, SCZ schizophrenia, BIP bipolar disorder, MIG migraine, MDD, major depression, PD Parkinson’s disease, ALZ Alzheimer’s disease.

References

    1. Alexander, G. E. & Crutcher, M. D. Functional architecture of basal ganglia circuits: neural substrates of parallel processing. Trends Neurosci.13, 266–271 (1990). - PubMed
    1. Parent, A. Extrinsic connections of the basal ganglia. Trends Neurosci.13, 254–258 (1990). - PubMed
    1. Haber, S. N. & Knutson, B. The reward circuit: linking primate anatomy and human imaging. Neuropsychopharmacology35, 4–26 (2010). - PMC - PubMed
    1. Nelson, A. B. & Kreitzer, A. C. Reassessing models of basal ganglia function and dysfunction. Annu. Rev. Neurosci.37, 117–135 (2014). - PMC - PubMed
    1. DeLong, M. R. & Wichmann, T. Circuits and circuit disorders of the basal ganglia. Arch. Neurol.64, 20–24 (2007). - PubMed

Publication types